Hello Traders,
I’m a pro with 7+ years of experience in the market. I want to help out retail traders. So, here I post some of my long-term and short-term setups and crisp points of the reasoning and my conclusion. Hope it benefits you.
3 Likes
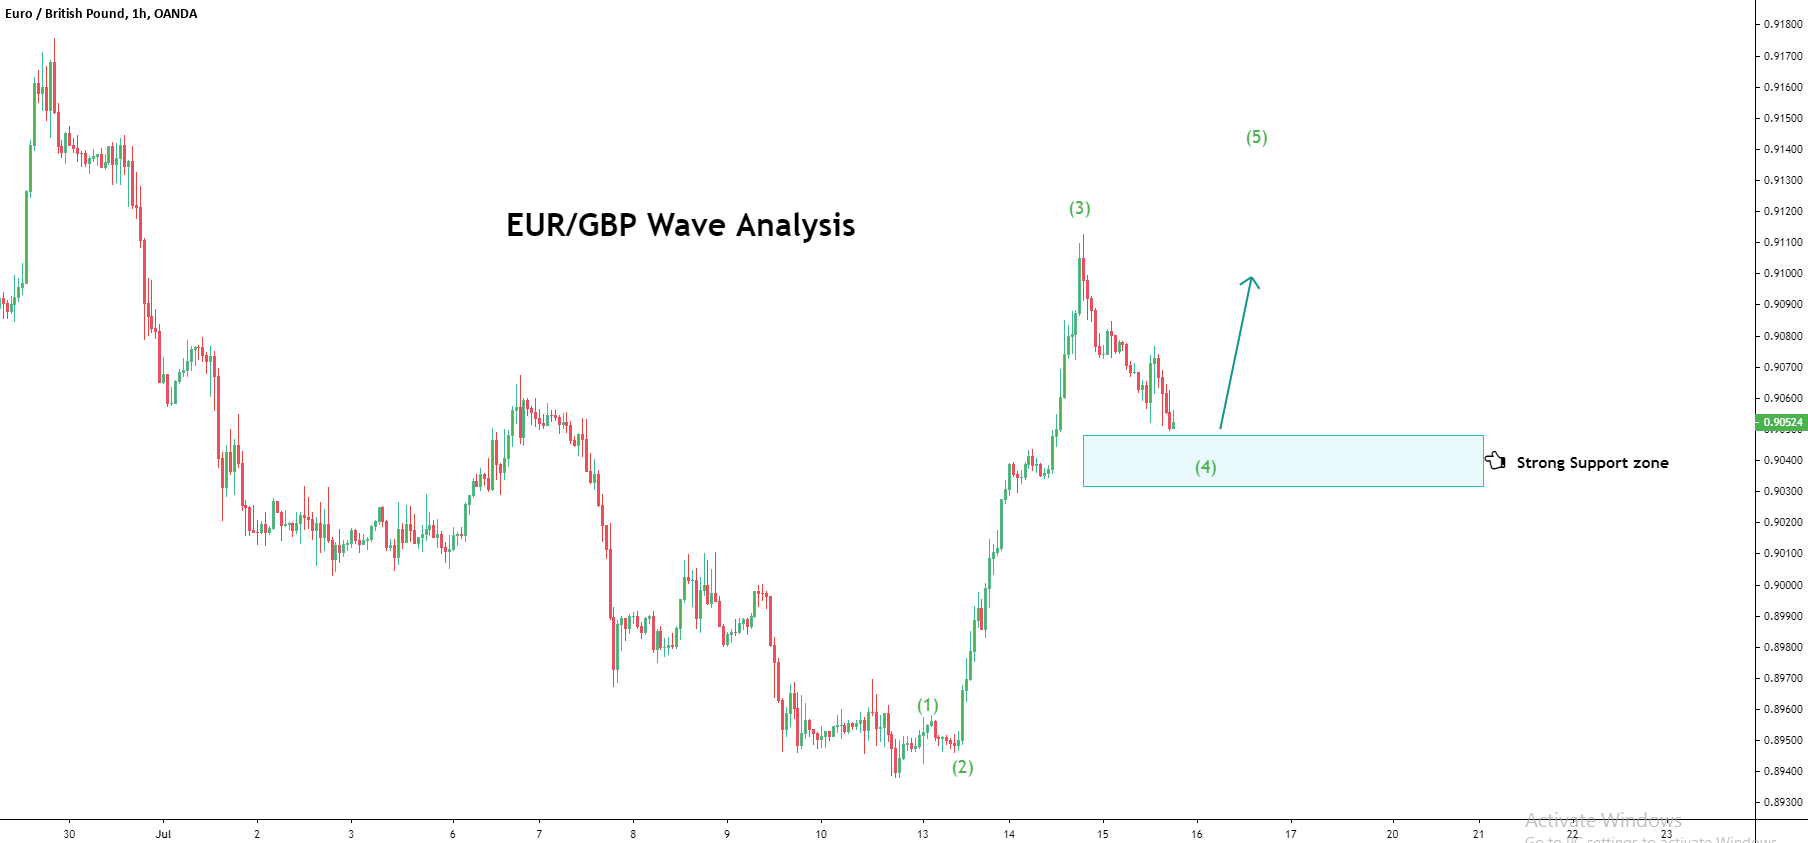
EUR/GBP Wave Analysis
- After dismal data from Britain, EUR/GBP was off to the flyers yesterday.
- It could be interpreted as a wave pattern and is now forming wave 4.
- Further, it is close to a congestion zone which could act as strong support.
- Hence, we expect the pair to be bullish in the near-term.
1 Like
I like to read traders’ reasoning about certain events in the market, because sometimes we all look at the same situations absolutely differently. And it can be quite profitable to look at the situation from the other side and make new, effective conclusions…
3 Likes
Yes, looking forward for your opinions as well
Yes, looking forward for your opinions as well
1 Like
its a very nice reply with good information. thanks for your nice post. got some fine lines.
1 Like
GBP/JPY Wave Analysis
~~ After a strong bull run, the counter is currently in corrective (ABC) mode.
~~ It has completed wave A and is forming its final leg of wave B.
~~ It is now up against a resistive trendline and a break above it can take it higher.
~~ Hence, we advise traders to initiate long positions only when an hourly candle closes above the trendline.

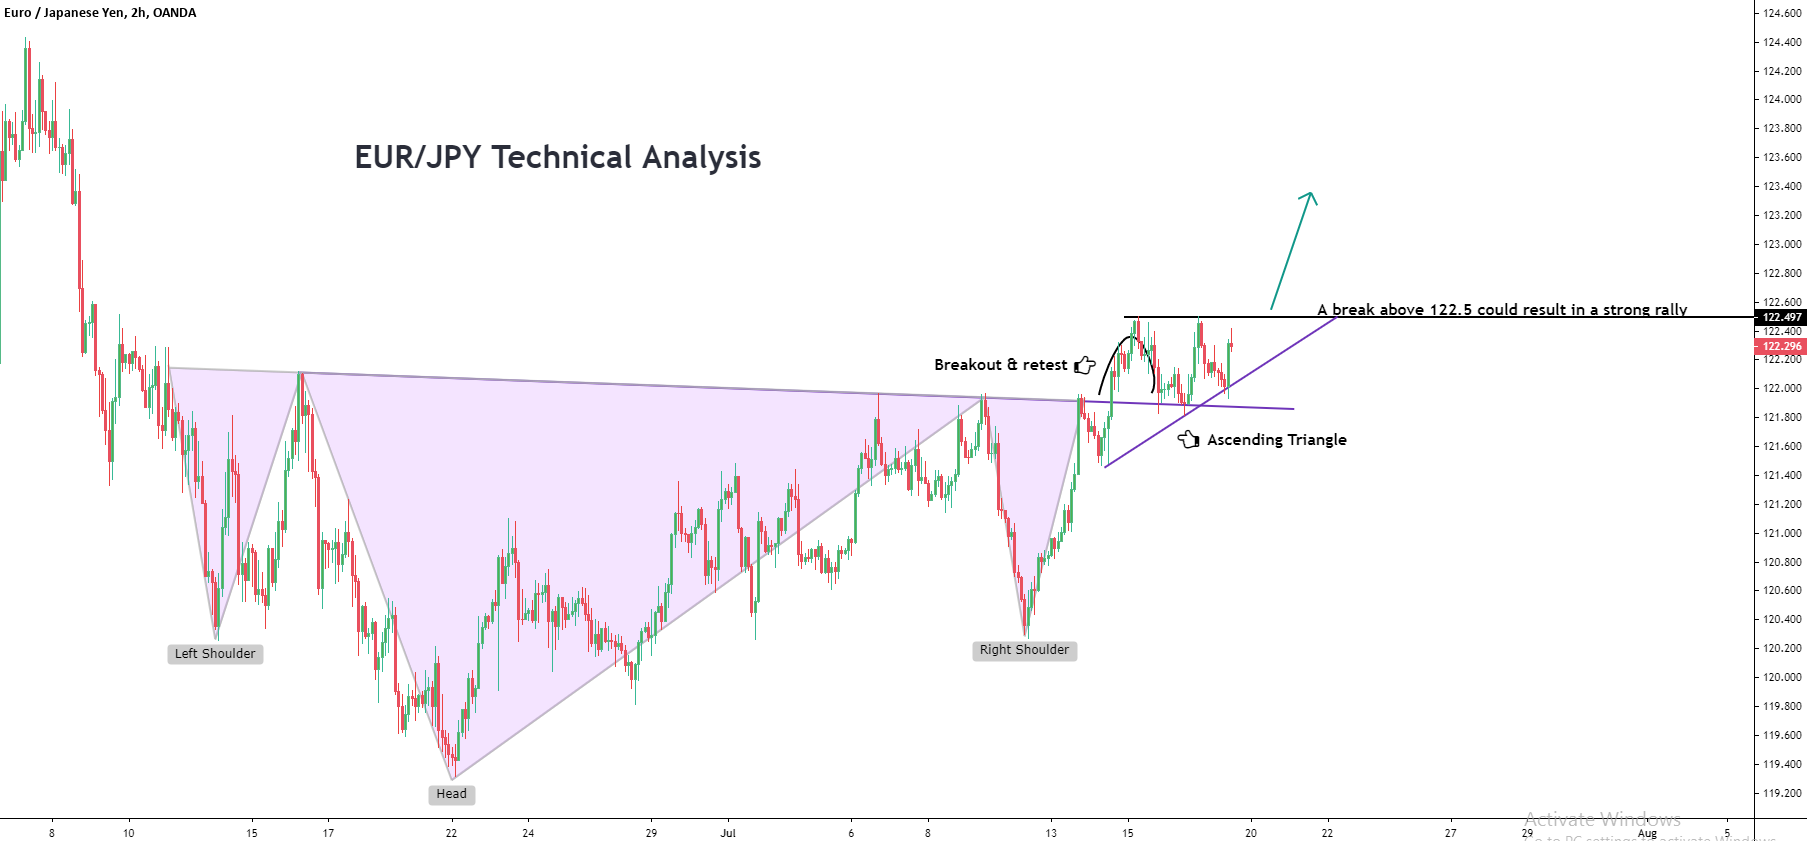
EUR/JPY Technical Analysis
~~ The pair did a long accumulation in the form of an inverted head and shoulder pattern.
~~ It finally broke out and has been consolidating in an ascending triangle (continuation) pattern since then.
~~ Hence, we expect the pair to have a strong bull run when it breaks the resistance level of 122.5.
1 Like
EUR/CAD Technical Analysis
- The counter has been formed a long base formation.
- Further, it could be interpreted as a correction after a strong impulse move.
- It has crossed the critical resistance level of 1.55279 and is consolidating above it.
- And the MACD indicator has turned bullish and is having good momentum.
- Hence, we expect the pair to be bullish in the short-term trading.

1 Like
USD/JPY Technical Analysis
~~ The counter is currently at the strong support of a trendline, which could be contemplated as triangle pattern.
~~ According to the short-term waves, the counter has completed wave B of a bear cycle and is due for a wave C.
~~ Hence, we expect the pair to be bullish and head to higher to levels.

AUD/NZD Wave Analysis
- The counter is currently in a long-term bear cycle.
- It is currently in its second leg of wave B.
- Further, it resembles a flag formation and is coming down after hitting the upper parallel.
- Hence, we expect the pair to be bearish and move to the lower parallel from here.

EUR/USD Technical Analysis
~~ The counter is currently in a strong bull run.
~~ It is forming a parabolic pattern, which suggests further strong upmove is on the cards.
~~ Also, the pair is forming a bullish pennant pattern in the short-term charts.
~~ We expect it to surge sharply higher for the day.

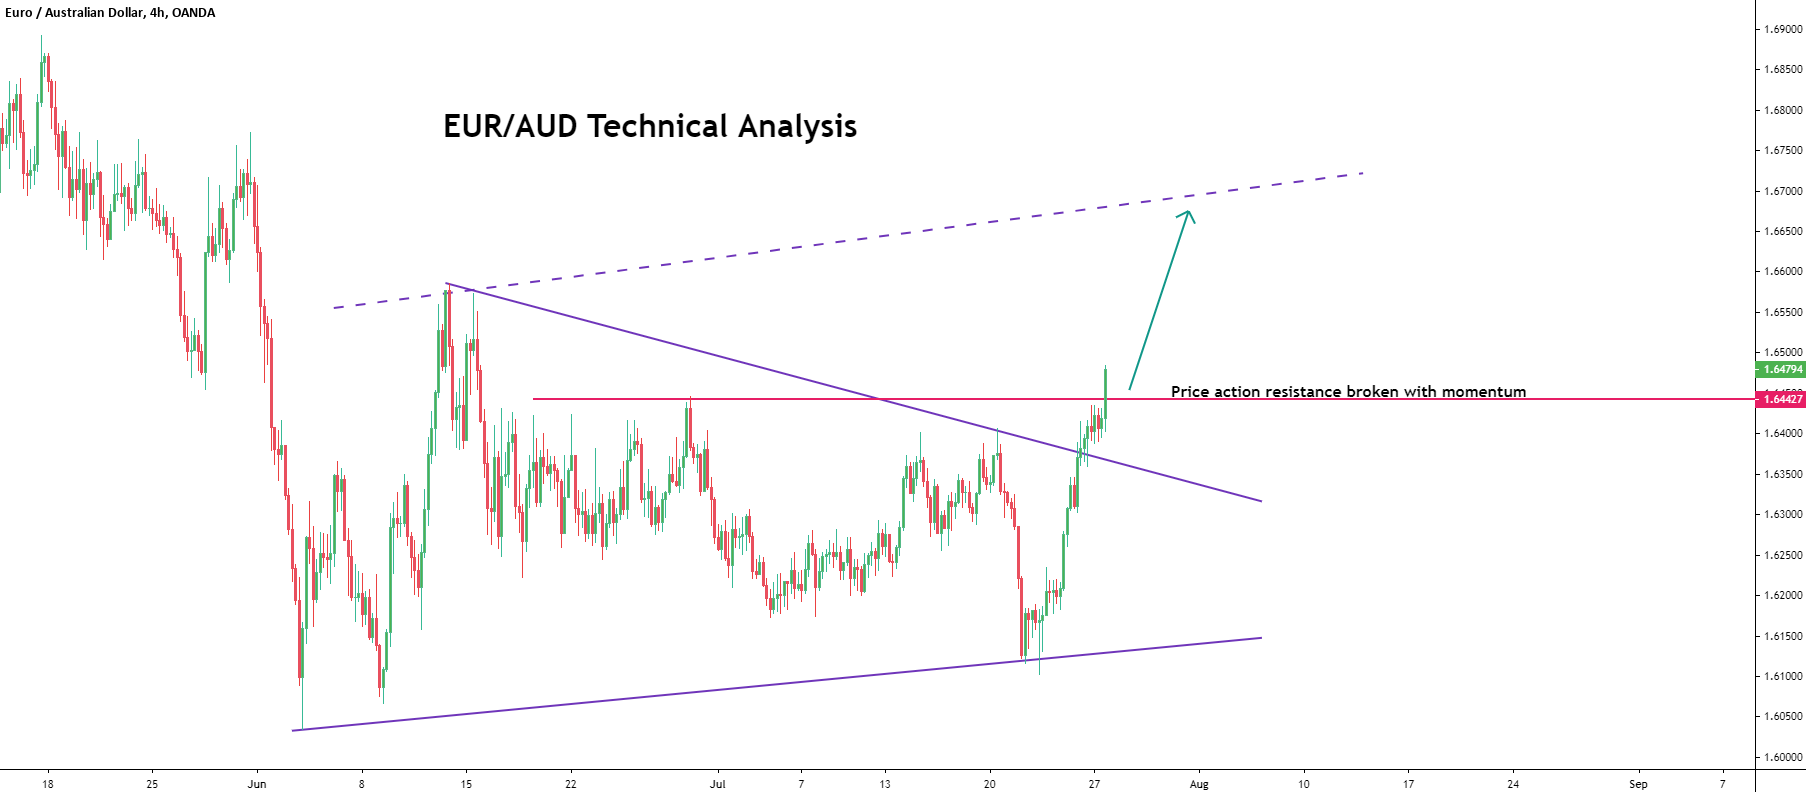
EUR/AUD Technical Analysis
~~ The counter has broken two strong resistances back to back.
~~ One- bearish trendline.
~~ Two- Price resistance at 1.64427.
~~ It is having strong momentum and hence we expect it to reach higher levels sooner.
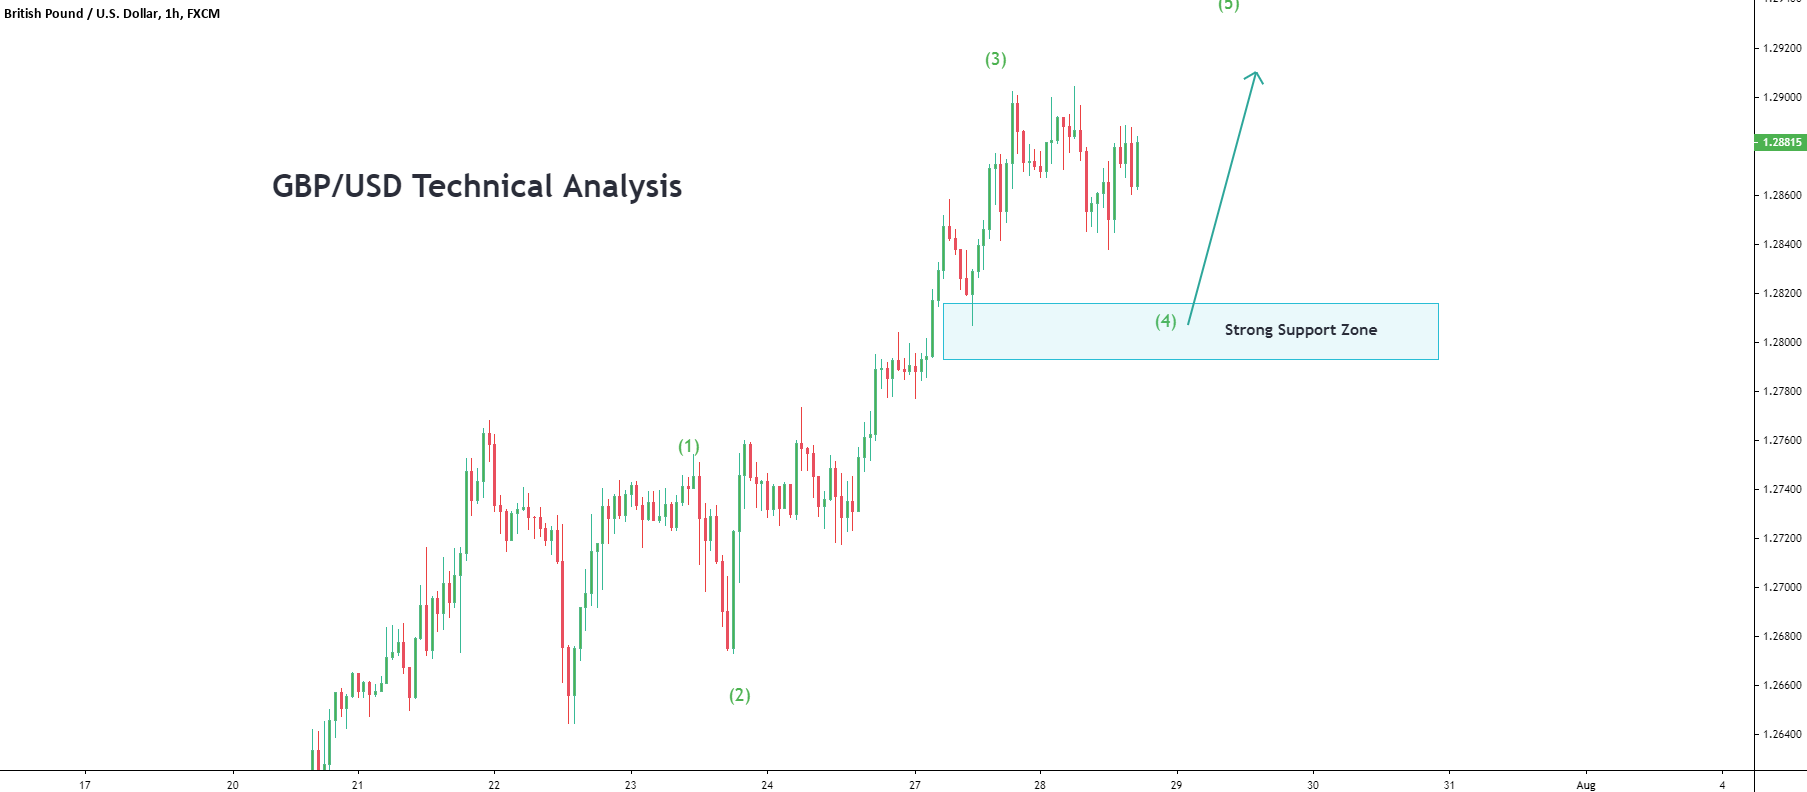
GBP/USD Wave Analysis
~~ The counter is currently in a short-term bull run.
~~ It is now consolidating within ranges to form wave 4.
~~ We expect the pair to move to the support zone (marked in the chart) and then head higher.
1 Like
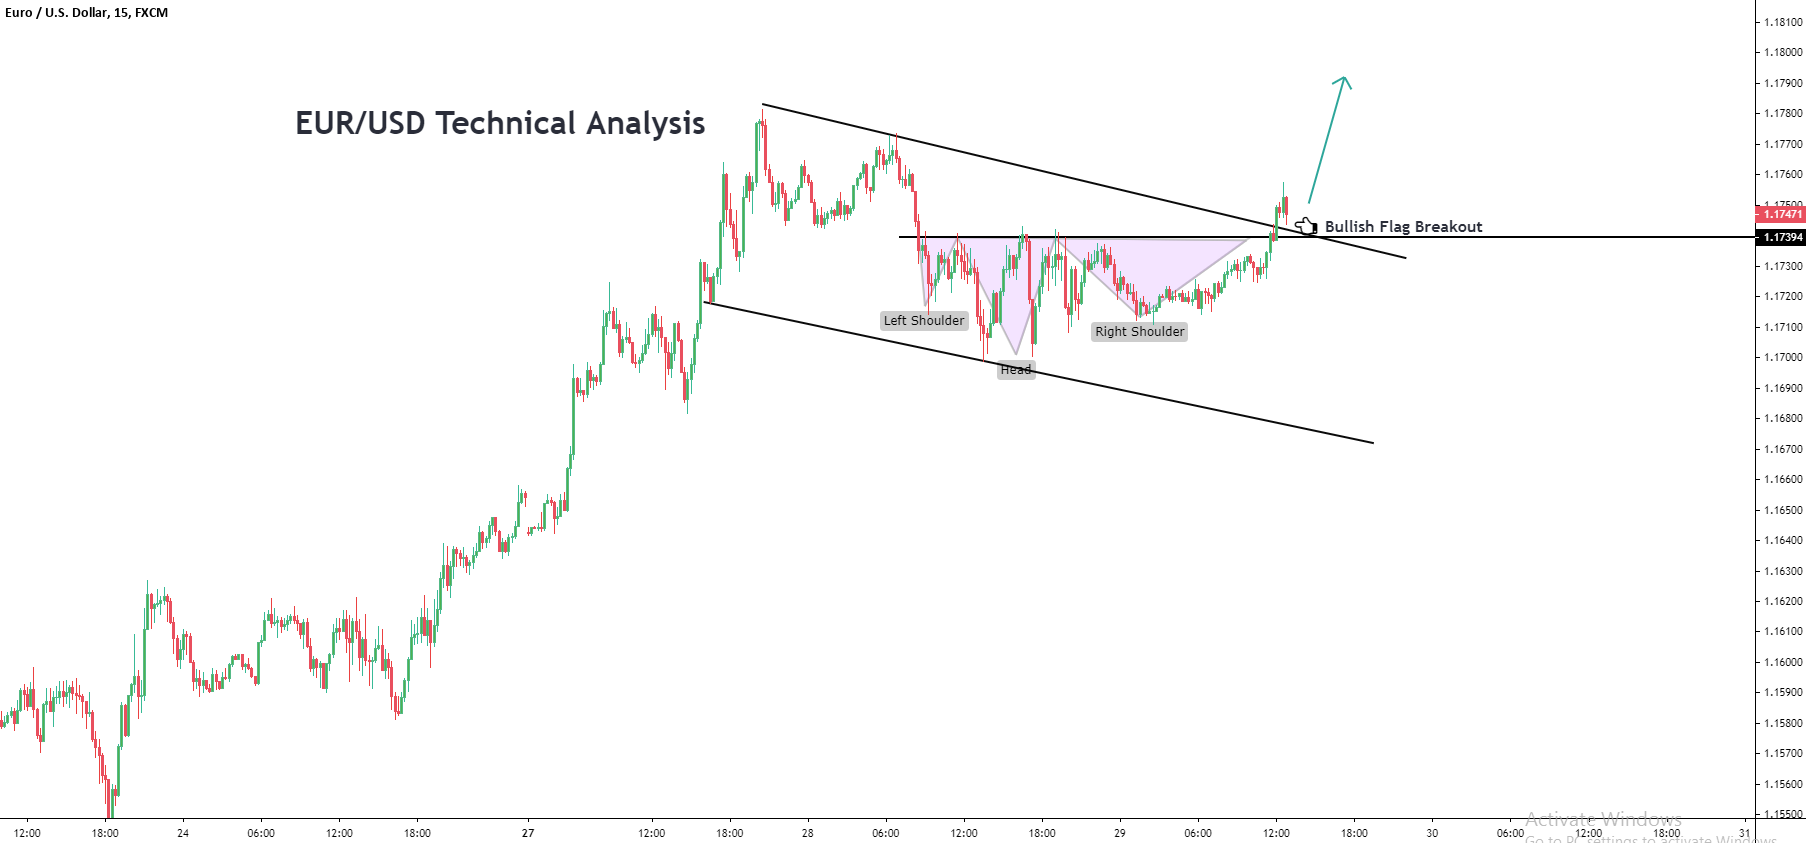
EUR/USD Technical Analysis
~~ The counter is in a strong bull trend.
~~ It consolidated for a brief period within a bullish flag and now has broken out.
~~ Further, it has formed an inverted head and shoulder pattern within the flag which indicates the absorption of selling pressure.
~~ Hence, we expect the counter to remain bullish in the short and near-term.
EUR/CHF Wave Analysis
~~ The counter has completed a bear cycle and is due for a correction.
~~ It formed an inverted head and shoulder pattern in the lower timeframes and has broken out.
~~ Hence, we expect the counter to be bullish in the near-term.

CAD/JPY Wave Analysis
~~ It has recovered from the low with a strong V-shaped rally, which is a sign of reversal.
~~ Further, the could interpret it as an ABC correction.
~~ Hence, we expect the pair to trade with bullish bias from here.

NZD/USD Technical Analysis
~~ The counter has broken down two critical supports.
~~ One- price action support level of 0.66128.
~~ Two- Bullish Trendline.
~~ It indicates the counter has changed its short-term to bearish and we advise traders to go short.

Looking like a double bottom now on the 2H! Will check this one again tomorrow! 
1 Like
USD/CHF Technical Analysis
~~ The counter is currently in sideways consolidation mode.
~~ It is currently in its lower end of the range and the short-term indicators show signs of oversold condition.
~~ Further, the wave interpretation deems a wave C move to the upper end of the range.
~~ Hence, we expect the pair to be bullish in the near-term.
