DXY H4 As of 8/2/2023 7:34 PM EST - BUSTED!!!

This still may reverse at the extreme supply zone (not marked)
DXY H4 As of 8/2/2023 7:34 PM EST - BUSTED!!!
This still may reverse at the extreme supply zone (not marked)
Note to self: a compound forecast of more than 2 moves is ridiculous.
Weird that the range setup on EURAUD, which I don’t normally analyze, played out more precisely than GBPUSD, EURUSD, and DXY. I knew if I got DXY wrong then EURUSD would be wrong as well.
While GBPUSD and EURUSD are positively correlated, GBPUSD was actually leading EURUSD between the two correlated pairs.
The Best Time To Pet A Tiger Is After It Has A Full Stomach.
The Best Time To Enter A Trade Is After The Institution’s Appetite Is Satisfied By Liquidity.
NAS100 H4 Potential Short Setup targeting 14,873.70
As of August 12, 2023 2:14 PM EST
BTCUSD H4 Potential Long targeting 30,727
As of August 12, 2023 2:32 PM EST
BTCUSD H4 As of August 17, 2023 7:36 PM EST - BUSTED!
If I have to get it wrong, I prefer getting it really wrong. No need to feed false hope that the analysis was kind of correct or something else happened. The experimental method used for this obviously didn’t work. The Feds probably didn’t help me out on this one either.
Could be. Crypto is a fickle instrument
CADJPY has formed a rising wedge that terminates at an unmitigated supply zone on the daily chart, expecting a bearish move, but could possibly run liquidity above the supply zone due to the old equal highs (double top) to the left.
I’ll re-evaluate once price reaches the demand zone below, could possibly bounce from or break through that zone, which is why that move is marked with a dashed arrow because I’m uncertain about this zone.
CADJPY Update - Busted
As I suspected might happen, liquidity taken above the EQHs. But the Projected High was reached. Just didn’t take the path to reach that price that I expected.
This is interesting…Price turned around at the Projected High.
Mission: Forecast the path with the same precision as the projections
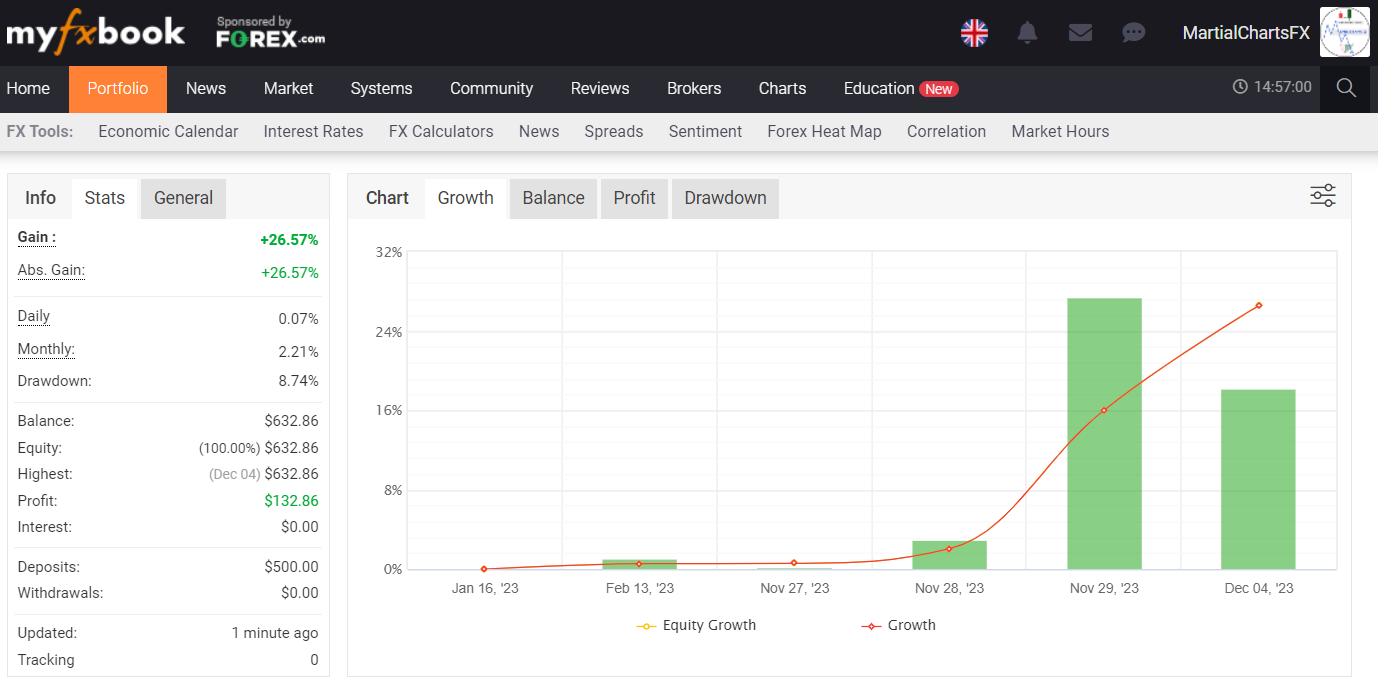
This week I re-started working on running up a small $500 account that I haven’t traded on since February 2023. In fact there has only been 1 trade on this account prior to this week. I had planned on doing this back then but my career demands got in the way of trading. Now that I’m all in on trading, I plan on making this account grow.
February 13, 2023: 1 win 0 loss
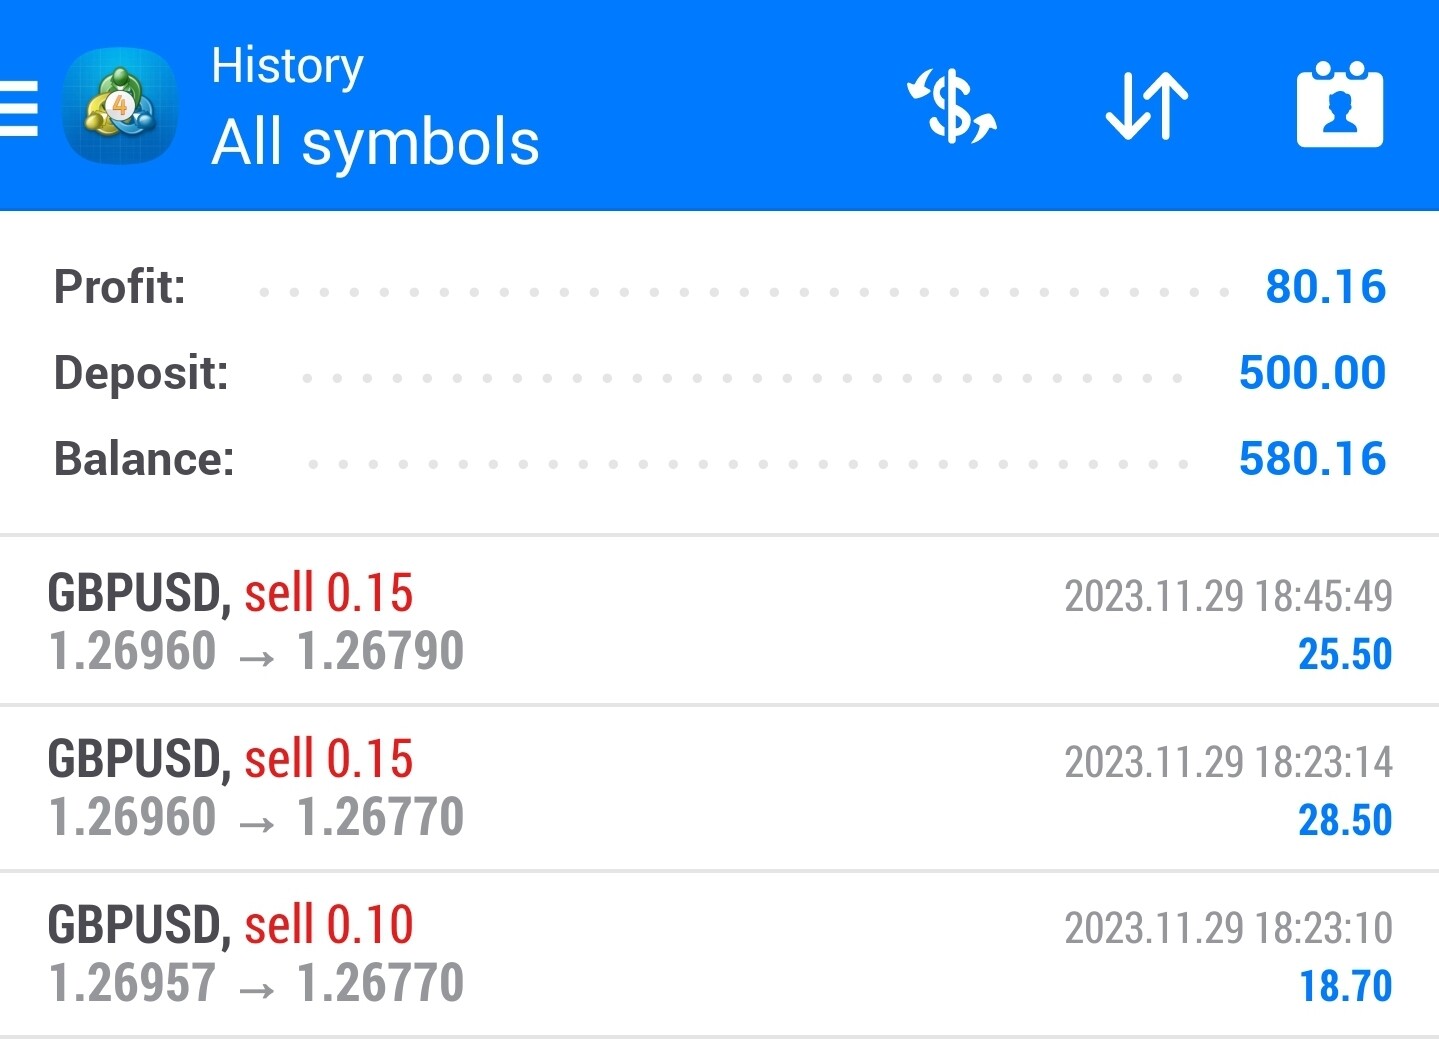
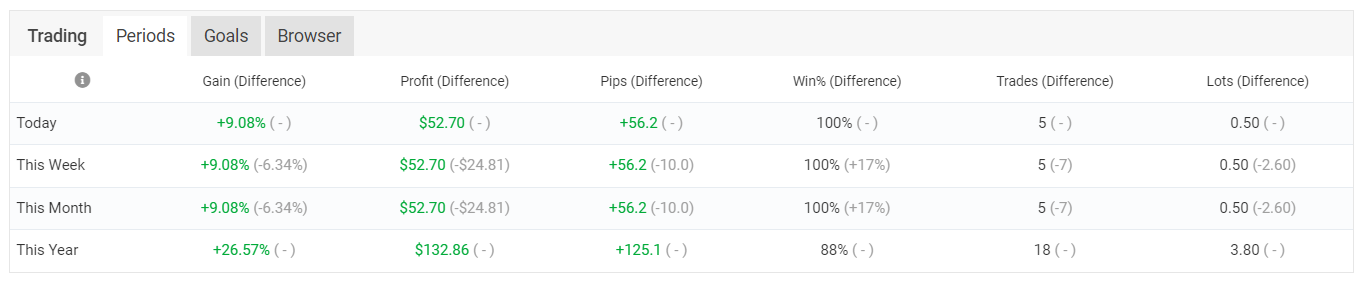
Monday 11/27/2023: 3 wins 1 loss
Tuesday 11/28/2023 : 4 wins 1 loss (I over-traded based on my plan and rules)
Wednesday 11/29/2023: 3 wins 0 losses
84.6% win rate on 13 total trades (12 this week). I expect the win rate to drop because I don’t believe this to be sustainable long term.
Some of these are the same setup with multiple entries, such as today’s trade.
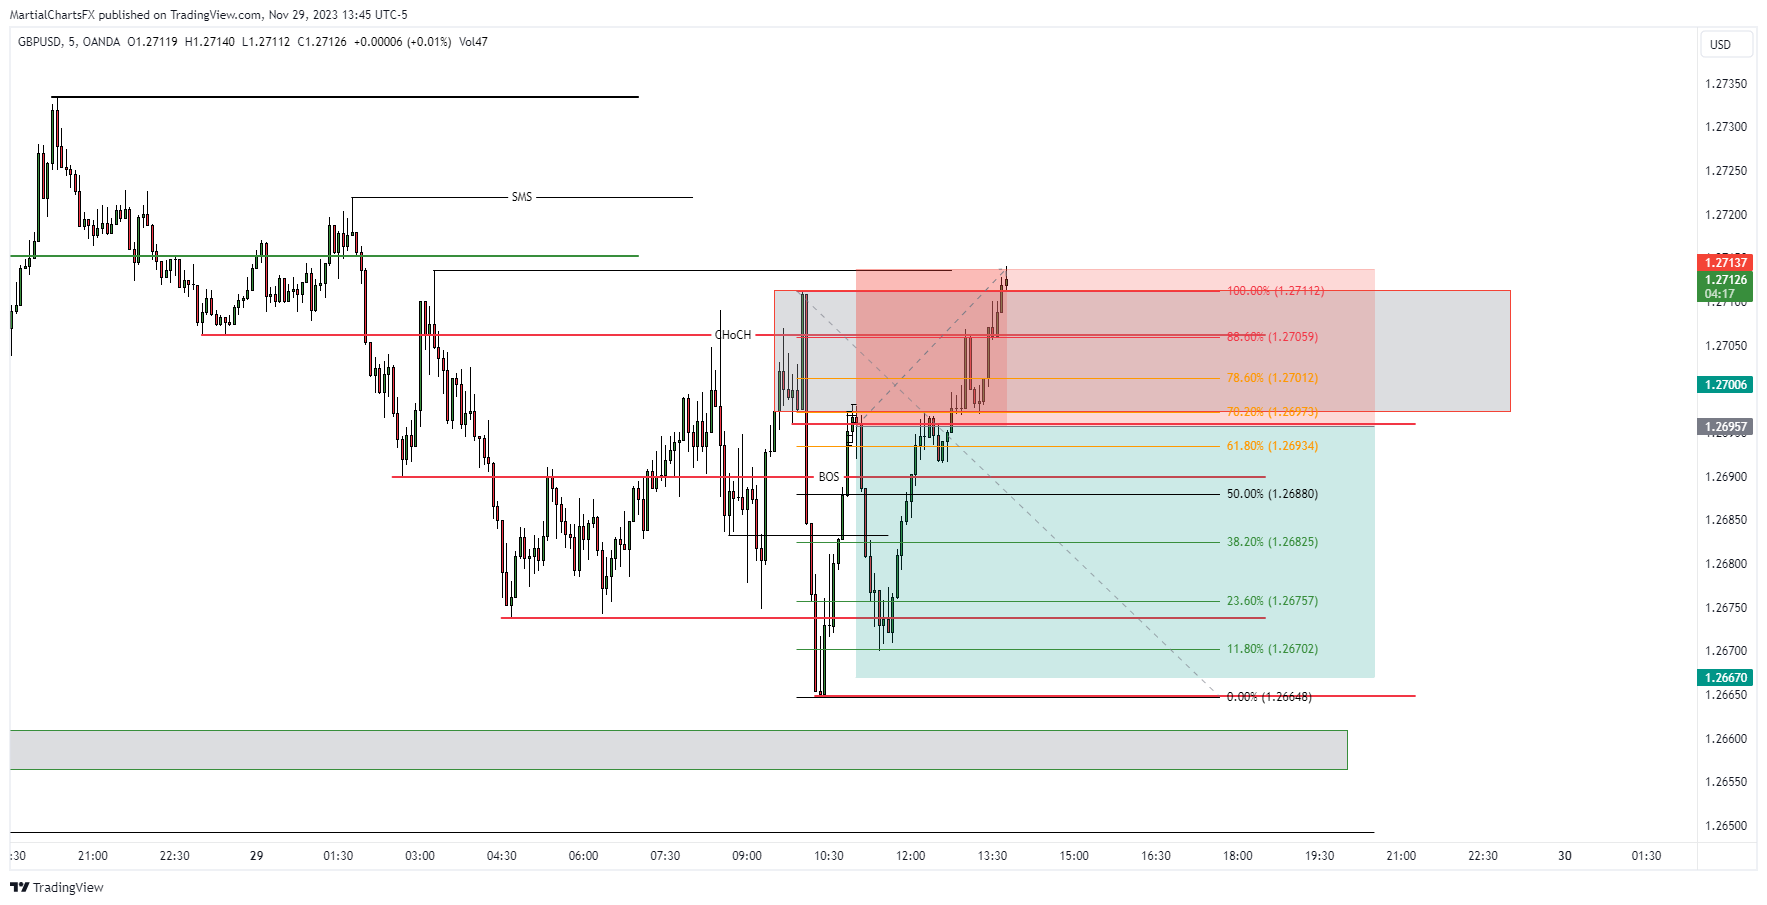
Today’s trade was a sell on GBPUSD based on a 5 Minute setup. I made my entry based on the 1 Min and 15 second charts, but I kept my stop SL based on 5 minute structure. I could have reduced the stop loss to 2 pips and been safe in this trade since there was virtually no drawdown on entry.
Manually closed 2 positions and left 1 to run. Normal TP would be at 11.8% but I was optimistic and the market crushed optimism so 11.8% was where it stopped before going back to entry. So the last open position was closed when price action showed signs of reversal on the 1 min and 15 second time frames on both GBPUSD and DXY.
How it ended today:
As I write this post, it looks like a second chance at this trade but the time of day is wrong being after 12 PM EST. This is where discipline plays a role in not taking the bait.
While I’m still typing this post, I get to see the hook in the bait. I’m glad that I remained disciplined and vigilant.
Trying to maintain proper risk management and self-discipline are the hardest parts of the process.
I don’t know how far I can run this account up. The last challenge account that I started on Hugo’s Way got deleted when they moved from MT4 to TickTrader, so I’m crossing my fingers that it doesn’t happen that way again.
February 2023:
Positions: 1
Wins: 1
Losses: 0
Pips: +2.7
P/L from : +$2.65
Balance: $502.65
November 27-29, 2023:
Positions: 12 (13 total)
Wins: 10 (11 total)
Losses: 2
Pips: +66.2 (68.9 total)
P/L: +$77.51 ($80.16 total)
Balance: $580.16
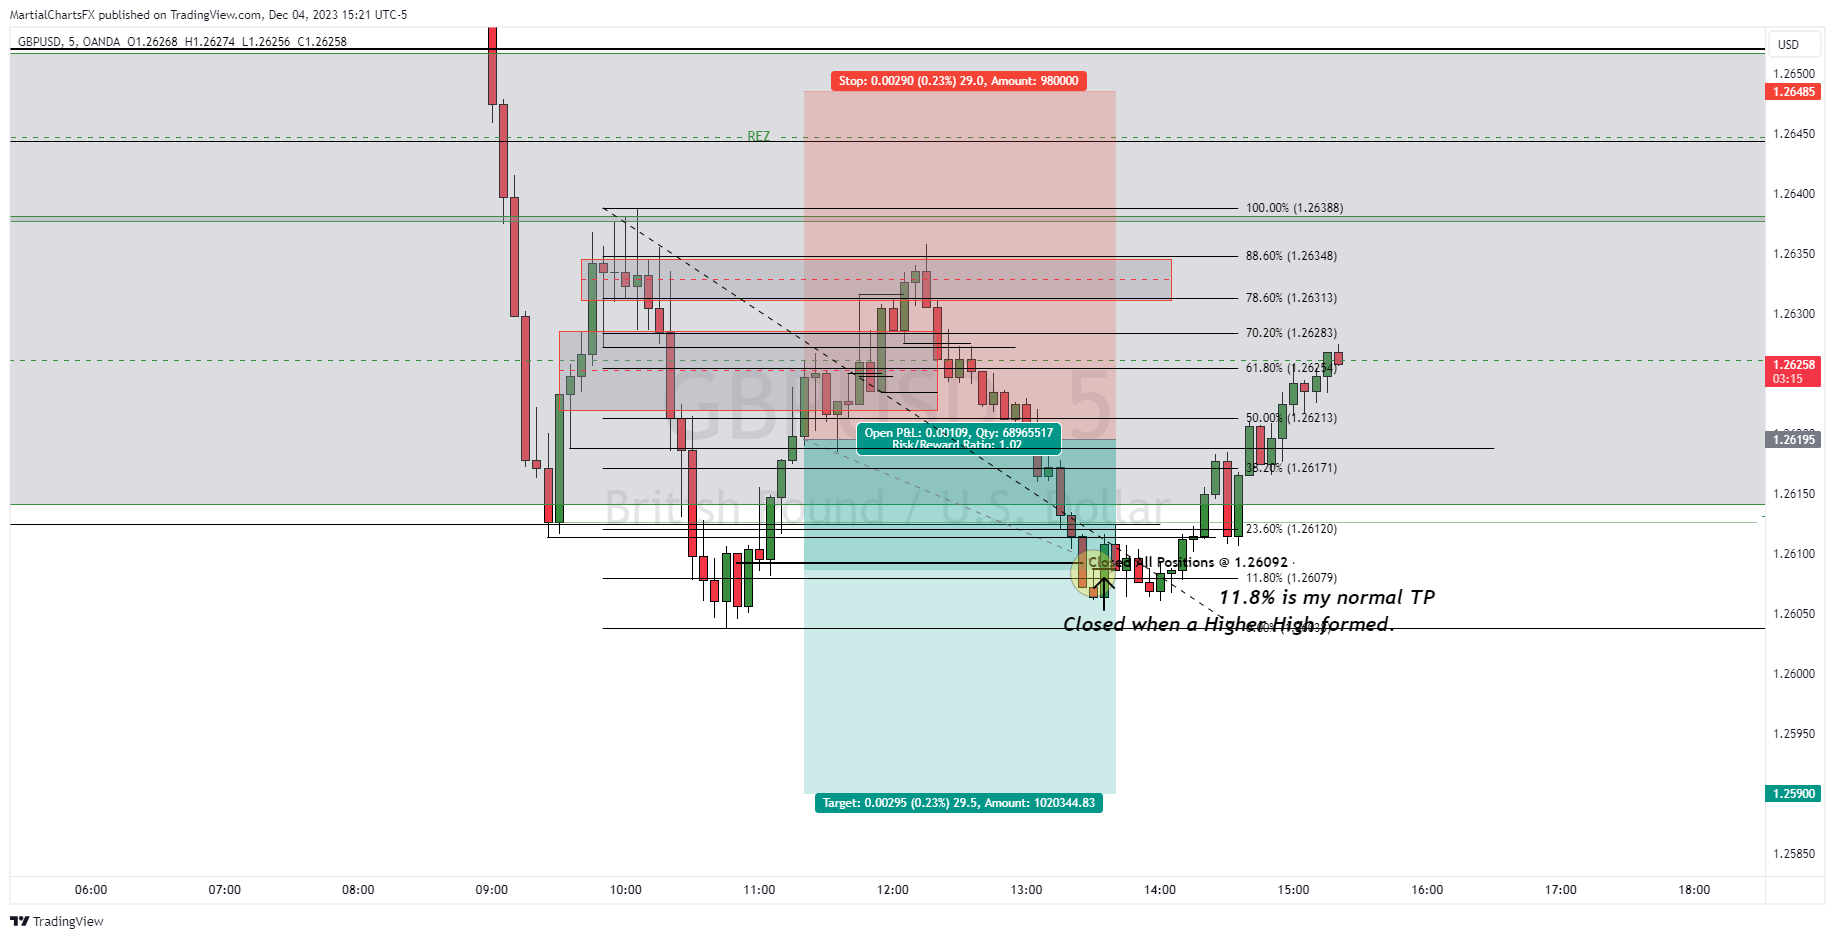
$500 Account Challenge Monday December 4, 2023.
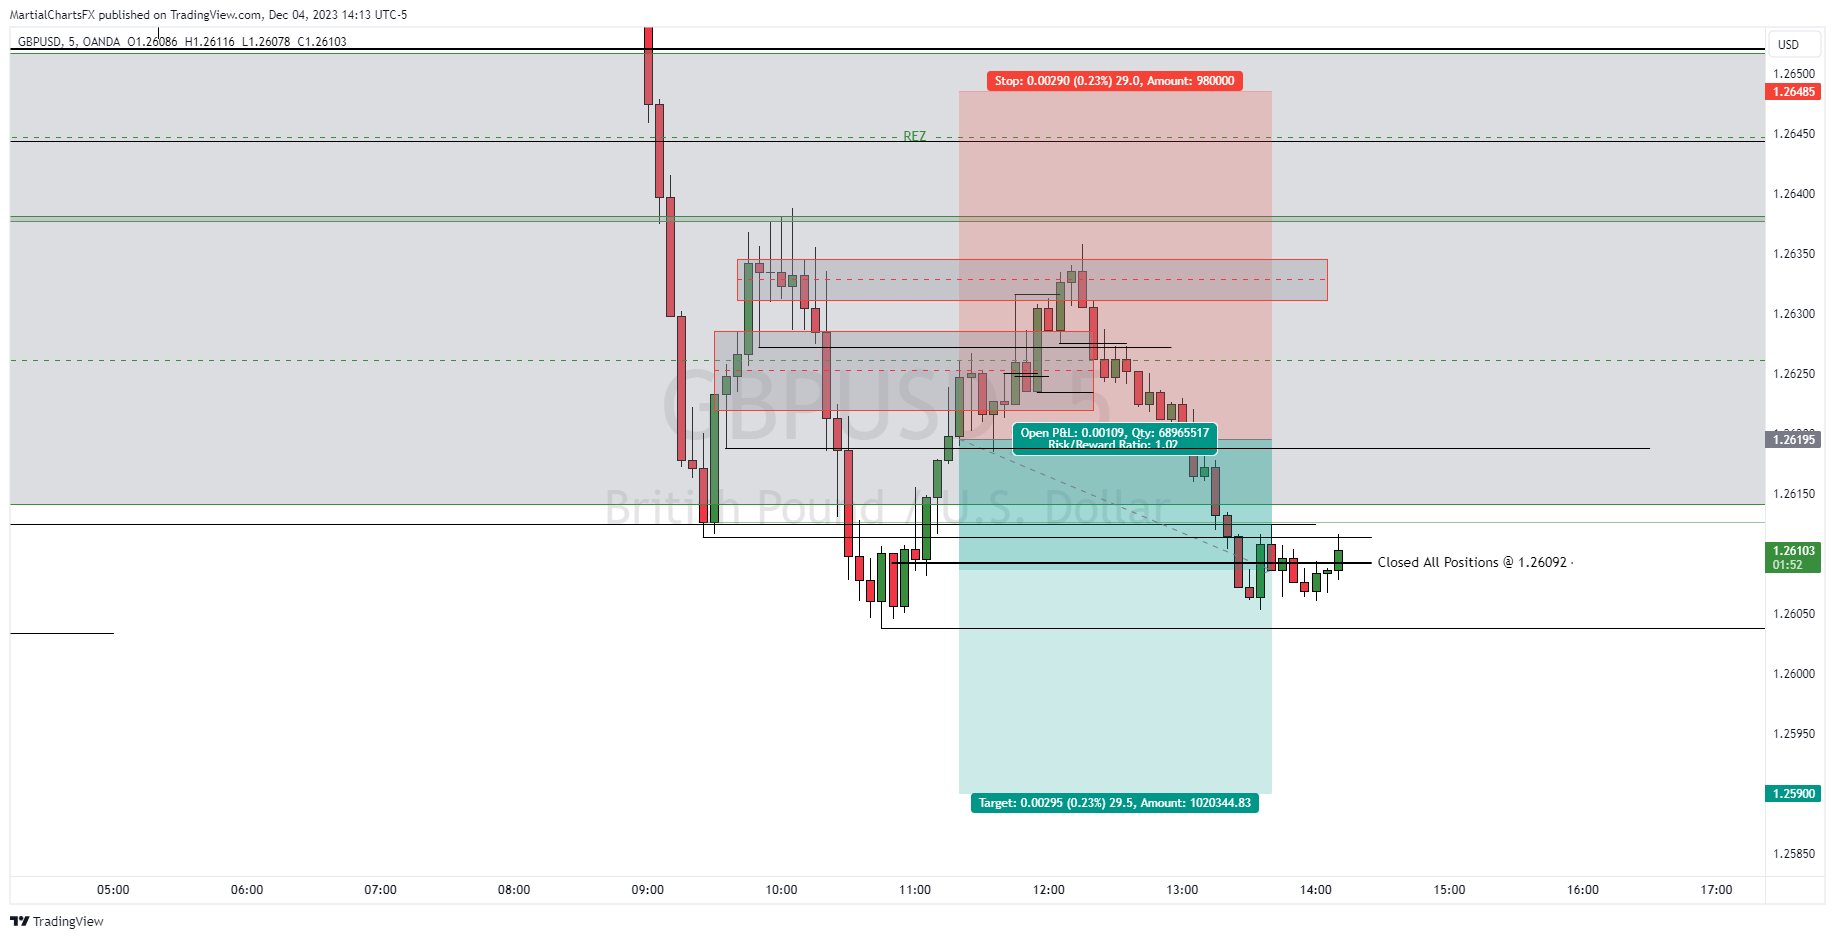
Results for Monday 12/04/2023. I opened 5 positions on GBPUSD for 5 wins.
I didn’t trade last Thursday or Friday due to preparations for a wedding that I was in this past weekend.
This setup on GBPUSD 5 Minute was a BOS + retracement to an area of value. The lower zone was the area of value that I used for my entry, however price liked the supply zone above (shown in the after image) for an even greater value for price to make the reversal.
Before
After
This was initially a 1:1 RR trade, but my stop loss was moved into profit once several important levels were broken to the downside.
My starting TP was aggressive beyond my normal TP. The aggressive TP was based on a resting liquidity that was below. I ended up closing when price started moving sideways and appeared to be in the starting phase of a CHoCH, which just happened to occur near my normal TP. I didn’t take any partial profits along the way, which I like to do, instead opted for moving all my SLs into profit.
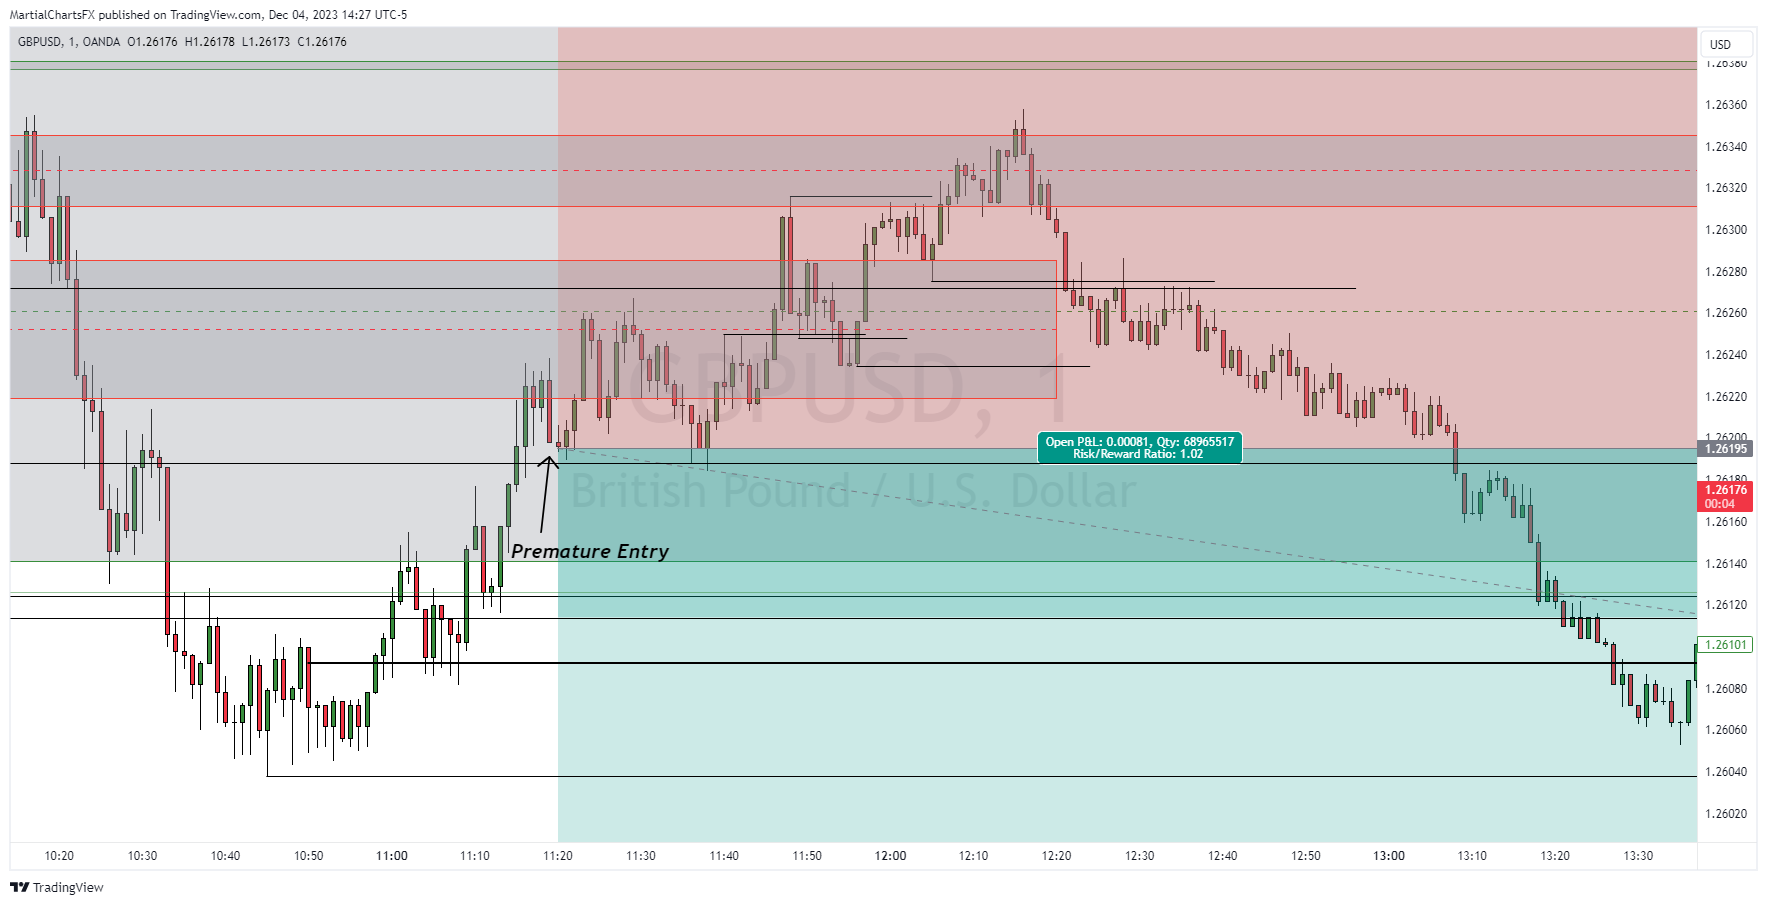
The entry was based on a substantial wick rejection at my zone and I entered on the close of that candle. On the 1 Minute timeframe the entry is at the close of bearish engulfing candle. I should have waited for a pin bar that close bearish not bullish. This would not qualify as a sniper entry unless you were in a water balloon fight. Unfortunately, I removed my Fib prior to entry. If I had it on the chart, I would have not entered below 50% as I did on this trade.
I wouldn’t call this a good trade and I made a ton of mistakes, but it was a profitable trade anyway.
The Bad:
The Good:
Positions taken: 5 (18 total)
Wins: 5 (16 total)
Losses: 0 (2 total)
Pips: +56.2 (125.1 total)
P/L: +$52.70 ($132.86 total)
Balance: $632.86
As I finish up this post while looking at the chart. I apparently I had a grenade entry and a sniper exit.