See what it did there? Look familiar?! Lol…
Really great risk management strategies ! Using Price action and testing S/R zones in the higher time frames is something I’ve seen the best traders do. And though technical indicators are helpful you realize they can be a distraction if you focus on them too much.Good stuff!!!
Thank you, Ruth-Ann.
Yes, risk management is the most important part of trading. As I’ve said before, it only takes one bad trade to blow your account, and if you lose your money, you can’t trade.
CHFJPY 4H - Is still in an uptrend since around May, but is now facing strong resistance at 116.38. It’s also forming an ascending triangle, which is considered a bullish, continuation pattern.
This could be a good breakout play.
You can see the uptrend on the weekly. If it breaks through that 116.38 R level then we could see 117.7 area.
AUDJPY Weekly Chart - I’m excited about this one. Look at that SR level, have you ever seen anything so beautiful? I will wait for confirmation, but I see money here.
Zoom in to the daily chart, it hasn’t been able to break through that area since support turned into resistance in May 2019.
Back to EURUSD 4H - I have a sell order ready if it falls much lower. But beware, US inflation and other news tomorrow so could see some volatility. If my order doesn’t trigger overnight, I will probably cancel it before NY opens.
And there it was, I hope you caught it…
This is definitely one to watch as it approaches a strong Resistance area that has held since the beginning of 2016.
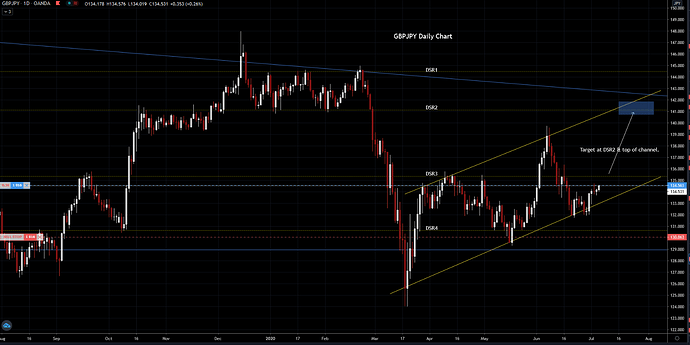
GBPJPY Daily - July 6th I posted my analysis for this setup here, and took the trade:
Let’s see where we’re at today:
I closed this trade long ago. I need to work on my patience.
GBPCHF 4H - Nice channel here:
However, looking at the daily chart, price is sitting in between 2 long-term SR levels:
Therefor, I will wait for confirmation on a breakout, or bounce off of that 4H channel’s support area. Breakout being the more likely scenario IMO.
USDJPY 4H - Rising wedge, usually a bearish pattern, but I don’t think it’s complete yet. If it is then it’ll likely just drop from here.
I’m testing a strategy primarily using the MA48 (8 day) as an entry point, on the 4H chart.
Entry rules are simple, place a buy order after the 4H candle closes above the MA48. SL a safe distance below the MA48, the channel or 4H/Daily support level.
Here’s an example of an earlier trade:
I’ve also added a MA240 (40 days) and MA480 (80 days) which shows a strong, long term trend when they’re all sloped in the same direction. For even more confluence, price is at the bottom of a rising channel.
CADJPY 4H - Pending order on a nice setup here. Price just bounced off the MA48 along with a significant support area, and the MA240 (green) & 480 (blue) are both sloping up.
Long term I’m looking at the 81.600 level.
yep, i m bull 2 on cadjpy, altho it might take a while.
UJ, also looking to short for now


