Hello there Graviton and the rest oy you, great thread :).
I dont know if this has been suggested, but would it be possible to record a demo trade ( or live ) of the 5 lot strategy? I mean, its clearly put on paper how to do it, i just thougt it would be good to have a visual reference? And ill add im a little unsure of the system! Would be great for new traders and everyone to have a video of it beeing implented? Just a thought what do you think?
And ya preferably recorded by Grav or someone with a full grasp of it :p:D!
Graviton, any chance you can take a look at the pair analysis I posted to see if I’m on the right track? Was I looking for the right things or way off?
1month- yes, strong very long term downtrend, 3000 pips down in the last year. Now THAT;s a trade!!
1W- this is the chart to draw the good down trend line. The more times the trend line is touched but not penetrated, the stronger it is. If penetrated it will act as a support line.
Daily- Agreed, good analysis
4H - Agreed, this chart is watch and see what the market tells us. A 4h entry can be worth lots of pips, but you always have lots to time to confirm these entries and optimize the actual entry point with lower TF’s. Retracements of 50% from such bullish candles are very common.
1h- Agreed. This would be a trade with the very long trend charts, but against the TF directly above. A good R/R trade, but probability of success is lowered by PA moving higher on the 4 hr chart. I think the caution expressed in your analysis of higher TF’s flows down to here. This might be more of a scalping type trade. Not the type I usually take. Trade at your discretion, protect capital.
I agree with your technical view on this pair.
Fun(damentls)- I agree with dailyfx, watch employment reports later this week. Best to be out of the market on this one during report and probably for 1hr after, more if volatility doesn’t settle after report. Note that the very long term trends, 1month and 1week, where the big pips are, are strongly driven by fundamentals. Even lower trends can be reversed by fundamental news. This is something you need to understand and follow to be world class.
Good analysis. It’s tons of fun to see these open up and move. Those that had warning signs and differing trends seem to move a bit random at first, those that seemed clear in analysis usually are more predictable. The more you do it, the easier it gets. Hang in there. Think of all the progress you’ve made in just the last week. This is a journey, not a race, but I can clearly see your progress toward finding your path. I’m sure you can see it too
Open Demo on IBFX for the MT4 strategy testing. Open Oanda Live for trading, there it wont matter what you trade since they use units. 10’000 = 1 pip =1 dollar but you can trade down to 1 unit. There are no micro mini regular medium big accounts. Just one does it all.
There charts are bad that’s why you need demo account. There spreads are good to excellent.
Will do. Thanks for participating. If you or someone could cherry pick a good 5 lot trade chart to show that would be helpful. Where is Nforex with his beautiful graphics when we need him?
Good. I gave you my best advice on moving up the ladder of progression. I know this is exciting for you. I remember opening my first live account. But if you miss a rung on the ladder, it can be more painful than you can imagine. The setback can cost months, years, or cause you to give up and just quit. Take your time and do this right. Best Wishes.
hello all,
Since my favorite pair has been taken , I would analyze
GBP/JPY
Monthly – downtrend line that has been run from middle of 2009 has been broken
PA right now close to the Middle Band
Weekly – I drew blue rectangle it looks to me as a resistant area
PA is flat and has passed through the MBB and bounced off resistant level 145.26
Is it the flag pattern ?
Daily – flat, slightly up. PA is in the squeeze
H4- PA has made the second lower high. There is a chance of possible reversal.
If the price bounces off the mid Band it would be a nice long trade.
H1 – can I say that there is long engulfing pattern (I don’t like last candle’s wick) and the mid Band towards down.
5M – there is extreme candle formed that has set PA to enter short but 1H engulfing pattern confusing me to enter short.
For me the trade direction for this pair is difficult to predict with such set up.
I would take the long trade because PA on H4 still is in sideway and above mid band(but I’ll wait for some extra confirmation)
If price will drop to the lower band I would look for cbl long entry
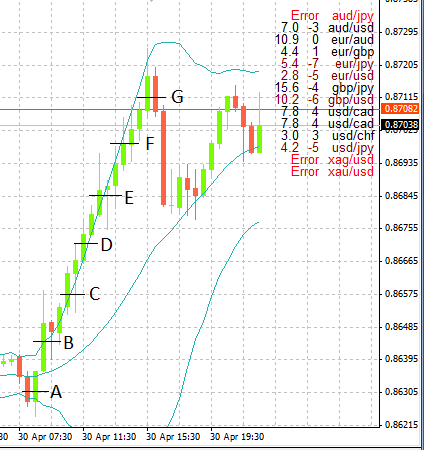
Ok, a cherry picked trade using the 5 lot system. I haven’t included any TS here for simplicities sake, but just refer back in the thread a little for guidance on those. I’ve still got guests so the picture is simpler than I would have otherwise liked. I know that the extreme candle rules are a little off whack here but I haven’t got time to find an exact entry, soz -
A - Enter from a squeeze going long. Using a 15:30 SL/TP.
B - Up 15 pips. Lot 1 is set to BE. Lot 2 is entered, SL at A.
C - Lot 1 is closed for 30 pips profit. Lot 2 is set to BE at level B. Lot 3 is entered with SL at B.
D - Lot 2 is closed for 30 pips profit. Lot 3 is set to BE at level C. Lot 4 is entered with SL at level C.
E - Lot 3 is closed for 30 pips profit. Lot 4 is set to BE at level D. Lot 5 is entered with SL at level D.
F - Lot 4 is closed with 30 pips profit. Lot 5 is set to BE at level E.
G - Lot 5 is closed for 30 pips profit.
Totals -
90 pips movement from entry to close.
5 x 30 pip trades, each worth 2% risk (15 pip = 1% SL risk)
Total profit = 5 x 2% = 10% gain
Total risk = 1 x 1% = 1%
*** Had trailing stops been included then this would have resulted in a potential of -
1 x 75 pips = 5 x 1% = 5%
1 x 60 pips = 4 x 1% = 4%
1 x 45 pips = 3 x 1% = 3%
2 x 30 pips = 2 x 2% = 4%
Total = 16% gain
This of course assumes none of the candles retraced slightly and knocked out any of the TS. Please someone double check this maths I’ve got distractions from guests in RL, heh. The TS info assumes that the price retraced right after getting to G. I know it goes a little higher in reality
I hope this helps someone, and that the info is correct.
This is very different than the way I understand it. My take on his system is that you only close out trade 1 at 30 pips profit. All the rest you stay in and let run…continually moving the stops. When the run is over you will exit on your exit signal or get stopped out. This way your risk is eliminated on the very first trade. Looking at the whole picture, your have no risk after trade #1 has been closed out.
Monthly - Agreed. The trend is still up as seen easiest by looking at the price change from the far left of the chart to the far right and the mid bb. But we are in consolidation, very choppy, very long position trades not recommended here. We can’t make the big pips in chop-chop. Consolidation can be before trend chance, or before continuation of trend. We have to let the market tell us which it is.
Weekly - Very slight downtrend here, but mostly ranging. I don’t trade ranges on very long term charts, but some do and do very well at it. I only trade good steady trends, but that’s just how I’m wired. If it is ranging, it should be near the bottom of it’s range and several weeks of uptrend should follow soon.
Daily - Yes, we are definitely bouncing off support and thus the bottom BB. A very bullish last candle. Price should penetrate the mid bb to confirm. This would be a difficult long term position trade to take as you would be past the mid bb by the time you get good confirmation,
4H- The 4H is also ranging. The big move will follow the breakout from the range. If it continues ranging, it is near the top of it’s range. Of course, all ranges end with a breakout, but I can’t tell if it’s now or not. Odds favor a test of the previous high around 8720
1H- Yes, pretty much the same as above and your analysis.
M30, M15- This is a time I would look to TF’s below to get more information. The lower TF’s have hit the top of their ranges and are coming back down.
This would be a very difficult pair to trade in either direction until a breakout occurs from the current consolidation. These ranges represent consolidation and indecision.
Fun(damentals)- here is the reason for all the indecision. Some sort of election is about to happen in Jolly Old England. After the election, look for the breakout. We might expect the range to be contained until the results are clear.
See at first how murky the analysis was? But as we progressed down to lower and lower TF’s the analysis became clearer. Then the Fundamentals filled in all the gaps, giving us a clear view of what’s happening with the price action. This is why fundamentals are a critical part of pair analysis. You don’t have to be an expert in British Politics, or even know who’s running for office. Just a few sentences easily found give you the complete picture.
As far as technical analysis, the fact that longer time frames yield some predictive insight into lower time frames is a statistical fact. It may be right 50% to 75% of the time. The fact that higher Time Frames are composed from lower Time Frames is a mathematical certainty. It is right 100% of the time. You need both plus fundamentals to get the complete picture. Once you have the complete picture, selecting trades that will win, or deciding not to trade a pair as in this case, is fairly easy. We can now even say when we will trade this pair. We’ll trade after the volatility settles down a bit right after the election.
If the picture is confusing, you haven’t studied the pair enough and any trade, no matter how good the entry system is just a guess. You would be just as well off, and perhaps better off, just to flip a coin to decide if you want to take the entry or not.
Well, I’ve been at it for 7 hours without a break now. Commenting on these analyses is like reading English student papers. It takes a lot longer to comment on them than to first write them. I see I have more coming in now.
Hmm, if I’ve got it wrong I apolagise, but I thought this is how it works. I prefer personally the idea of taking out the profits in set chunks as in the picture, but that just suits my trading style. Keeps me from second guessing the market.
Can’t see any reason why your way wouldn’t work too, but I don’t think I would do so well with it.
Yes, I will try to get to them all. This will be the last week I will be able to review these all line by line so what I do, I want to do well. I was a little rushed last week trying to get them all in before the open. Hopefully I can do better this time around. Next week, We’ll try to find a shortcut
I personally prefer a hard stop to a TS, at least at first. Please test for yourself though, as I’m still testing, plus others have far more experience trading than me.