Graviton, thanks for that review! It’s all really starting to make some sense now. So many great tidbits of info to assimilate, so it’s going to take a while. I definatley feel like I’m on the right track now though, thanks!
Cord
Graviton, thanks for that review! It’s all really starting to make some sense now. So many great tidbits of info to assimilate, so it’s going to take a while. I definatley feel like I’m on the right track now though, thanks!
Cord
Correct, there are two ways to go after 4 lots are on. Actually the first lot can be left to run as well. But taking off the profit in chunks suits me as well. Yet, as many haved pointed out, the thing that makes you feel best isn’t always the right thing in the business of trading. In fact, the opposite is more often the case.
I believe it can be proved that leaving the lots on to run has a better expected outcome since the % spread is smaller. So putting the lots on once, then trailing the stops until they stop out has the best expected outcome. Pulling the profits off in chunks feels so good, it must be wrong.
I personally run a regular sl and manually trail it. The problem is you may be tempted to not move it up and lose more when the stop out comes. If you have any problem with that, trail auto, if not, it doesn’t matter.
I will post a few charts to show what I have done with the CBL in my trading.
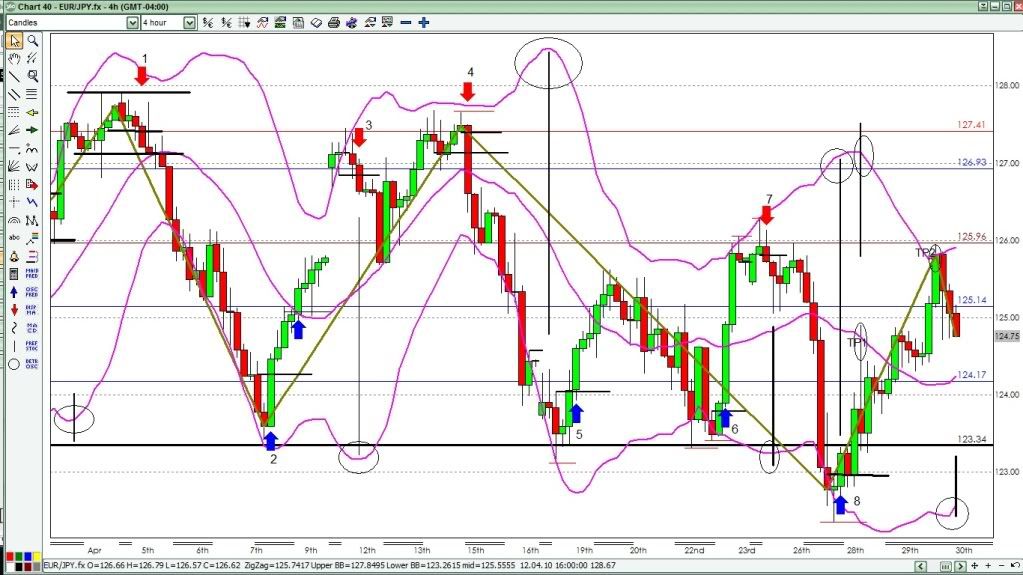
First here is my h4 chart showing overall view for April. I’ve have not cleaned it up so there are “lines” I’ve marked up and circles where I have looked for different items.
I listed 8 trades on here. All but the last one #8 were demo where I was trying to figure CBL out. I do not know that I have it figured out yet.
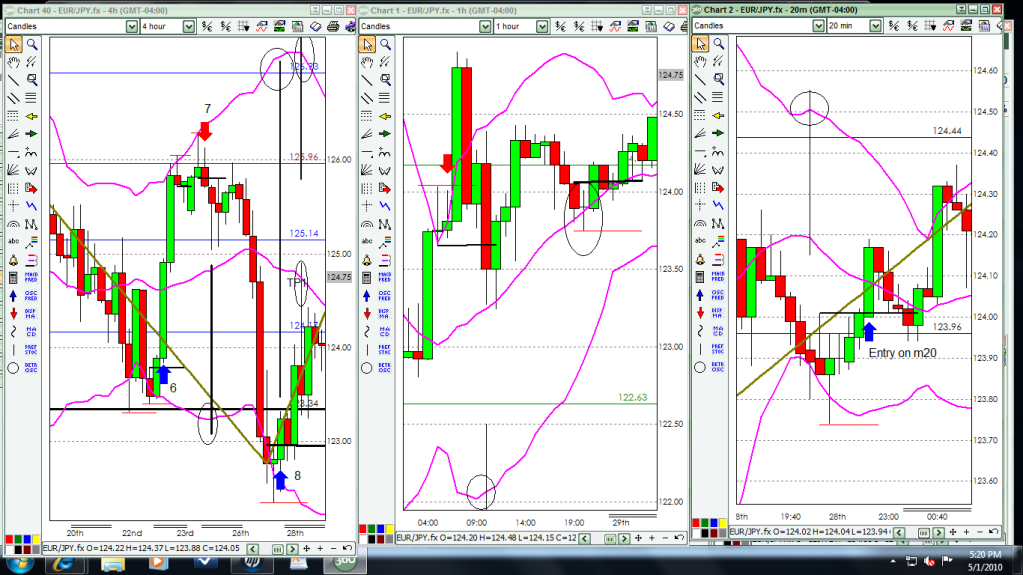
I follow my trades on the h4 chart but enter on the 20m or 30m or 1hr charts
(I’ll show these charts next)
I start by looking at the Daily and see what is happening there. Then I look at the h4 to see if PA is at upper/lower BB and/or S/R and/or Trendline
Graviton,
Thank you for the assessment. I benefit from this kind of feedback - both on my analysis and that of others. I know it is time-consuming. Please know that it is greatly appreciated.
Ditto that for me also. New name “Gracious Graviton”
BTW Xelnar I Love New Mexico:):)
OK, now onto my favorite pair - the GBPUSD!
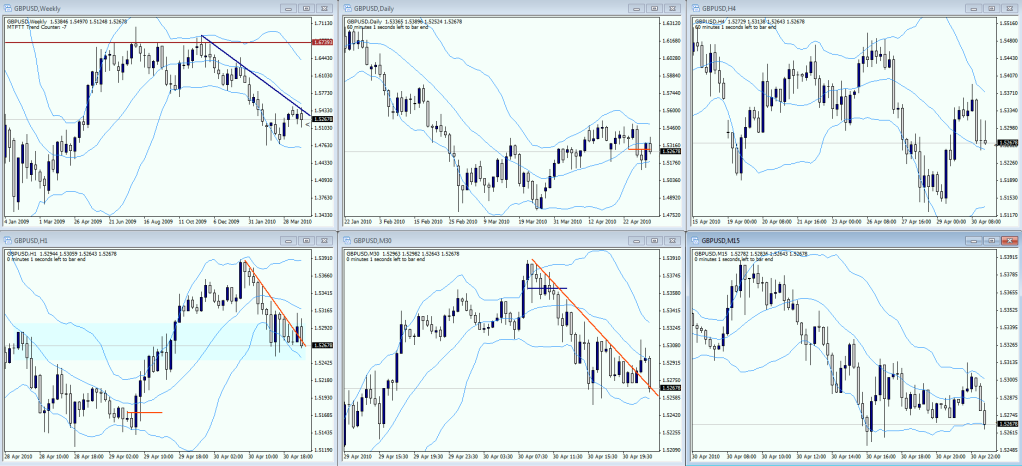
Monthly - After the 2008/08 break lower, which ended up in a huge bubble, PA made a retracement to the mid-BB, where it has found large resistance and is walking the mid-BB back down.
The previous month’s doji candle shows indecision, although, price is definetely in a downtrend and I have no reason to believe it will suddenly change direction.
Weekly - This chart shows the recent retracement of PA in more detail. The retracement caused a sausage and found a large deal of resistance in the 1.6740 region. It has since broken lower and is currently trending lower. The small retracement from the lower-bb to the mid-BB has made contact with the trendline and may present a selling opportunity - although it’s best to wait until after the election if we are to be making any long term investments.
Daily - This chart focusses on the small retracement towards the end of the weekly chart. It clearly shows that we are currently in a squeeze zone (notice the Tymen CBL entry on the lower-BB. There are no discernible trends in place.
4H - The mid-BB line is headed lower and price has gone all the way up to the upper-BB. If this had touched the band, this would have presented a very good shorting opportunity. With the bands contracting, PA is currently entering a squeeze zone - this may present some uncertainty in price in the week ahead. Although there is still momentum downwards, there exists a doji candle very close to the mid-BB, which could signal a change in direction - overall, there is uncertainty.
1H - PA has been in a sausage uptrend followed by the beginning of a downtrend.
PA is currently in an area of resistance/support, which has caused it to break the efficient down trendline. The Bollinger bands surrounding this latest move have not created a pattern of great conviction - which leaves us with uncertainty with where price will go next.
30M - This chart shows my thoughts about the 1H chart very well. The move downwards shows PA walking a sausage and an efficient trendline down very well. The contraction of the opposite-BB points to the end of the current move lower, which followed with the break of the trendline and onto the mid-BB. Price has now gone back lower to hit the trendline, which may act as support. One thing is for sure - if price fails to go lower, it will remain within a Bollinger squeeze and further clarity will be sought.
The upper bollinger band may present a shorting opportunity in the short term - but with 1H price within a no-trade zone, this may be asking too much.
15M - Price is currently in a squeeze and has been oscillating between the upper and lower Bollinger Bands. Tymen’s entries may provide good short term trades in this sideways market. The Monthly and Weekly charts show a bias to the downside but the closer timeframes- such as 30M and 1H - have not been very clear as to where price will go next. So any trades taken here will need to be taken with great caution.
Fundamentals - copied from dailyFX.
Fundamental Forecast for British Pound: Neutral
The British Pound may see an early boost from a final Greek bailout agreement but the currency looks decidedly vulnerable ahead of Thursday’s UK general election as traders fret about the future of fiscal policy amid uncertainty at the polls.
The third televised contest between the candidates to take up the post of UK prime minister after Thursday’s general election has come and gone, and while this final round was broadly given to the Conservatives’ David Cameron, the clear winner of the UK’s first experiment with such debate was clearly the Liberal Democrats’ Nick Clegg. The charismatic leader managed to pull his party out of the shadow of its larger competitors and make the election a true three-horse race, meaning the seemingly inevitable downfall of current Labour PM Gordon Brown will not translate into a Tory victory by default. Indeed, the Lib Dems are all but tied with the Conservatives in the latest opinion polls, hinting the election may produce the first hung parliament since 1974 as neither party is able to secure a clear majority.
On balance, this is an ominous prospect for the British Pound. Markets prefer a Conservative victory, hoping Mr Cameron and company will make good on their promise to aggressively tackle the UK’s soaring budget deficit. The Lib Dems have not inspired such confidence, offering precious little in the way of details on how they would proceed on the matter. In any case, they too can’t hope for an outright majority and the prospect of a divided government incapable of charting a clear course for fiscal policy may prove bad enough to send Sterling lower in the election’s aftermath.
Elsewhere, the economic calendar seems relatively uneventful but risk sentiment may prove to be a factor early in the week, giving the Pound a boost if EU policymakers announce a finalized and expanded Greek bailout as expected over the weekend. Indeed, 21-day percent-change correlation studies between GBPUSD and the MSCI World Stock Index return a value of 0.88, the highest in nearly three months.
My view: PA will probably be sideways over the next week due to the election.
Feedback is very welcome!
Once I see PA at/near the top/bottom of BB on the h4, I pull up my h4, h1,& m20 and start drawing my CBL’s. I draw them on each of the charts. On this trade I did not get the best entry. It occured around 12pm EST while I was at work. I got in at around 1045pm EST. Factors I looked at for this entry were morning star on the h4 at the bottom bb, the Doji on the h1 that formed on the mid-bb. At the same time on the m20 the opposite bb started to contract and PA started making higher lows. Drew CBL and when price moved above the round # of 124.00 I entered. As this pattern had occured several times in april I felt confident in the enty. Entered 2 units per Tymen’s method. Biggest draw down was about 8pips. TP1 on the h4 mid bb and TP2 on the h4 top bb. Once TP targets hit…start looking for the short. Since TP2 closed on Friday there was no follow up trade for me. TP2 was hit…but I dont think it is captured in the picture
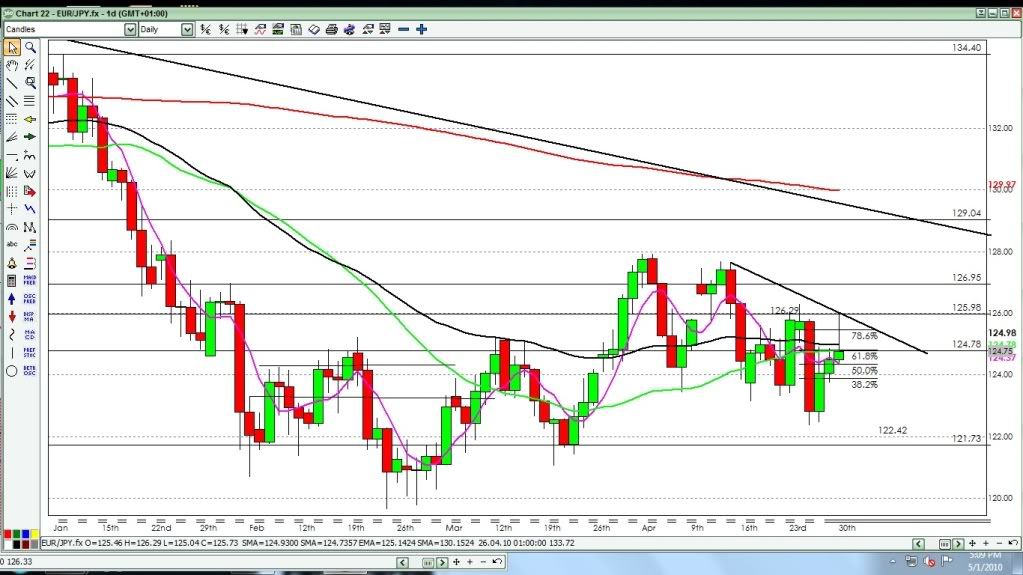
Monthly - Agreed, my only other comment is this is obviously a pair that has long extended trends. We are currently in a downtrend that started in Dec 2009 and is continuing.
Weekly - Yes, there is a down trendline that can be drawn down from Nov 29 touching again Jan 10 2010 and Mar 14 2010. Having touched three times, this is a strong trendline. It was broken with an upswing Apr 11 2010 and looks like we are sitting just above it now.
Daily - Agreed, here we can see that down trend line acting alternatively as support and Resistance. The bottom of the current bullish candle sits squarely on top of that down trendline. As you said, the overall trend is down and I don’t see evidence of a trend change, more like consolidation now.
4H - Yes, we are still seeing a pattern of lower highs and lower lows. It is always more likely that a trend will continue than reverse, since it continues on many candles, but only reverses on one or a very few. That means we should be waiting patiently for a short entry on this chart. To believe this is actually a reversal to an up trend, we would have to see the previous high of about 1.3415 broken
1H - Messy price action due to news. If you create a “Junk” chart with 100sma and 200sma drawn, you can see what other traders are looking at. Price, 100sma and 200sma are all gathering in the same area with price stalled right on top of the 200sma. This is a condition called “Three is a crowd”. Typically when this happens on the 1H chart, a major breakout and price run is coming. Though the last few candles were up, it’s questionable that this precedes a break up since higher level charts still are in downtrend. I would not trade this pair until price clearly moves past the 200sma on the upside, where there will be no trade on this chart, or moves clearly below the 100sma or below 3358, which should yield an entry on the 4H chart at anything below 3356.
Not only do we look at what’s happening, we ask ourselves, what is the most likely occurrence that will give us a trade? Then the market tells us if we have that trade or not. This is an interesting chart in that we can see a 4H trade developing on the 1H chart. We now know that an entry at anything below 3356 is a good entry on a HR chart likely to make big pips moving down with trend. If this entry doesn’t develop, we’ve risked nothing, no harm no foul.
The only problem with this trade is it will probably need a wider stop than I usually like to use, so I will want to watch 30M, 15M and maybe even 5M to optimize an entry for the minimum SL possible. Even still a sl of 30 pips will probably be needed due to news volatility. Still, an entry at 3254 yields a high probability trade down 120 pips for a 1 to 4 risk/reward and if the trade Moves in my direction, I can trail the stop to reduce risk to my capital and widen the stop giving the trade room to breath. I I should stop out due to news volatility, I would be willing to look for a better set=up and try this trade a second time. This is a trade that could make 150 -200 pips using the 5 lot system. To be clear, I am taking a 4H trade entry, not a 5M or 15M. I am only watching those Lower TF’s to optimize entry after a valid 4H entry signal has occurred, that is to sell short as price is dropping on these lower TFs.
Fun(damentals) - US job numbers and Greece and other PIIGS country’s news to make a very volatile week. Volatility is good, if you are on the right side of it and don’t get stopped out with random news spikes.
Excellent chart. Thanks so much.
Been working 12 Hours straight now. One of my daughters just brought a good home cooked meal to my desk. I’d advise everyone to have daughters. They take care of you when you are old. I’ll probably work another 4 or 5 hours today and then knock off early. I will do some more reviews tomorrow morning my time to try to finish up before market open. We’ll see.
I’ve noticed a great improvement in the quality of analysis from everyone. I know this is a little difficult in the begining, but the more you do it the easier it gets. Every day, I’m seeing people thinking more like traders and less like gamblers. This is hard work, but exciting. Thanks for everyone’s input.
Our risk is carefully controlled to be 15 pips per trade. I don’t know of any way to trade with less risk.
Thank you very much Graviton:D
Your efforts are very much appreciated. Thank you!
RenaLa, so glad to see you are hanging in there. How was your trading week? Are you having any problems? Have you tried the 5 lot system? Your analysis review is next
Monthly - Yes, a beautiful bubble, could go up near the top BB, a move of about 2900 pips. I know you would love that trade, as you only have to check on it once a week or so. Talk about set and forget! The trick is, of course, to get in with minimum risk. We will discuss that over the coming days
Weekly - Yes, I see the Resistance you speak of. I see no clear technical reason for it. I would expect a nice move up if and when price moves above the Resistance area.
Daily - Breakout of the squeeze could occur either way, but look at the big bear candles and the small bull candles. this usually shows downward pressure on price.
4H - Yes but notice the previous bear candle had a valid BB DNA entry short.
I’m looking at GPB USD and USD JPY for clues since buying both these pairs would be the same as buying the drama queen cross GPB JPY. Both are heading down and touching the BB mid band, so no help there. Sometimes that helps though. I wouldn’t go long here.
H1 - Yes, price pulled off the bottom bb, but no contraction of top bb, you can go all the way down to M1 and see the reason for that wick, large fall there during the last few candles. This seems a bit confused.
Fun(damentals)- You didn’t include! Here you go:
"The Pound has continues to trade sideways against most currencies as the upcoming political elections in the U.K. will have a major impact on how the future course of fiscal and monetary policy. Different opinions from the various political parties on how to tackle the country’s bulging budget deficit and maintain the current recovery has led to a great deal of uncertainty over the future course of action. "
Looks to me this pair is also being held hostage by the Brit politics. I’d wait for a breakout from the squeeze on the daily chart. which ever way it goes after that breakout, it should move many pips 
Graviton,
This is a bit off topic but, in the spirit of learning more about the significant variables - technical and fundamental - that a trader should pay attention to, I’d like your opinion on the importance of paying attention to the correlations between pairs.
For example, EURUSD and USDCHF are pretty consistently highly negatively correlated but the values (presumably correlation coefficients) given in tables available on MATAF.net vary widely even with this pair over time. For others, the variations are so large that sometimes they switch from negative to positive.
If there truly is that kind of variability - and I have no reason to doubt the tabular values - I wonder if, from a practical perspective, correlation coefficients are worth worrying about.
I’d like your opinion, when you get some time.
Thanks
You are most welcome Xelnar. I hope everyone is seeing the benefits of just a minimal bit of fundamental analysis to complete their picture of the forex market. I’m 80% technical and 20% fundamental, but the fundamental becomes ever more important in the higher TF’s.
I do appreciate everyone’s input into this exercise. There is one more pair analysis I hope to have reviewed early tomorrow. The progress some have made is remarkable. If you have any questions, please feel free to ask.
The goal of this exercise was to open everyone’s eyes to multi-time frame analysis. I doubt anyone who has participated will ever be content with just looking at one timeframe again. It’s folding in a couple sentences of fundamental analysis that often completes the picture though.
I think most of the issues I wanted to discuss are contained in this thread somewhere. As I said in the beginning, I am not the natural teacher that Tymen is, but I have a few talents. There are many different tools discussed here in this thread. This is just a small fraction of what’s available “out there”. But you only need a very small fraction, carefully applied, to be successful. I’d advise you to not plan on using everything since it can cause analysis paralysis. Find a few things that seem to work well for you and perfect them.
Once you have a winning system devised, change it in the future only by very small increments that have been well tested. Changes should be evolutionary rather than revolutionary. Finding that system perfectly tailored to your trading style is your own personal Holy Grail.
Hi Graviton, I glad to see you too as always
On Thursday as you know I got 115 pips.
First 65 pips are 30 pips on USD/JPY and rest on EUR/USD (4-5 trades for 6-12 pips)
It is not enough for your system to be work.
50 pips I made with AUD/USD. I was able to place only two lots.
Seems to me, that difficult part is to locate and somehow recognize that the trade will run at list 90 -150 pips to be able to add 5 lots to the trend.
And second is to keep the trade running. I would defiantly need your help to keep me in the trend and trade until the trend is over.
I didn’t trade on Friday. I just was testing the strength indicator.
I came to the conclusion, that if the strength equals to 9 there is time to look for the trend reversal.
Did you have a chance to install it, but you may don’t need it.
Fun(damentals)- You didn’t include!
I relied on you
I’d wait for a breakout from the squeeze on the daily chart. which ever way it goes after that breakout, it should move many pips
Can you please explain everything in the details how would you set that trade, when you can consider that the daily squeeze is broken, SL and so on
When is elections in the U.K.? I don’t want to miss such movement
How the British polistics related to yen, so you can say that this pair is being held hostage. How long the squeeze will be continuing I guess as result of pair is being held hostage? ah?
Graviton, I thank to God that he brought you to this forum, well, I (as well as many of us) thank to God that he brought me to this forum.
I thank to you that you are sharing your experience and providing to us with very valuable information and knowledge that you have accumulated for years.
ok, It is time to be serious
Personally, I look forward to continue to attend your thread
I don’t worry about them. I focus all my attention on protecting my capital and finding good long trends to trade. I know some have good results trading correlations, like in the cat and mouse system, but it’s not the style of my trading. It’s good to understand these things though even if you don’t trade them. It’s all part of a broad education in trading.