Multi-Time Frame Trend Trading

I believe it’s clear we have two ways to trade the 5 Lot system. One is the way I’ve traded it for many years, put lots on the bottom with a fixed SL risk, and pull trades off the top with twice that number in profit. I’ve had very good results with trading it that way. It’s rare that you will actually get to trade more than 5 lots, so you usually only pay spread once. In the rare event that you take many lots off the top and are putting many more back on the bottom, yes, you would be paying spread again, but at that point you’ve made so many pips, a few in spread doesn’t seem such a bother.

Still, the math wizards among us have pointed out that the best expected return is actually gained by putting all 5 lots on only once in the careful sequence we described so no more than one stop loss is ever at risk, and in the rare event of a very long trend, letting them run to the end of the trend rather than pulling lots off the top with 2X stop loss profits and putting new lots on the bottom. This is because spread is only paid once for the 5 lots max, and overall then the spread is a smaller % of profits than if it had to be paid 6 or 7 times.

Either way will make lots of pips on a good trend. Note that on either method you don’t have to get to all 5 lots to make a good profit, once you have the first 3 on you have no risk and if you are trailing your stops, anything above that is locked in profit. As to whether you pull the 1st lot off for a guaranteed profit of 30 pips when it hits it as I do, or let it ride with trailed stop thus only locking in 15 pips of profit makes no difference in expected value if the trend is equally likely to continue or end. It’s only in the rare event of actually being fortunate enough to have a trade travel more than 5 lots’ stop losses in length that you would have to replace one that you pulled off in profit and thus pay an additional spread.

So either way works very well to minimize your risk and multiply your R/R ratio. Just pick one and stay with it throughout the trade. No fair changing in the middle of a trade. The other reason to trade with a proved positioning system is once you are in a trade all decisions are automatic, so you can’t mess it up with bad decisions.

As I’ve said before, once I have money at risk, my I.Q. drops to about 10% normal value and all decisions are suspect and more likely to be wrong. Thus with a positioning system, all decisions are automatic once I’m in a trade and I can’t mess it up.

Tymen’s 2 lot positioning system depends on making many small profits to make up for a single occasional stopout and still pull a profit. It works better on counter trend trades than mine because the duration of those trades is expected to be shorter.

My system accepts more initial stopouts, though limited in size, to make a much larger profit in the end. It works better if the trend lasts longer. That’s the reason I work so darned hard to identify situations that will have long trends. If I’m wrong, I lose 15 or 20 pips, and if I’m right, I’ll often make 100 to 150 pips. I should note that as those trades progress I do allow my stops to slowly widen a bit.

I’ve been testing using Tymen’s 2 lot system on counter trend trades and my 5 lot system on trades with trend and have had very good results. I get more trades that way, since I usually don’t trade counter trend, and if I stick to higher TF’s I make more pips with a very good W/L ratio. These are the things you will have to test and implement for yourselves. I can give you some tools to start working with, but you’ll have to put the finishing touches on your own personal Holy Grail.
Hi guys, and especially Graviton. I have some thoughts that I would love to have you experienced traders mull over with me…

I was laying in the bath last night, thinking. What was specifically going around and around in my head was the thought that, somehow, there were potential additional pips to be made with this system that I could catch.

Those long trends where 5 lots can be added, there is no reason not to keep adding lots for as long as the trend continues. Obviously, the trend needs to be a long one without retracements. This would work particularly well with the concept of using a trailing or manually moved stoploss for all the lots currently included in the move.

Also, looking back through the charts, there are several occasions where continually adding more and more lots would successfully catch more and more pips. Of course, the best bit is that no matter how many lots are added, the initial and whole risk is only ever 1% of your account capital…

This leads me to the second thought that came to me. Catching larger TF trends yields more pips. Not very insightful I know, but hear me out. What bugged me though was that for every increase in TF, so must the stoploss also be increased in order to avoid being caught in the general volatility of that time frame. A stoploss of 15 pips for the M15 is fine, but for a daily?? You would forever be stopped out!

Still, Graviton hinted at the potential to start catching these longer TF trends before. What I think is possible is catching the real highs/lows of these moves…

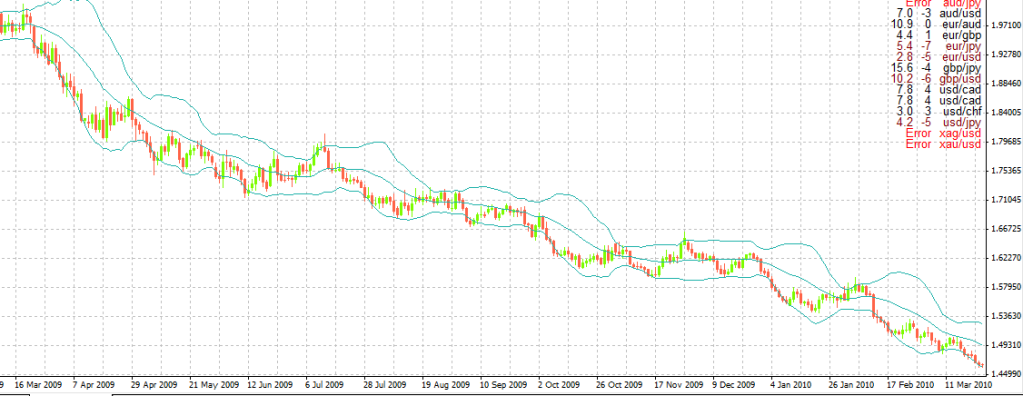
Take a look at the EURAUD from the 18th March 2009 until current. There has been a steady downtrend, consisting of a massive 5700 pip move! Catching that would sure have been sweet!

But because of the size of the stop you would have had to have applied, the rewards would have been only moderately amazing. Applied to the fact that you’re trading a daily (so long, long times with trades active) and the intraday trades are just so much more worthwhile.

But what if you could have traded this with every 15 pips worth 1% of your account? Suddenly, every single lot you enter is worth 5700/15 = 380%. That’s per lot. If you were entering a new lot with every 15 pip move of the market in your direction, then you would have got a rather large number of lots in before finally closing all your trades… Just 10 lots is near enough 3700%! That’s not bad for one years trading, and of course, you could keep adding lots for as long as you wanted to…

So, how do I figure you can do this?

Well, as we are studying all the TF as part of our daily routine, we keep an eye out for a potential extreme candle on each and every TF. If we had been looking on the 18th March, 2009, then we would have seen a piercing of the upper BB during a squeeze, triggering a potential long coming up in the near future on the daily chart.

From this point, we would look to the TF lower, and see if that was reflecting the same.

Was there an extreme candle forming?

After all, the BB are essentially showing us areas of support/resistance, so if the daily is showing the start of a potential trend, then the lower TF would show the start of that trend but in more detail. We keep working down the TF until we get to one that allows us to use the smallest sized stops, without the information just being noise (M30 or maybe M15). If we get an entry here, then we treat it just like a normal CBL entry. We use the same MM rules Graviton has outlined for us, and treat the start of the trade just like any normal DNA trade. We add lots at 15 pips just like normal too until we start increasing our SL…

Instead of increasing the stops at every 15 pips, we look up to the TF above our home chart. Does this chart correlate with the direction we think the market is going? If so, this becomes our home chart for setting stops. The lots keep getting added at 15 pip intervals as we scale in to the market, but we move stops at a pace that will let us catch the trend, but stop us being stopped out by insignificant noise.

And we keep working our way up through the timeframes as the size of our position increases, moving up the size of our stops as we go, until we get back to the daily chart. We never allow a stop to move past our initial entry, so our initial risk or running risk never, ever exceeds that first 1% we allowed ourselves. This will need some careful tuning at first, but I think it is doable.

Once we finally get to the daily chart being our home chart, then we will have a fair few lots being traded, each using a stop gauged by the daily, but where each has a value of 15 pips = 1%.

The idea is to only trade like this where there is a chance of catching a long trend on a higher TF chart. This could be the daily, the H4 or the H1 if you normally trade on lower TF charts, and at all other times we would trade just as normal – keeping our SL at the normal places.

This is purely to try and catch those real big trends when they present themselves, without having to have such big SL that the move isn’t worth more than 10-15% of your account, and so not worth doing over a long time frame. Where there are no possible longer TF trends to catch, then we just use normal rules.

What I don’t know how to do is exit these types of trades. Getting in to the larger TF you’re really getting into major fundamental territory. If anyone has any ideas how to effect a good exit strat to this I would love to hear it. One option is to exit if the price reverses and hit’s the opposite BB. Others are to use candlestick patterns. All ideas greatly appreciated.

This is just a quick idea, so it needs ironing out. It may not even work! But the possibilities of catching a trend like in the picture above, where we could get upwards of 100 lots in quite easily, meaning something like a 30’000% catch (that’s a guestimate), are very tempting indeed. :smiley:

I hope I’ve explained this idea in a way that makes at least a little sense. It did in my head, but then that never really counts for anything. :slight_smile:

Please throw me all input, questions or thoughts…

If it’s a rubbish idea, then I’m very happy to take criticism, but please explain why when you do.

Cheers guys!

Cord

I forgot to say -

As the idea is not to risk losing more than half your profit made, then so as you add a new lot when the SL has increased, so must you make sure that should the price suddenly reverse, so the risk to your profits is never more than half.

That’s how you gauge when to add new lots in the short period where increasing Sl sizes could jeopardise that rule. After a while, you can start heading back down towards every 15 pips as you get more and more profit in the bank.

I need to do graphics really for the best demonstration of the idea, but can do those if anyone thinks it’s worth pursuing at all.

I love it when a plan comes together :slight_smile: I’ve been hinting at the possibility of “walking up time frames” and trading higher time frames for more pips since I started posting to this forum. The point is, you don’t have to risk 300 pips to trade the daily chart. And even if you fail to make it to the daily chart, which you will about 95 % of the time or about 19 out of 20 attempts, you can still make some very good pips along the way. This is the most advanced portion of my trading. It yields trades with risk rewards of up to 1 for 100. Yes, this can be done. I get a few of those every year and many more with slightly less R/R ratios.

I didn’t want to go into this until I had everyone up to speed on the basic stuff, but now that you have independently discovered it, we can start moving in that direction. I make a good living at this every day. It’s all automatic, so I can’t mess it up along the way. Once you enter the first lot for only a 15 pip risk, the game is on. It’s always on. There are some rules, the first being, NEVER convert a bad short term trade into a long term trade. The second, you’ve already learned, once risk is removed from your trade, NEVER re-introduce it. That way leads to disaster. Feel free to explore this world of big pips. It’s not off topic at all and is right where we have been heading all along. I do need to make sure the rest of our group all have the basic stuff down cold, but I am prepared to answer questions on the advanced trading as they come up. This is very cool stuff. Kudos to you for being the first to see, or at least post on, the big picture.

Welcome to my world of big pips :cool:

Haha, it’s an exciting place to be. Can’t thank you enough for getting us here, and dropping enough hints that I finally caught on!

Looking forward to hearing how you manage these trades, as it’s definitely something I want to do right.

Cheers Dude! :smiley:

Cord

RenaLa, Thanks for all the kind words.

These are GREAT beginning results! I intend to address each of your issues, one at a time, and work it until it is completely resolved. I invite anyone else who has already addressed these issues in their own trading to contribute solutions as we go along.

I promissed to make you a world class trader or die trying. I won’t quit if you don’t. Let our journey continue…

Now you can see why after 22 years of this stuff, I’m so excited I wake up at 4:30 AM my time and just have to get up to see what the London open was. Yes, it’s a great world to live in. Let the journey continue…

Hey Cordite. Way to go. I’ll start taking baths now instead of showers. Maybe genius ideas will pop into my head:)

Graviton, In going through my pair analysis I noticed that EUR/CHF just hit a 15 year low:eek: Would that not be worthy of serious long consideration this week even though all trends are down?

Graviton, I completely here, let our journey continue… :slight_smile:

[B]RenaLa, now we will take each of your trading issues and work them one by one until they are completely resolved:[/B]

[B]Please let me know if you have any other specific questions or problems. I’m sure many others had some of the same questions, but were too shy to ask. I’m sure this helps them as well.
Don’t give up. Never, ever give up.[/B]

Good job! Don’t you love it when you start to SEE trades. If the market moves according to your vision, you trade it within your rules, if it doesn’t you move on, no harm no foul.

Now tell me, what has to change to give you a valid entry into this flood of pips?

Let me ask that followers of this thread continue to post charts marked up of your trades. This is very helpful to newer traders that are trying to understand what is going on here. Also, if you know the answer to a question, please feel free to answer it for me. If I have an additional coment I’ll make it. Thanks for your help.

In the future, I will answer specific questions on pair analysis to the best of my ability, but I think we’ve done enough now that I shouldn’t have to go through every one line by line. Others are also invited to add their comments. Two heads are better than one :):smiley:

thanks, Graviton,
I don’t follow any politics as well. But I can look up on internet, no problem at all
I dont have any questions at this time, thanks Trend line would be a good indicator. :slight_smile:

If you follow Gann’s way of thinking, he basically implied that market movements breaking a previous low will actually go lower. I think he had a 3 point rule. This is based on something he published called The New Stock Trend Selector.

If the 15 year low has not been broken and formed support I would look for a long. If the 15 year low has already been crossed, that low may now form resistance.

This is just my opinion and I would definitely listen to Graviton if he disagrees with the thought, as he has far more real experience in ForEx and Gann was writing for stocks, which may not completely correlate.

Very good. I believe it’s best for a new trader to have a system they can follow objectively. Less room for mistakes that way. A trend line is a very valid and prooved method to define a trend.

Please don’t suffer and struggle in silence. Your questions and the answers help everyone :slight_smile:

I agree completely. It’s hard to disagree with Gann. But we want to move beyond theory and “see” a potential trade, or even more than one possible future trades.

As you stated, a new low has been made, looking at the daily chart you can see there was a small retracement and now we are in a very tight squeeze.

Also as you stated, once a new low has formed, further new lows are likely. So we are looking for an entry to get us into formation of further new lows. Now we know just what we are looking for :slight_smile:

Drop down to the 4H chart now. You can see it is also in a tight squeeze. It has already touched the top BB, and is at the bottom BB, ready for a breakout down. Re-read Tymen’s rules for trading a breakout of a squeeze in the latest pdf from his thread. Since my daughter cooked me bananna pancakes this morning, I’m in a very good mood :slight_smile: She knows I get grouchy when I get hungry. Daughters are such a blessing. Since I’m in such a good mood, I’ll go and fish out the link for you. Here it is:

BabyPips.com Forex Forum

This breakout from a tight squeeze is your trade coming. If you drop down to the 5M and 15M chart, you can watch it flowing upward to your home chart, in this case the 4H chart. That’s not necessary, but it confirms your vision, and it sure is nice to “see” a plan come together. Happy Trading

A graphic would be GREAT :smiley:

Please do!

Thanks

Eur/Usd opened gap up. Trading “Gaps Usually Close”. We’ll see.