Multi-Time Frame Trend Trading

Sorry i forgot about the pair analysis…

Here is my analysis for GBP/CHF:

[B]Monthly[/B]: Down trend from 2007. MID BB is pointing down steeply. Price has been ranging in last 6-8 months, and has also bounced off previous support (1.5798). Current month candle was BULLISH (april 2010). Next resistance area 1.7017.

[B]Weekly[/B]: In down trend since AUG 2008. Price entered BB squeeze for 4 weeks and then broke down into BB walk. Up ward retracement for the last 5 weeks, with MIDD BB acting as resistance, and price now closing below it (small BEARISH candle). Also price is around majot SUPPORT/RESISTANCE area (1.6465).

[B]Daily[/B]: Price went into range from OCT 09-FEB 10. Then broke down and bounced off a SUPPORT line dating back to DEC 08. Price has been in an uptrend for since end of march and is trading above the MIDD BB but unable to close above the OUTER BB, with the candles begining to range a little. Last candle was BEARISH but failed to touch MID BB.

[B]H4[/B]: In uptrend. quite a few downward retracements over last 6-8 weeks, but overall in uptrend. MIDD BB pointing down slightly and price ranging a little for last 10 days. Again price is around strong SUPPORT line (1.6465)

[B]H1[/B]: Uptrend since mid april. Downward retracements are strong but are failing to make significant lower lows. Last retracement was steep, with MIDD BB pointing down and priced walked the LOWER BB.

[B]M30[/B]: Price entered a squeeze area and a 2 or a 1 CBL rule would have given you an excellent entry for the downtrend that followed. MIDD BB is down but OUTER BB has contracted significantly.

[B]M15[/B]: After last downtrend price has entered squeeze area, with MIDD BB FLAT. The lower bb has acted as suuport twice with last candle of the week appearing BULLISH and touching the MID BB.

[B]News[/B]: (from bloomberg): May 2 (Bloomberg) – Glencore International AG is studying a merger with Xstrata Plc that would create a mining and trading group valued at 55 billion pounds ($84 billion), the Sunday Telegraph reported, without saying where it got the information.

Advisers are working on a two-stage proposal where Glencore, the world’s biggest commodities trader, would merge with Xstrata in a “reverse takeover” and then reduce its stake in the enlarged group to below 40 percent, the newspaper said. Glencore owns 34.4 percent of Xstrata, it said.

Xstrata management, led by Chief Executive Officer Mick Davis, would retain control of the combined company, the Telegraph said. Xstrata, based in Zug, Switzerland, is the world’s biggest producer of coal burned by power stations.

Goldman Sachs Group Inc. is working with Xstrata alongside Deutsche Bank AG and JPMorgan Cazenove Ltd. while Morgan Stanley and Citigroup Inc. have been putting together Glencore’s proposal, the Sunday Telegraph said. Credit Suisse Group AG may also advise on a deal, the newspaper said.

Investors in Glencore’s bonds, including First Reserve Corp. Government of Singapore Investment Corp. and Zijin Mining Group Co., would consider a deal if something is put forward, the Sunday Telegraph said.

Xstrata spokeswoman Claire Divver and Glencore spokesman Marc Ocskay both declined to comment when contacted by Bloomberg News by telephone today.

Well, my gut tells me it will open up (and it did) but thats not a valid reason to enter now is it;) The daily is in a pretty good squeeze. Wait to see if it breaks up, following closly on lower TF to get an entry. Or watch history being made if it breaks below the 15 year low and ride the wave down?

First, I do not use the trend count beyond about the first few minutes of the morning. It’s just a quick way to direct my attention in the morning. Do not trade by it. If you are confused by it, delete it. It does not replace multi-tf analysis. I’m afraid there is no short cut to that.

Second, I use a trade filter to reduce stopouts, The Stoch, default settings. 15M chart, if short period or fast stoch line is above long period or slow stoch line, only take long trades, if fast line is below slow line, only take short trades. This has helped me reduce stopouts, no mater the home chart TF I am using to make a BB DNA entry off of. Backtest before trying, as always.

Oh Lord.You just make my day with this work.Thanks so much for your work.
Good job
Headmaster

For those of you who asked me on the chat pages last week for an explanation of how I set my stops; I provide the following information. It is an alternative to using a fixed number of pips for Stops Loss, Take Profit and Trailing Stop settings.

Both methods attempt to take into account the volatility of individual pairs at different times. One uses Stoller Average Range Channels (STARC) which is based upon Average True Range, the other uses the Parabolic Stop & Retrace (PSAR). Either method can be used to determine just how far below the price your Stop Loss should be. They both work better in trending markets and not so well in ranging markets. Investopedia and other financial sites have definitions of these terms so I will not waste space (or peoples time) explaining their derivation here.

My preference is STARC. As a long term Trend and short term Counter Trend trader, I also use this for manually trailing my stops in preference to the automatic trailing stop (which has a tendency to take you out of the trade prematurely on a news event or price/spread spike). The STARC bands are a simple way of applying the “2 x ATR” rule for stops, that some of you may be familiar with. You can see the settings I use on the accompanying chart. Other settings may work better and you should experiment with different settings in DEMO if you wish to apply these methods.

The main benefit I see is that using STARC, the stops vary automatically depending on the TF selected. When we are trading with the trend we will be on higher TF (H1 and above) so we will allow the trade more breathing room with wider stops. On CT trades, we use a shorter TF (M15 or M30) and so we want tighter stops.

While I find it works better for me, it doesn’t guarantee better results than a fixed pip method. It may or may not help you, depending on your individual approach. Hence it should not replace your own judgement of the trade dynamics at the time.

As always, you should test extensivley in DEMO before you apply these methods to a Live account.

Second, I use a trade filter to reduce stopouts, The Stoch, default settings. 15M chart, if short period or fast stoch line is above long period or slow stoch line, only take long trades, if fast line is below slow line, only take short trades. This has helped me reduce stopouts, no mater the home chart TF I am using to make a BB DNA entry off of. Backtest before trying, as always.[/QUOTE]

Graviton,
I have 4 stoch indicators on my platform.
Fast Stochastics, Slow Stoch, Stoch Oscillator and Stochastic
two of them are 8 period,two 5 period, they all have slightly different standard settings. I would like to make sure I’m looking at the samething as you mention here…What are the defaults for this on your platform?

Thanks
Jack

Yes, most money is made sitting on your hands. If this works, it will be a loooooong trade, You will have plenty of time to be sure before entering.

Of course, it may use the new low as support. That possible too. Too early to tell.

Thank you, Graviton, for making this thread. I found it on Friday, and caught up with it today in between naps.
One thing I thought of in one of my catnaps (yes, ofter inspiration comes to me in light sleep) was an idea for a hybrid system of your and Tymen’s money trading system.
One would enter a trade with 2 currency units, rather than one. (for ease of calculating, I have used the 10 pip movement during this explanation. Any number can be used though). The SL would be 10 pips for both lots, and the TP 20 pips for one lot. The second lot would be left to run until the end of the trade. At the point that we take the first lot off, we would enter another 2 lots, and the SL of the first trade would be moved to +10. Same SL application rules apply as to setting the first SL. After a climb of another 20 pips, one lot would be taken off, and the other left to run. SL would be moved for both pairs to the +10 pip mark for this pair. Reentry made. Repeat, Repeat, Repeat, until there is no more trade to be had…
From my observation, with a 15 pip SL and 30 TP, the average trade would take use of this method 3 times in this system. I have seen some recently that would take 5-6… Especially from Thursday night/Friday morning’s breakout in London open. The BB were really tightly squeezed then… 9-15 pips on the 30 min charts I was looking at. There would hardly have been time to catch that movement before it crossed the mid BB…
Just my observation.
Criticism anyone??

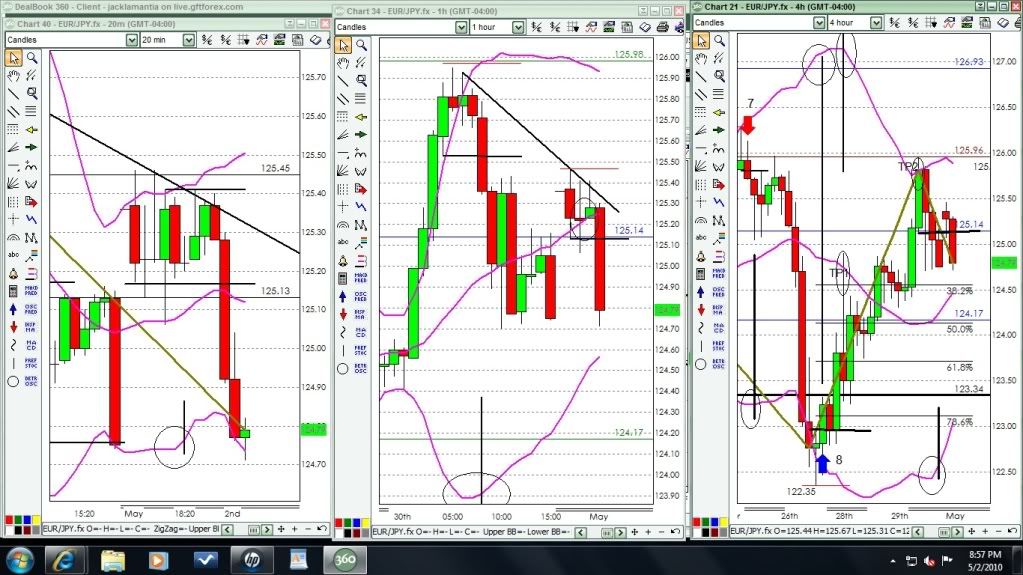
Example of CBL trade EURJPY

H4 trend = down
H1 trend = down -
M20 trend down = CBL drawn from high candle (open candle)
I am not sure what Tymen’s rules are for Sunday open candle…but it was at the uppper BB…Big Gap up…(fill the gap) So I felt comfortable with a quick enty and exit here off the M20 chart.

Thanks
Jack

My first thought would be that with a SL of 10 pips and TP of 20 on one of your positions, you may not have picked up the concepts that Tymen was trying to get across in his BB DNA thread, especially as it applies to counter trends. (I could have misunderstood your example though :wink: )

The initial SL will be variable, depending on the CBL and the extreme candle wick. Rarely will it as low as 10 pips. If you set a SL of 10 pips, you will be stopped out far too often, resulting in missed trading opportunities. Also, the initial TP should be set at the mid BB. This may be 10 pips away; it may be 40 pips away. Again, variable depending on the situation.

It has been noted by a number of posters that a different approach maybe used for Counter Trend as opposed to Trend. i.e. - Scale with the trend, 2 x positions when counter trend.

Further, I would argue that we should not get hung up on a set number of pips between entries when “scaling in”. Graviton uses different ranges for different sessions. Just find a range you are comfortable with, test it extensively and see where it takes you.

Alternatively, when you are learning the idiosyncrasies of the various pairs (as I am), you may prefer to use a volatility based indicator in the range of 2 - 4 times ATR (Average True Range).

4 lots on now on this one, +160 pips.
1 lot on eur/chf, steady cruising + 7

As I said, TP, and SL numbers were only numbers pulled from the air to make the math easy for my tired brain… Any numbers could have been used. I was only explaining the method that I had come up with, and without numbers it would have been impossible to explain. Is the rest of the method workable??

You are very welcome. Glad I could help.

I’ve traded one way for 22 years and I can barely explain that. Now these math wizards here in this thread have convinced me to let my lots run to reduce spread cost. So, I just tried it in my live account. 5 lots on and running up now, +230 pips and still running. This is too much for an old man. I’m going to let the math guys sort this one out.

Thanks for the suggestion though :slight_smile:

If that E/C is a sell, don’t count on it going much further down than where it is right now.

The Swiss have finally manufactured a bottom for the euro, and it’s sitting on it:D

This & Tymens thread have been simply epic!!!

Actually I’ve still got a 100 odd pages to finish on Tymen trend trading, but I thought I’d better get into Graviton’s MTFTT thread before it became a mountain of information to digest! as well :stuck_out_tongue:

Anyway, a big thanks from another completely green newbie,

My brain is sooo full of this awesome info & I’m dying to put it into practice, just not enough time in the day right now to sit down & methodically plan out a trade. :confused:

Thanks again guys, & hopefully I will soon have some time to put it all to practice & contribute in some constructive way on this forum.
:slight_smile:

AUD/USD

As it hadn’t been touched yet (it’s not that bad) I thought it worth having a crack at the ozi dollar - pls see below.

MONTHLY/ bigtime up since 2001, being another comdoll this would be on the back of the resources boom. Minor correction in 2008… and now recoved ~90% of those losses. Trend is still up but we have some indecision candles and some wicking - can we get to parity??

WEEKLY/ Trend here is up but price is sitting spot on a trend line starting back from mid 2008 - needs to break and close free of it for a run up? (noticed as well we are flirting with the highs of 2007)

DAILY/ Trend is up but we are chopping around at the moment - thinking that if we make a break either way it should be a good break from this consolidation. A point to note aswell - looks like theres been a fakeout either side of a bit of a penant type pattern - signalling more indecision.

240/ In a kind of sideways channel and pulling back to the 20sma in the middle of the bolingers. Price turns have so far been at the extremes of the channels so we would probably step away from a trade on this TF right at the moment.

60/ some nice tradeable trends from the extremeties - price has been respecting lows and highs and following the mid BB/ 20sma. Price currently popped back above the 20sma and touched the upper BB in a squeeze. Good resistance here and in the fib zone so worth looking to shorter TFs.

30/bearish candle pattern at the top bollinger with other resistance - could be worth investigating further.

Fundamentals/ can’t find much beyond talk of the new tax regs (dunno if you can read into this) Things to note though - interest rates are up so the dollar is returning value on carry trades, the mining boom looks to be well in swing again, unemployment is holding steady at sub 5%, inflation is running at a relatively healthy 4.5%, the government seems to be having little trouble getting new policies though parliment and well thats about it for now…

My take / new tax regs may take a few days to filter through the market so this may be a reason for the indecision over the past month or so. Worth a crack on the lower TFs still as the trends have been clean on the 60.

Please let’s know what you see - am really enjoying this and Tymen’s thread - keep up the good work guys!

Regards,
dan

Damn it should have stayed up for the week openings , all i got today was a 20 pip loss before i realised london banks are closed :o! That EUR trade looked ideal for a video , maybe too good :D!

Tymen’s excellent thread, The Finest In Trend Trading, should definitely be read as an intro to this one. Otherwise when we are discussing things like CBL’s a lot is lost. It is a lot of reading, but well worth the time and highly recommended. Happy trading.