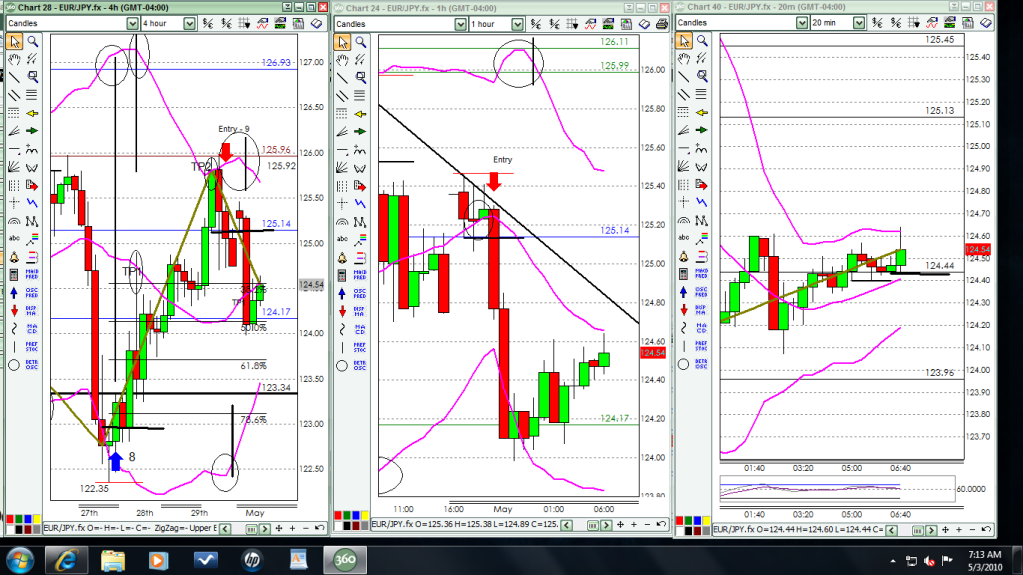
TP1 hit, stop to +10
PA went to 50 fibo…now at 38 fibo
By Tymen’s rules - Time to cash out - I am setting a 20pip trailing stop and we’ll see what happens while at work today.
I’m seeing some signs that the short will continue.
M20 chart at the upper BB - h1 at the mid-bb, h4 at the 38fibo
Also on the h1 - PA went though 62ema and retraced back to it and looks like bouncing back down from it (also the 200 sma) These are not shown on my chart.
Thanks
Jack
Good call Master Tang. I closed out at +7 before bedtime. The eurchf still looks ready for a breakout down on the daily chart, but the Swiss Central Bank is famous for intervening in the Swiss Franc to keep it’s value steady, so as Tymen always says, price can do anything. Even if the breakout happens, it would probably be over a very long period, so no need to rush into this trade. Happy Trading.
The eurusd trade was one of four trades I put on soon after the open, I closed the others earlier that had only one lot open, except eurchf, as they were moving too slow or turned the wrong way. eurusd finally turned and stopped out, as every trade will eventually. Final results on all 4 opening trades, usdcad -12 pips, eurchf +7, audusd +4, eurusd +176.
Jack, thanks so much for posting your charts. This is a great help to new traders who are trying to figure out what the heck we are doing here. Let me again encourage other traders to post your charts showing how you impliment these priciples. Thanks again.
This won’t be a long winded post. We’ve spent a ton of time discussing how to find good trades and how to manage good trades. It’s time now to look at the dark side of trading, managing bad trades.
There is one way to manage bad trades. Exit. No magic here, just exit. But to manage a bad trade you have to be able to recognize one. After you have seen 10,000 bad trades, they start to stand out. But for new traders, here are a few clues.
Bad trades come in one of four types. The first is one that moves rapidly against you right after it’s opened. Always watch a trade right after opening it to make sure it’s not one of these. If a trade moves rapidly against you right after open, exit quickly. Do not try to figure out why it is moving against you. Do not wait hoping it might come back. The market doesn’t give a darn about your hope. Exit as quickly as you can. If your analysis was good you may get a better entry later. If you don’t, you did the right thing.
The second trade moves slowly against you right after open. It’s a slow death. Exit the trade. Don’t die the slow death of waiting for it to hit your stop. If it drifts 4, 6, 8, 10 pips against you, just exit. If your analysis was good, you may get a better entry later. If you don’t, you did the right thing.
The third type of bad trade moves a couple pips in your favor right after open and stalls. You want to give this trade reasonable time to continue in your favor, but if it doesn’t, don’t let a winner turn into a loser. It’s tying up your margin and not working for you, so just exit while it’s still in your favor. Even if it’s only a couple pips in your favor, it doesn’t hurt your W/L ratio that you always track closely (right?).
The fourth type of bad trade moves well in your favor right after open, then turns and starts giving back pips. Exit this type of trade before it turns negative. Don’t let a winner turn into a loser.
There, that wasn’t so painful, was it? Any questions?
Well im a master at gettin stopped out at BE on good positions, any tips on that Graviton? Thats really bad trading :(.
Missing a limit entry by 1-2 pips and not entering manually while watching under great conditions is also in my repetoire:D! Ive lost more good trades recently than bad ones:eek:! Good thing i get more good ones but still!
Managed to recover my losses today though with a 18pip profit:D!
Loppan, have you registered with the chat site? There are at least 18-20 us on there every day, including Graviton, sharing our setups and trades. You should stop in and join the chats to get some helpful advice:
Graviton,
I have 4 stoch indicators on my platform.
Fast Stochastics, Slow Stoch, Stoch Oscillator and Stochastic
two of them are 8 period,two 5 period, they all have slightly different standard settings. I would like to make sure I’m looking at the samething as you mention here…What are the defaults for this on your platform?
Thanks
Jack[/QUOTE]
My MT4 stoch default is 8,3,3 if you want to backtest the trade filter
Nope. No questions…just a comment. I’m not at all surprised that your advice goes contrary to some (most?) of what I thought I should do, based on the advice of others. I was told to “stand by your guns,” and let the trade go where you thought it was going…including letting your stops get hit. Following that advice has been costly on many occasions. THANK YOU, once again, for putting me on a different - and, no doubt, a more profitable -path.
Graviton do you stay away from any pairs due to spread cost? Such as pairs with 4+ more pip spreads?
Or if you don’t, do you adjust the entering of a new contact to take into consideration of the spread? So for my broker the EUR/AUD is 6 pips. If I enter at +15 pips, isn’t that the same as entering at + 9 and I should wait for it to go higher before using more contracts?
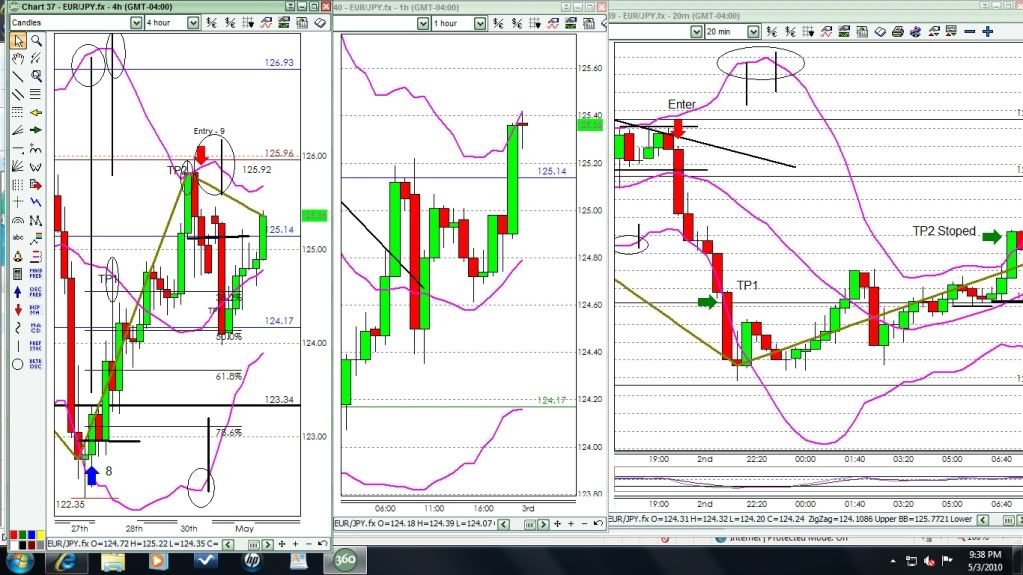
Here is how the rest of my trade played out today.
My analytics from this morning told me stay in the short trade.
Guess what…PA went north and my Stop got hit with in a candle or 2 after I set it.
Had I followed Tymen’s rule on exit I would have gained an additional 25 pips.
Here is the final charts showing what happend.
Final outcome TP1 +60 pips, TP2 stopped out for + 37pips total 97pips.
Now I’m looking for the next CBL short on this pair.
Monthly chart looks to be entering a squeeze, PA currently at mid-bb and downtrendline. It has bounce down off this area in the recent past Weekly - same thing - seems like 126.00 has been resistance here Daily - At mid-bb, at down trendline and at 78.6 fibo from hi/lo last week. Looks like it will close above mid-bb…watch for break of trendline long…see if 126.00 will hold or not and maybe take the short from there if it starts to reverse H4 - approaching top bb…start looking for a hit on the bb and then contraction of opposite bb H1 - At top bb…start drawing CBL and look for opposite bb to contract M20 - same thing. Short term S/R line at 125.45
News - Can Greece implement belt tighting or not?
Below is trade completion from last night
Good Trading.
Gee, you ask tough questions! And not just one but several! OK, let’s take them one at a time. Let’s look at being stopped out at BE “on good positions”. Of course, it’s the “on good positions” part that bothers you. If you were stopped out on a bad position at BE, you’d consider yourself lucky. So how do you define a good position? After the fact. If you are stopped out of a long at BE and after the fact the price drops another 50 pips, you consider yourself lucky you got out at BE. If price soars 50 pips after being stopped out, you would consider that you were stopped out of a good position.
Notice here you say you are stopped out at BE. Not at a loss, or even +1 pip, but exactly at BE. Now just how did your stop get at that very precise position in the first place? Obviously, that’s right where you put it. So why did you put it there? Because you wanted to remove any possibility of taking a loss as soon as possible. In that you succeeded.
Taking a loss is difficult. Taking a loss is painful. It’s only human to want to avoid that pain. But even if you have a wonderful win/loss ratio, say 4 to 1, you will still have to take many losses over time. And if the price is zig-zagging up as it usually does “on good positions”, and you move your stop to BE just a little too early to avoid that pain of loss, you will be stopped out on a good position that will continue a nice climb after you are stopped out of it.
Now, it’s clear that your trade analysis is good. If it weren’t, you would not have been in that “good position” to be stopped out. So the entire problem is a concentration on BE that causes the early stopout. I don’t know how you are setting your stops, or what data point makes you decide to move them to break even, but if you are having this problem, it isn’t working for you.
So you will need to do two things. First you will need to find a very mechanical system of placing and moving your stops that is totally independent of your BE (which the market doesn’t know about), and totally dependent on price action, which everyone in the market knows about. You have several possibilities for that, like the PSAR. You can easily adjust the variables of the PSAR to have it move faster or slower with price. Then with careful tracking and measurement, you can adjust those variables to optimize the PSAR to not stop you out to soon or too late, on average.
Of course, some pairs are more volatile than others and some times of day are more volatile. Optimizing the PSAR for each of these conditions would be quite a chore, even if you have the math skills. A simpler system is to place your stop under the last swing low and move it up as new higher swing lows are generated during the move up, ignoring whether you are ahead or behind in the trade or where your BE is. But the point is to make placing and moving your stop a completely mechanical system so that it requires no decisions on your part. If you have to make any decision at all in the middle of a trade, you will always choose to avoid the pain of loss. So your plan must be devised before you enter the trade, while you are under no threat of loss. Then you must have the discipline to follow that plan once in the trade.
The second thing you should do is learn to deal with the pain of a loss. You can use any number of psychological techniques to accomplish this and I couldn’t possibly say what will work for you. I can tell you what works for me just as an example. I track my win/loss and risk/reward ratios, average win, average loss and many other measures of my business performance. I have it down to the point that I know that for every loss I take I will have, on average, one win twice the size of that loss. There are two ways to look at this. The common way is the losses are the price you pay to get the wins. But an odd way to look at it is the losses cause the wins. It really doesn’t matter, so I choose to look at it that way. So every time I have a loss, I imagine a cash register ringing up a sale from the win that must come from it. I see the hand pulling down the lever and hear the cash register bell ring in my imagination because I know that loss makes a win later. It’s a trick I learned a couple decades ago and I’ve used it on every loss since. I have to be careful that I don’t try to make a loss just to hear that cash register ring now. I just give my experience as an example. You must learn to defeat your own demons. Get professional counseling on the issue if need be, but deal with it. Don’t keep doing the same thing over and over and expect eventually to get different results. That’s just not going to happen.
I’m tired now and my sweet daughter just brought my dinner to my desk. If you find something useful here, use it. If not, know that I did the best I could to answer your first tough question.
I usually find the pairs that trend the best are also those with lower spread costs. I don’t stay away from any pairs though. If spread cost causes me to not have adequate room for stop loss, I’ll add some pips to make up for it. So adding three pips for the first three lots to BE costs me 9 pips total. After that spread is won, so it doesn’t matter. If it’s worth the extra 9 pips to trade that pair rather than another I’ll pay it. It would need to be a really good pair for me to pay that cost though.
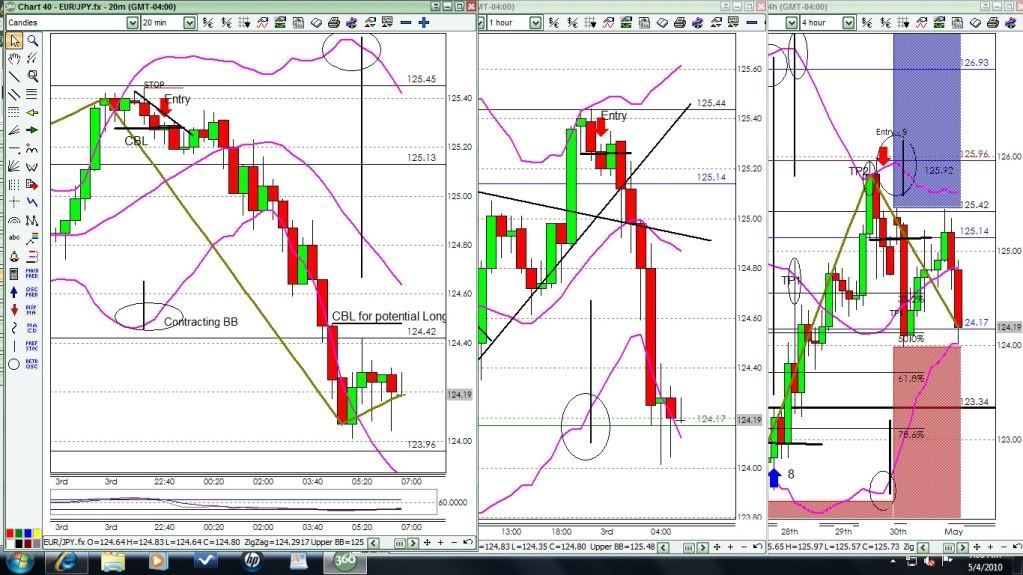
Another example of Tymen CBL trade.
Too bad I was too tired last night:o
I was watching this one develop last night but decided to go to bed instead, prior to the CBL being crossed. The only thinig I did not like about the way this trade was developing was PA did not reach the upper BB on the h4…so there was still some room for the long…
I’ve marked the entry. TP1 would have been at the h4 mid bb, TP2 at the touch of the bottom bb of the h4
I’ll be looking for the next long now…the folks at GFT say there is a gartley pattern forming for a long at 123.24…If that is the case than PA may continue to walk down the bb. This will be a wait and see for the long trade.
I have made a slight mod to IronHeart’s indicator just to split the numbers up into our three main time frames.
Longer Term (LTFT) is Monthly, Weekly & Daily
Medium Term (MTFT) is H4, H1, M30 as these are our most common trading TF’s
Short Term (STFT) is M15, M5 and M1, which are really our PA signal TF’s
The reason for this came about due to discussions in the chat room about when NOT to enter trades.
Graviton stated, “I won’t go long when the lower TF’s are dropping, I won’t go short when the lower TF’s are rising, in real time, not in hindsight. That should be enough to keep you out of most bad entries.”
As I use it, if I am looking to go long, but STFT is -ve, I wait. If short and STFT is +ve, again, wait.
As PA perculates upwards from M30 to Monthly, LTFT and MTFT simply remind me if I am entering a likely counter trend or with the trend trade.
Others may or may not find it useful so I have posted it.
I am not a coder (back in the day, Fortran was my forte) so please excuse my inefficient methods.
Out of curiosity, how long do you let a trade that is either in profit or in debt to the broker, but is trending sideways run?? Do you have a rule in this matter?? or do you have a rule for each of the above mentioned circumstances??
I have been looking through a bunch of my charts, and an entry on the m1 chart usually provides a better entry by about 3-5 pips as compared to the m5 chart… Now, the entry on the m5 seems to be a surer deal and avoids trending sideways more. I just thought I’d mention it…
I"m starting to have an easier time spotting entries in hindsight, but still having trouble spotting them as they are happening yet… Getting to be about a 50/50 split…
as I dont’ have a lot of time at the computer right now because of work (seeding time on the farm) I mark the entries with the line drawing program, and write the text of the entry, stoploss, etc, and a vertical line on the specific entry candle. Then I come back and look at what happened next time I"m on the computer… My stoplosses average 15 pips or less.
Some times, I would only get 1 or 2 trades in the 5 lot system on, and sometimes I would get all 5 plus more with a 15 pip entry spacing… The 5 lot system is something I will have to work on as I get more time to sit and demo trade…
Do you still recommend looking at the m1 chart for entry?
Thanks. Happy trading!!!
OK, a couple questions, 1st, I am looking for a valid CBL entry on 30m or greater chart. Most have found 1H to be more reliable. Tymen has said not to use his CBL entry on less than a 20M TF.
Then I click down to lower TF’s to see they are all going in the direction of my trade only after I have a valid CBL entry. So if 1M or 5M is going down, I’m not going to buy until it hits bottom and then starts up. Sometimes that keeps me out of a trade where the direction changes right after valid CBL entry signal is given on the 1H chart which is my home chart for day trading.
Is that confusing? Sometimes I try to put into words something that just seems natural to me and I find it’s harder than I thought.
Your other question is more complex, how long to let a trade go sideways before exiting it. A good question though. I use the PSAR to tell me when a trade is going nowhere. It is calculated using both time and price. After a trade moves in your favor, the PSAR will start closing in on it. Depending on how patient you are, you can close when PSAR is taken out (reverses) on your home TF or any below it. Usually a couple TF’s below your home chart is quicker, but if you only want to watch your home TF, you can adjust the parameters of the PSAR to make it close in faster. You could do a complicated formula calculation to do the same thing, but the PSAR does the calculation for you.
What PSAR does not do is account for volatility well. In a very volatile market, you expect a trade to move faster than in a very slow market. If it doesn’t, then there are probably other pairs where you would rather park your margin. That’s where you can use the PSAR one or two TF’s down to put that trade on a shorter fuse. By a combination of adjusting the PSAR parameters and moving up or down TF’s, you should be able to create an objective method to put these slow movers out of their misery.
Let me know if you have any more questions about this and if so we’ll work it some more.

 Happy trading!!!