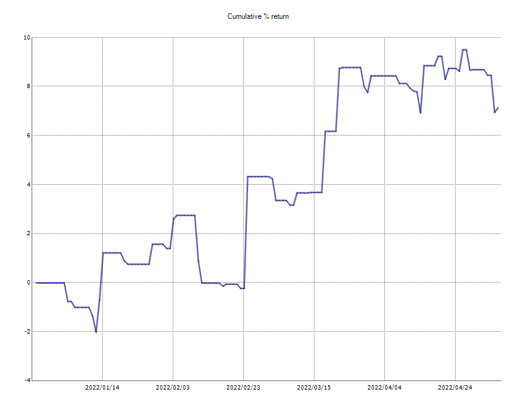
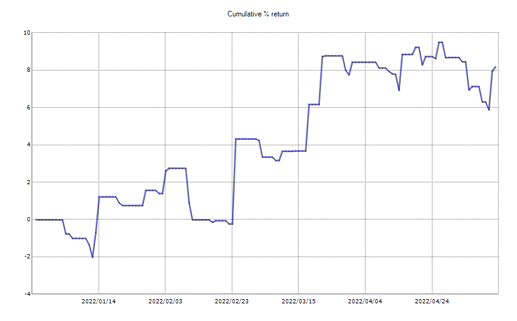
Small question: Last chart title reads “banked return $ per day” and has different Y axis values despite the same “curve” of the previous charts (cumulative % return). Is it a mislabel?
Hi Dim, thank you for attention  I just pick wrong option, here you can check live results.
How many strategies are you testing/running. Thanks for sharing.
This portfolio has build from 9 strategies, 195 is in evaluate time.
Thanks for the updates.
Can you shed some light on a strategy you use (if you don’t mind)?
Hi, what kind of information you want to get?
What confluences do you use to enter your trade?
Do you trade SMC? Price action?
Mainly I’m looking for ways to integrate bits and pieces of other peoples strategy to better my own strategy (which is mainly SMC and price action).
I am using EA’s in trading and statistical advantage in long term. Long time ago I am used PA , but I saw more disadvantages than advantage for me.
Good luck Greg! WIsh you luck!
Thank you 
This month begins from loss.
The portfolio of strategies executed 105 transactions, so I would like to show, why trading by portfolio strategies is very good solution. One of my strategy is in drawdown from 02.01.2022, I made a simulation, what happens if you choose one strategy and this strategy will be in drawdown begins from live trading.
Simulation setups
Backtest period: 2005.01.01 - 2022.05.06
Initial capital: 4500 USD
Lot size: 0.09
Max DD: 522.63 USD
Red vertical line on picture show date when original strategy start live trading. As you can see, you can be in drawdown by several months instead of profit, if you are to use one strategy.


