My journey journal...from demo to live...and beyond

Hey Journal.

Check this out.


This was the last thing I did, and took a picture, of when I finished setting up all of my trading accounts. I spent a long time thinking about this. This is the only way it’s gonna work for me. For the way I trade.

If I was serious (which I am), and when the time comes, this is how I’m going to go about it. I have a total account balance of $80,000. Each currency will get 12.5% of the total. What I’m doing here is diversifying and apportioning that much to each complete currency I trade. I can even envision possibilities of lateral transferring of funds between currencies. Cause, what if I have better luck with one currency more than another? Well, that’s for stuff down the road. I’ll cross those bridges when I come to them.

The reason why I need to do it this way, is simply for keeping track. Can you imagine if I had all of these on one trading account? I wouldn’t be able to separate my USD trades from any other trade. Don’t forget, my one USD trade will consist of 7 USD pairs. And for me to know where my take profit place will be, requires me to know how much of my account balance is, at the time when placed. Not even to mention that my position sizing depends on what my account balance is also.

This is the only solution. Even if I had a live account, with 80k, I would still have to do it this way. Which is needing 8 separate demo accounts in order to track the individual accounts. Then all I would do, on the 1 real live 80k account, is have the correct numbers (position sizes, take profit places, etc…) to input into it. That’s all.

In the meantime, I need a way to keep track of the total amount of money I would have right now, as if this was real. Right?
Well, it looks like this.

2020-08-01_16-11-47
So. At any one point in time, I will have this block of data available, and current. If any changes would take place with any one currency, then I would have to update it. I call this a block. Therefore, any changes requires a new block to be made. I will do this to the right of it (in my excel). This will, in effect, produce a progressive story of the course of events that will take place. It should show me more data about what is working and what’s not working.

Ok. Well, that’s the whole entire set up. And what I plan on doing is making a journal entry (in here) whenever I make a new block. Basically, it would be what the current status of my trades look like. It won’t change all that much, cause they run for days. Remember how many days those earlier ones ran for? Same thing. Some longer than others.

I guess I need to go over one more thing, about my money management plan. As opposed to those other trades, I’m not shooting for 10%. Let’s see. I’m just gonna show you my mind map.

My take profit place will be a dollar amount. When it reaches it, then I jump. Just like I’ve been doing with those other trades.
Specifically :

  • 49% of the allotted account balance
  • 6.12% of the total amount balance

Those are the same thing.

Anyway, my position sizing will simply be 1:1 ratio to what the allotted account balance is. On each of the 7 pairs. So, I’ll be starting out with 10,000 units on each pair. That’s all. And as time goes by, that size will be adjusted. The bigger the account gets, the bigger the size will be. Likewise, the smaller the account gets (for instance, when I have to exit and get back in going the other way) the smaller the size will be.

Well Journal, I guess I don’t need to explain all that much beforehand, cause you’ll pick up on it as I go. You know, it’ll be play by play. And I’m sure I’ll explain it at that time (sorry).

Alright Journal.
Gonna get going.
See ya tomorrow with some more stuff. Probably look at some other currencies, for possible opportunities.

Mike

1 Like

Look at you! I really enjoy reading your journal. Better than a murder mystery. And you murdered it last month. Please keep up the excellent journal.

2 Likes

Hey Journal.

Well, I told you I would. And here we go.
It’s approximately 5:20pm now, Sun night. Market open. And I’m carrying trough with what I planned. I’m in with my first 2 trades. Only. And this is really the only thing I need to show you.

2020-08-02_17-19-10

That P. size is position sizing. Which is 10,000 units. On each pair (7).
So. Long USD, and JPY.
And I won’t touch this until a take profit comes. Which would be the account balance going up to $4,900.

Let’s see what happens.
Got all month.

See ya on the next journal entry. Journal.

Mike

P.S. - Thanks Mondeoman!
And P.
For the encouragement.

1 Like

Hey Journal.

I have some changes to my trades. And I told you that you’d be the first to know. Well, here’s what’s been happening.

So. I placed my 2 trades at the open. The USD, and the JPY ones. And things have been going well. Of course, I keep an eye on how the trades are progressing. Back and forth, back and forth. You know. The same old thing.

Anyway. Over the course of this time, I’ve definitely realized that I’m not playing with the position sizing that I thought I was. It was bugging me a lot, yesterday and today.

See. This year, for the first 4 or 5 months of the year I struggled with this particular lot size. It was just too small. And it made me do things that wasn’t good. I made changes and adjusted the strategy to compensate for how small that was. Bottom line…it wasn’t right.

When I finally went with doubling it, and not doing anything else, is when I finally found success. Well, that’s how it went this year. And see now, with my new money management system in place, for some reason, my figuring went back to that.

These last 2 days were reminding me a lot of that.
It’s just not right.
I need to have a large enough position sizing.
I can’t have too small of a positon sizing.
What I want is about an average of 700 pips to be accumulated, to reach my target amount of money. But when I seen with my USD trades, being up over 300 pips only netted around 1%, I’m like…somethings terribly wrong.

All I’m doing here is going down the same road that I already did, this year. So. It’s time to change. Again.

My complete currency trade consists of 7 trades running as one.
USD (long)

  • USD/JPY — 20,000 units // .2 standard lots // 2 mini lots // 20 micro lots

  • EUR/USD — 20,000 units

  • GBP/USD — 20,000 units

  • USD/CHF — 20,000 units

  • AUD/USD — 20,000 units

  • NZD/USD — 20,000 units

  • USD/CAD — 20,000 units

That is my one trade. My one USD trade. Now. (Not 10k on each.)
The reason why I say that it’s one trade, is because if I do anything to it, all 7 pairs will be treated the same. If I take profit, they all come off. If I change directions, then I exit out of all of them, and get back in going the other way. I just won’t do something differently with one of those 7. This is called the basket of trades. All for one, and one for all.

So I corrected my USD trade and my JPY trade, accordingly. You’ll see it in a minute.

I do have one other change.
This was bugging me also, especially after I ran the numbers yesterday.
It’s the CAD. Many, many reasons I have in mind for them.
But, I got a strong hunch their on their way up. Just like the USD.
So, I’m in with them now, also.

This should’ve been the only thing I had to show you Journal.

2020-08-04_16-14-44

So, sorry about all that explanation.
Bottom line now, is when I see my particular account balance reach those stated numbers, that’s when I will exit out for take profit.

Oh, and I guess I will wait till the EOD and try to come up with what the latest total account balance will be.
But, on the other hand, it’s just way too soon to be worried about that.
These trades are gonna be running for days anyway. Those account balances will be moving back and forth all the time. So, it’s actually pointless now.

Alright Journal.
See ya next time.
Mike

Hi Mike,

I am following your journal with high interest. I have never tried to convert PIPs into LOTS for Forex. For each of the trades above, how many dollars per PIP does each trade represent, and what is the total size of your trading bank? The Lots have me confused.

Hey Mondeoman.

This will be good for me.
Simplify.

I guess I need to preface a lot of this with some things (I’m not your conventional, by the book, trader).

See. We are all taught this. With every trade, we are juggling these important factors.

  • Take profit place
  • Stop loss place
  • Position size
  • Risk/Reward ratio

All of these factors will help you in knowing, beforehand, what to expect from a trade. It’s setting up all of the boundaries. It’s all the controls we could possibly need to protect ourselves. Right? Plus, it does make sense to go about it this way. Can’t be too careful with your money. Especially with new traders.

Well, everyone usually starts out with these variables. On the contrary, no one should be having identical parameters on each of those factors. Everyone is different. Some want the trade to travel longer or shorter than others. And if shorter, then the position sizing usually will be larger, to make up for the distance needed to travel.

Basically, all I’m saying here is, where you normally begin a strategy usually boils down one of those factors, and how it will affect something else. Usually, where you want your take profit or stop loss usually will tell you how much of a position size you will go with. Just by plugging in those things into the position size calculator tool.

I’m hoping I’m sounding simple minded here. I think we all know this stuff. Sorry. But. I think it needs to be said. Why? Cause, I don’t approach my trades this way. Sure, there are some things I need to know (take profit place) in order to know how much of a position sizing I need. But. My whole entire point here, so far, is that I don’t play with some of those variables. Like a formidable stop loss. Even the R:R ratio thing. That is not in my vocabulary. Or my mind. It’s just not the way I prefer to think, about what happens with my trades. That’s all.

Let me try to explain my thinking that makes me arrive with my position sizing.

  • No stop losses
  • No time limits no how long they will run (swing trading)
  • Basket of trades
  • I track the market and follow it

-No stop losses
What happens if I’m wrong, or losing? Well, due to the fact that I track, monitor, and know how all the currencies are relating to one another (on a daily basis), I am aware of what’s going on. That means something. If my bias is wrong, then I’m able to change it (my direction).

-Trades run
I’ve learned not to put time constraints on my trades. You know how many times trades eventually come back around to what you originally were thinking? Yeah. Way more times than not. So, when it comes to trading, the biggest, most important factor is time. Just give it the time it needs to play out. Chances are better that it comes around to you, than if you put up these boxed up take profits and stop losses parameters.

-Basket of trades
This is a major dynamic that affects your balance differently than with only one trade going. It’s the difference between putting all your eggs in one basket, and spreading them out. There’s a hedging characteristic with this. And the only way to have any kind of control this way is to know what’s going on with all of the other currencies. But I have that covered. I do know what’s going on. Like, in a very detailed way.

-I adapt & follow the trend
See. I have accepted the fact that I don’t know what’s gonna happen in the market. Surprises happen all the time. I realize that. So much so, that I am ready to adapt and change when the time comes. I mean, I don’t care who you are, traders are always wrong, at some time or another. But, over a longer time period are we able to be more correct than not. I’m sure everyone’s read of the fact that the daily time frames and above have proven to be more reliable than any shorter time frames than that. See. All we can hope to get is an edge. I believe in the edge of patience. Give the trade the time and patience it needs to play out. But, you won’t find me putting parameters and conditions all around a trade, in order to be consistent. I think that’s impossible.

Anyway. Sorry about that nonsense. I’ll get into some very particulars now.

Well, Mondeoman, I’m trying very hard to understand your questions.

  • Converting pips into lots?
  • $'s per pip?

How about I go about it this way. Let’s look at the position size calculator, and the pip value calculator. But first, my account balance is $10,000 per currency I trade. That’s apportioned.

My total account balance = $80,000
Each currency will have $10,000
USD - $10,000
EUR - $10,000
GBP - $10,000
CHF - $10,000
JPY - $10,000
AUD - $10,000
NZD - $10,000
CAD - $10,000

That’s 8 separate account balances. All tracked separately, according to how I trade that particular currency (my complete currency trade).

Think of it as being diversified.

If I trade, say the USD, then I go to that account. It’ll have $10,000 in it, in the beginning. It’s like having all my money divided up into 8 different buckets. It’s what’s apportioned to those different trades I could be in. Of course I won’t be trading all of them. It depends on what trading opportunities present. But I have to stay within those confines. Maybe I’ll find down the road that I have better luck with one currency than another. But, there’s many reasons why I have to do it this way. But the biggest reason is to be able to keep track of these basket of trades that I do (7 pairs at a time).

So, let’s take that example again.
The USD.
This is a complete currency trade. Aka…a basket of (USD) trades. 7 of them. Well, I need to put on some kind of position size on each of those 7 pairs. Right? Well, I’m putting on 20,000 units of size. On each pair.
This is what the Position Size Calculator shows. For 1 USD pair (USD/JPY)

2020-08-06_11-35-39
Even though I don’t have a stop loss, or a take profit, I still need to have some kind of travel I want the pair to demonstrate. And, for me, that would be around 100 pips. Of a stop loss, and a take profit. If this pair would travel around 100 pips, to the positive, I would be pretty close to taking profit. And if it travels around 100 pips to the negative, then I would be switching directions.

Anyway. On the right side, up there, shows what 20,000 units of a position size looks like, of a notation. Their all the same thing. You can call it 20k

  • units
  • lots
  • mini lots
  • micro lots

I think it’s in MT4/5 where they make you use the .20 terminology. Which will actually be how many actual lots. One lot is really 100,000 units. So, only 20,000 units will be equal to .20 lots. Right?

And here is the Pip Value Calculator


So, if you would want to know what one pip of a travel equals, it’s $1.89 for every pip it goes. On this particular pair.

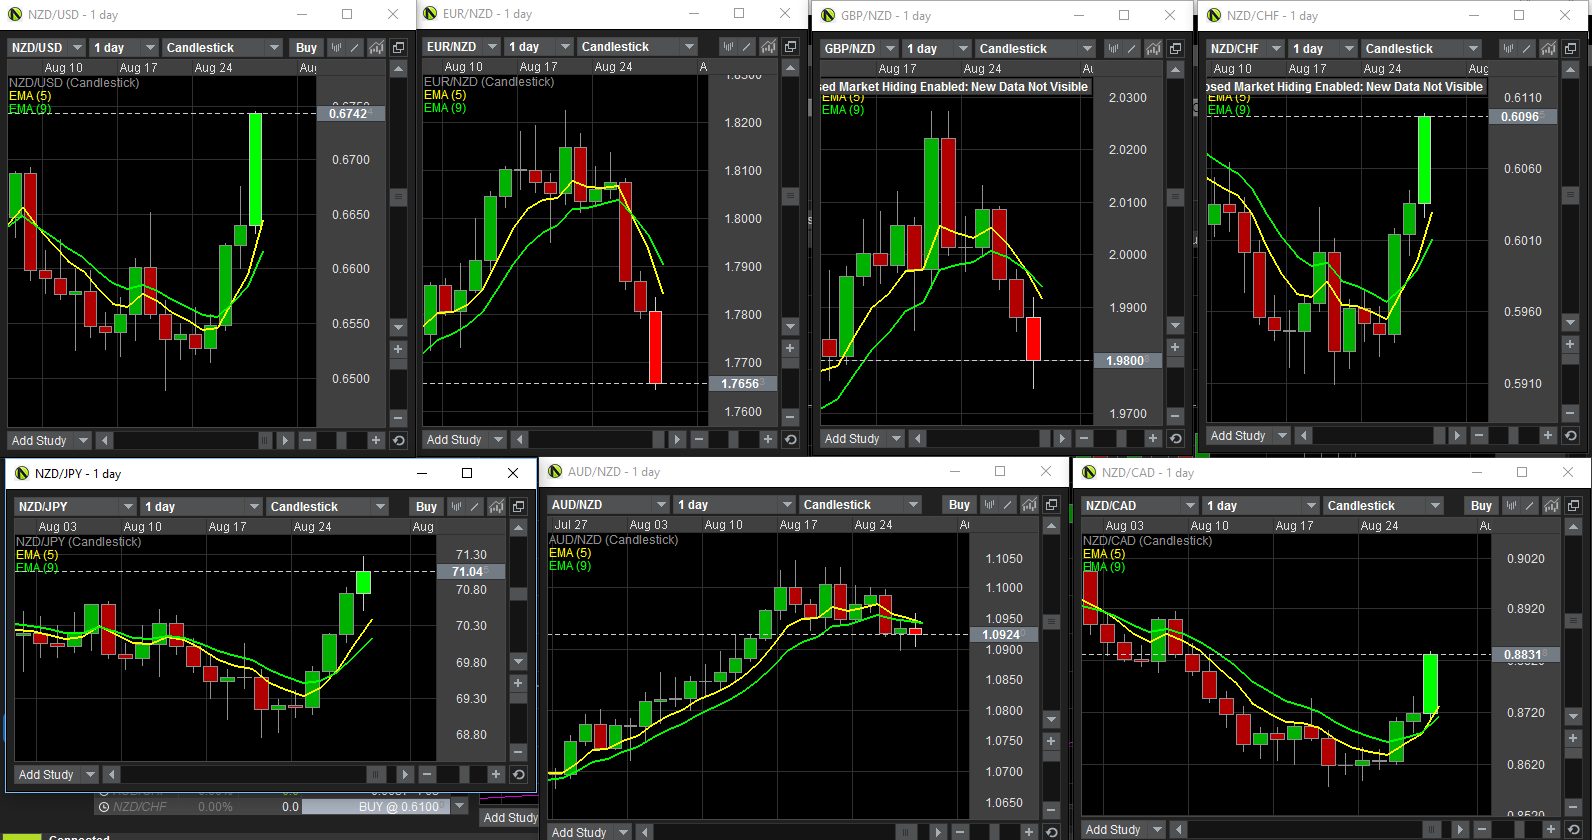
I guess you won’t understand how this type of trading (basket of trades) actually turns out, unless you’ve tried it. I’m telling you, the dynamics are something to get used to.

On your account, you will have 7 USD pairs running at the same time. With 20k units on each pair. So, your account balance will be going all over the place. But…that’s exactly what I am looking at.

The account balance.

It’s the net outcome of what 7 pairs are doing. It’s not what one pair is doing. It’s what all 7 are doing. 4 pairs can be going strong, and 3 pairs can be going weak.

All I can say is that unless you’ve tried it, you won’t understand. I remember when I first traded this way. Probably around 5 years ago or so. The swings that can occur are really something. There’s a particular dynamic that takes a lot of getting used to. Trust me. It’s not even close to what one pair does.

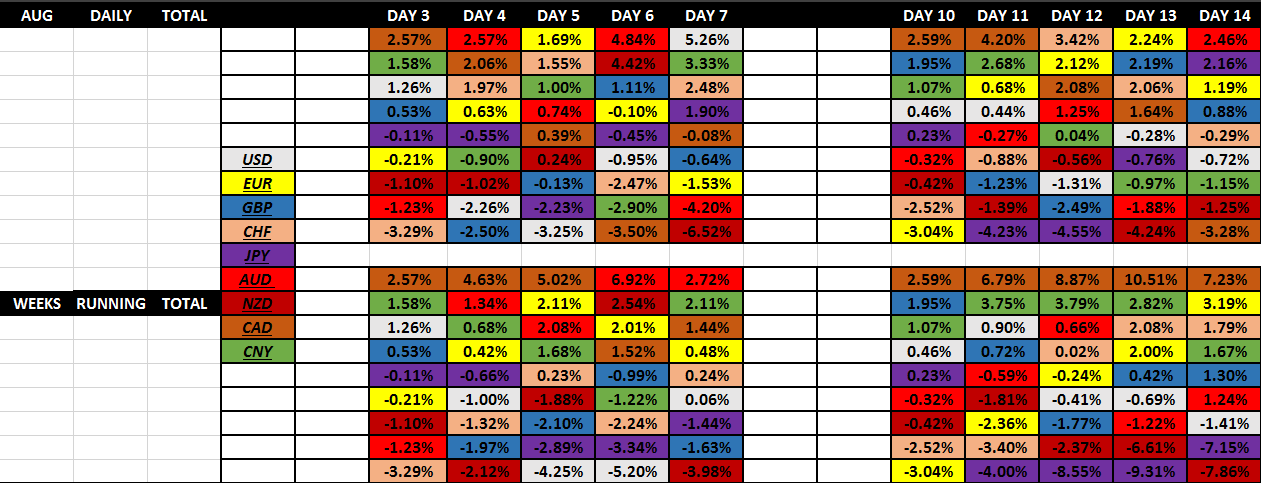
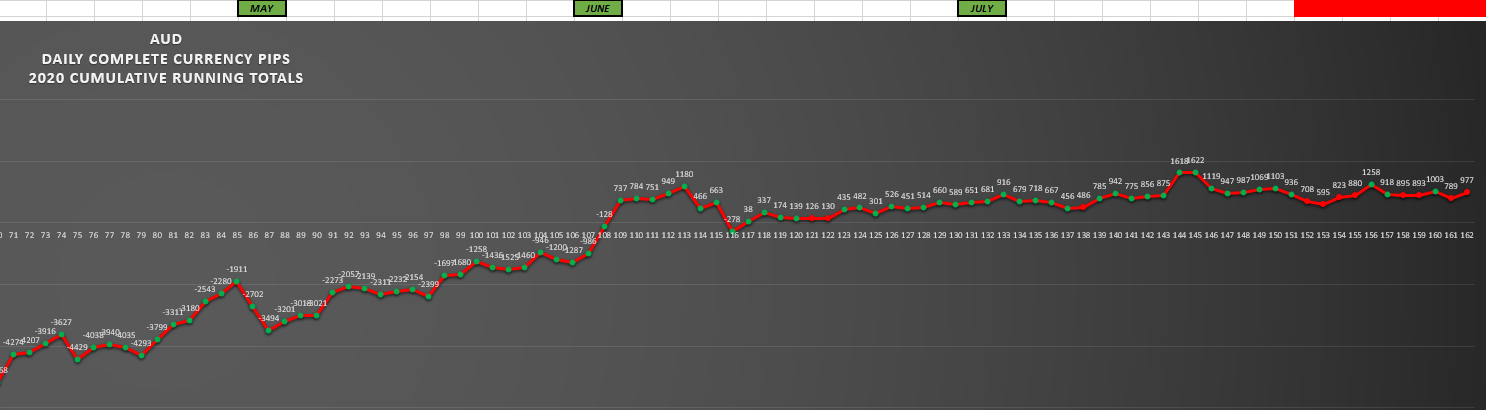
Look. This is how I see the market. In aggregate. Meaning, the total sum of all the parts.
It’s how I track the market. As complete currencies.

Oh, but let me back it up a little. To finish a trade of mine.

A trade runs until it hits a take profit place. Which will simply be a level of where my account balance gets to. If it reaches the amount, then I jump. Manually. And of course, I have to be awake for it to happen. No automatic amounts on each of the 7 pairs. Nope. It’s the aggregate amount, remember? I’m not gonna know who outdoes who when it comes to the 7 particular pairs. What I want is a specified amount of increase, of my account balance.

Well, when my account increases 49% of that particular account balance (10K), or 6.12% of the total account balance (80K), that’s when I will exit out of my trade. It’s not the where. I should throw this up there again.

2020-08-04_16-14-44
Presently, I’m in 3 trades. I won’t touch it until the T.P. Point is reached. Which will be $14,900 of an account balance. That’s all I’m doing, is letting these ride until the account balance is reached. It could be days. But you’ll see how it all plays out as I update it.

Look. This is just how I do it. It fits. It’s the only way I will trade.
And it all originated back when I came across the best thread that ever got posted.

Now that thread explains a whole lot on how to trade a basket of trades. I even think Clint tries to explain the risk reward dynamics of basket trading. It’s almost impossible to do. I think that was his final estimation about that. Anyway.

Mondeo…What else can I say?
If you are trying to understand the way I trade, I would suggest you read that thread. At least you’ll definitely see where the roots of my trading originate from. This is just my version of the way MasterGunner traded. That’s all.

Alright.
Let me know if I can answer any other questions.
Thanks.
Mike

Good morning Journal.

I just got done finishing up the numbers. And that’ll be a week. Very interesting, as always.

Well, how do I want to go about this? I guess since it’s still fresh in my head now, I’ll tell you what I think. And then I’ll tie in my running trades to what the market is doing. Will I change anything? shrug We’ll have to see.

Let’s see. What was the frame of mind we were in this time last week?
And how did the week turn out?

It was the first week of the month.
Everyone getting positioned for NFP Friday.

Let me back it up a little. See. When I talk about the beginning of the month, that kind of means something. Cause, if there’s one thing I’ve picked up on (due to tracking & following the market closely) it’s the fact that trends tend to change around the turnover of a month. It actually coincides with the end of month profit taking. Makes sense right? And then the NFP event is soon to follow. So, just know that trends can get skewed up around this time period. Or change completely.

So. We had some severe USD selling going on last month. Some huge EUR buying. Actually, a lot of European currency buying across the board (3 of them). And to put some more completeness to it, the Comms were starting to fall apart.

I did say that last weekend, didn’t I.
Well, let’s get to looking at how the week went.

  • CAD very strong in the first 2 days of the week
  • USD quite strong on Monday, fell out of favor big time the next 3 days
  • AUD started the week off very weak, only to boost much higher after. Their the complete opposite of the USD.
  • Nothing mentionable about the movements of the European currencies.
  • NFP Friday turns back the flow. Safe haven buying currencies took all of the demand.

Well, that’s the story of how they all are relating to one another. In the end, the USD broke even. That +5.26% on Friday is quite high. This is almost deja vue. Remember last Friday’s boost, of the USD?

How about another perspective on them.
2020-08-08_09-12-30
All you need to know is this chart is the combined 7 USD pairs into one. It’s the aggregate pip movement of all of the USD pairs (YTD running).
Last Friday ended on the number -772.
Here’s how the week unraveled. Pip wise, per currency.
2020-08-08_09-19-36
Those are the actual combined pips per each currency last week.
See, I kind of need to know this, cause I trade complete currencies. This is the outcome of my trades. Well, in pips anyway.

So. It’s like I’m gonna ask the same question. Again. Is the USD trying to change it’s trend?

Well, my answer is the same. I honestly don’t know. But, I do have my money on it. If you would have asked me during the week, it wasn’t looking too good. Right? Well, I had in mind everything hinging on what NFP was gonna result in. And as you can see, I’m not changing anything on my long USD complete currency trade. The only change I would (could) make is the direction. I’m sticking to it.

Well, I guess I already transitioned into what’s going on with my trades. Let’s see all my trades.


That’s the USD trade.

Here’s the JPY trade.

Here’s the CAD trade.

If you remember, I finally got my positon sizing straightened out by the time I got to trading the CAD. I didn’t have to put 2 10k sizes on, just one 20k size on each (unlike the other 2 above).

Here’s the master account.
2020-08-08_11-24-30

Ok. Well, this will be the last time I do that. It’s just pointless. I’m not gonna be adding up everything every single week. It’s stupid.

My trades run, and run, and run. Days at a time. I do nothing. Just sit back and, well, just monitor what’s going on, like the daily numbers. That’s all.

I’m only gonna monitor who I’m in with, and in which direction. If I make any changes to one of those 2 things, then I’ll come in here and make it known. The money part shouldn’t matter, unless I close out a trade.

Speaking of that, I’m contemplating getting in another currency. Especially after I did the numbers. It’s kind of jumping out at me. Can you guess which one?

Well, maybe I’ll keep it a secret. Until I do. If I do.
I don’t know. I got to think about it this weekend.
Remember, if I get in a trade, I’m staying in. I will be committed. My trade will only expire when I take profit. It’s that simple. So…I can’t be too careless when I pull the trigger.

I tell ya.
I dare anyone to follow, mimic, copy, how I trade. Especially on demo. Just do the same thing I do. Watch what happens.

It’s not the entry that matters. Whatsoever. It’s the exit that counts. It’s so easy that it shouldn’t even be called trading. I’m not playing that silly, stupid game of :

  • When should I get in
  • Where should I get in
  • Why should I get in
  • Where should I get out
  • When should I get out

Nonsense.

Just stay in. Be patient. Let the sucker ride and see where it goes.
I keep track of what’s going on in the market. If I think the direction should change, I’ll let it be known. Other than that, it’ll only be a matter of taking profit. For a decent amount.

I’m not putting all my eggs in one basket either. I’ll lose some. I’ll win some. Manage my money the best I can. That’s all.

Alright Journal.
See ya next time.
Mike

1 Like

Hey Journal.

Well, I told you I would. And here we go. Got another change.
In fact, I think I mentioned I might come in here and tell you about another trade that I might get in to. I did think about it a lot this weekend. Didn’t bite. Until now.

Just got done, well almost, with the daily numbers. And when I came across their results, yeah, I’m definitely in now. Like, urgency.

Completed my transaction at 6:29pm this evening.

AUD

  • Bear (short)
  • 20,000 units
  • All 7 pairs, of course

I won’t touch this trade until a take profit is reached.
Let the games begin.

Here’s the latest.

2020-08-10_18-33-33

See ya Journal.
Mike

Hey Journal.

Got some trading decisions going on.
I had to make some changes. I’m just gonna go with what worked for me before. It’s the 10% point.

This has been tough for me to figure out, because of the separate account balances for each currency. I was torn between what the total account balance would look like, as opposed to what my individual balances did. Anyway. I’m sticking with what I had success with just last month. I’ll just have to see, down the road, what my total account balance will turn out to be.

Well, out of the 4 currencies I had running, one of them took profit. Given I don’t have any set take profits (or even stop losses), I check in on them from time to time. Need to know the status. Well, I knew one was getting close. Man…this week…if anyone has been paying attention, you would’ve known about this one.

The CAD

So, it hit my 10% mark. This is what I was used to doing. It’s such a good time to take the profits off. And reconsider what to do next. Take a look.

2020-08-12_15-21-54
This is what I seen. And this tells me time to jump. I took this pic moments before I exited out of everything.
And this is what it looked like on the charts. Except the USD. I started exiting, and then caught myself. Take the picture first! So that’s why I’m not in the USD/CAD pair here.


Boy, I messed up with one of these pairs. The CAD/CHF one. I was in going the wrong way. All this time too! Until yesterday. That’s when I seen this mistake. Well, I just exited it and came back in going the other way (north). Anyway. The CAD is on a roll.

And that’s why I immediately got back in with this currency. I mean, it was only yesterday, that my numbers put them in a bull market, for the first time. Boy…I caught this one quite early. So, until I see a change, I’m still long with them. Now with a larger size on each pair.


The first table is the take profit status. Then the second table, on the right, is the status after I got back in with them.

Well, I got to run. It’s 5pm.
Here’s what my other 3 pairs are up to. Not all that great, but I’m committed. I’ll talk about them more on the weekend.

2020-08-12_15-34-09

2020-08-12_15-34-50

2020-08-12_15-35-27

See ya next time.
Mike

Good morning Journal.

How about some analysis.
I’m gonna try to put some context to what the market has been doing. And I think the best way to do that would be to pick up where we were last weekend at this time.

  • NFP Friday just ended, coming out of that with a seemingly strong USD
  • Safe havens seem to be waiting on the sidelines to get strong
  • The AUD and the NZD have demonstrated much divergence. The first is strong, and the second is weak. This isn’t normal.

I can’t boil it down any further than that. NFP ended with a strong Dollar. So, let’s see how this week panned out.


The bottom table is the running total for each week.
Well, if you ask me, the biggest story this week goes to the CAD. There was more buying of the CAD than anything else that happened.

Ok. Maybe there is another big story. The NZD. There’s definitely more selling of the NZD than anything else. In fact, that’ll be 2 weeks in a row. Therefore, I think that’s more headline news than anything else.

More importantly, the divergence between the AUD and the NZD is quite amazing. I’m telling you, there’s some serious divergence happening. The thing is, moving forward, they normally come back together. And so, it can go one of two ways. The AUD will get sold off real good, or the NZD will get bought up real good. All I can say is, this can be an edge to take advantage of. But you have to pay attention and somehow be able to see it.

Well, if you compare them two, you should be able to see that the AUD has been toggling between bull and bear markets (red, green dots). But not the NZD. Their direction is quite clear.

Man, I should do a study on these 2. Divergence, convergence states. I have the data, therefore, I can prove that this exits. We’ll see.

So, let’s back it up a little. And continue on with what the safe havens are up to. Are they catching a bid? Every since NFP Friday?
Well look. Absolutely not. The JPY ended the week being the second most sold off currency (-7.15%). That’s just as bad as the NZD, huh?

Other than that, nothing real earth shattering. I’ll put up something for next weekend, at this time, to look at. A summary of this past week.

  • CAD bought up a lot this week, with profit taking happening on Fri. Having a very good month so far. Will this continue?
  • No love for the safe haven currencies this month, running. USD, JPY. It’s just not happening.
  • EUR seems to be coming back to life again.

This is what the month running looks like.

I don’t know, I still think the AUD is gonna come crashing down to the NZD.

Hey…I’ll eat my words, no problem. But that’s just what I think.
There is one thing, though, that we can be sure of. I will come back in here afterwards, and show you what happens.

Alright Journal.
See ya next time.
Mike

Can I see any trades you took/trade set-up?

Good morning Journal.

How about some market analysis. I’ll just continue from where we left off last weekend at this time. Let’s see what’s been going on.

This weekend I will put up my latest running trades, status.

Well, this was last weekend.

Well, let’s look at it.


Top table is what happened in a day, individually.
Bottom table is the weeks running percentage.

For the week:

  • JPY most bid currency +5.02%
  • CAD just under them +4.46%
  • EUR most sold currency -4.32%
  • CHF next most sold -3.56%

The USD had an interesting week. Started out the first 2 days the weakest, most sold currency. Until Wednesday. They had their meeting minutes and the talk from Powell. I watched it. Just seems like a lot of the same talk. So, it seems like that was used as a catalyst to get the USD higher. But how did the USD end, since then? Well, it retraced the next day (half way), then boosted higher on Friday.

Look. The USD does not track as easily as the other currencies. That’s something I’ve noticed about them, over the years. I’m sure it’s because the worlds reserve currency is being used for many, many different things. Which doesn’t necessarily follow a trend track. We kind of have to watch it on a broader time frame. So, just know that it prefers more of a back and forth track than what the others depict. It makes sense. You wouldn’t want an unstable Dollar as the most important currency. Right?

But, check out the JPY alongside the USD, their relationship (purple & white). They normally run together (convergence). On Mon, what a divergence. JPY higher, USD lower. In fact, as I’m looking at each day, they are quite the opposite of each other. That’s not the normal. It was only on Friday that they had a normal day. But this week, the JPY was trecking higher. And that’s what the USD ended up doing. So…what can we say? Did the USD follow the JPY higher? Or was it the JPY following the USD after Wednesday, higher?

Anyway. I can go on about this. In any case, I’m still working on coming up with a convergence/divergence trade. Meaning, I would want a strategy that takes advantage of this market dynamic. Trust me, I do have this written down, but I need to get to working on it. I got some backtesting and analyzing to do. It’s a premise I want to explore. It’s an opportunity I think the market shows every know and then. That’s all.

Back to what happened.
The CAD is still on their run. That’s continuing, as I’ve been mentioning it. Also trading it. And I’m not too exactly sure why, fundamentally. Hey…speaking of convergence/divergence dynamics. The CAD and the USD track similarly. I’ve mentioned this before. Trust me, I have the data that proves it. So, to me, it’s not a huge surprise to see, all 3, running on the high side lately (USD,JPY,CAD). In fact, that’s why I’m in all 3 of those (complete currency) trades.

Here’s this months look.

No real difference in the line up, from last weekend. But, you do have to look at the numbers (inside). The JPY has come up (from a running -8.59% last weekend at this time, to a -3.57% running now). The USD down a little bit more. The AUD is slipping away.

Well Journal, I got to run.
I’ll come back later on.
I do have much going on around here, trading wise.
Mike

Hey Journal.

Alright. What’s up with my trades?
I’m in 4 trades. And I got a story to tell (about what happened this week).

My CAD trade (long).


I’ve been riding them for a while now. Initially got in with them on Aug 4th. My take profit hit on the 12th. Then immediately got back in with them again (with higher lot sizes). So, this is what’s been continuing since then. BTW…this has all been documented in here, on those dates.
So far so good. No plans on touching this, until the next take profit place.

My JPY trade (long).


This has been very slow going. Got into them on Aug 2nd. Believe me, I’ve seen quite a drop to my account balance, at one point (8k). But, I’m not budging on this one. I am proud of myself for sticking with it, though. It hasn’t been easy.
And also no plans on this either. Just letting it ride. Wanting to see a take profit…sometime this month, or even next month.

My AUD trade (short).


This has been like pulling teeth also. Not really getting anywhere, well, until recently. Again, like the Yen, just now starting to do something. Got into it on the 10th of this month.
Also, no plans with this one. Just letting it ride until I get to my take profit target. Or a major reversal of a trend.

And speaking of that very thing…Let’s look at my USD trade.
This is my story. This week.

Every end of day comes. I run the numbers. And I kind of have an idea of what to expect, cause I keep in touch with what the market is up to throughout the day. Some days better than others though. Well, Monday comes and goes. And my USD is not going all that well. This is the way it looks.

2020-08-22_17-27-38
All this is, is the USD 7 pairs’ pips all added up. It’s the aggregate net amount of pips, per day. These are the YTD running totals. Well, look back to the -772 dot. That’s about 12 days ago. That’s where my USD trade got started (Aug 1st). Now for the latest. This is what Monday EOD looked like. -1153. Yeah. The Dollar lost -242 pips all totaled up that day (1153-911= -242). Not good. So, what’s the trend looking like?
Well, the stated trend is actually a bear market (red dots). And it’s been moving down, right? A couple times there this month it has shown a possibility of changing (move up).

I’m starting to wonder if I should change directions. Well, my decision is to stick it out. Let’s give it some more time. Like my JPY trade. Actually, due to them 2 trading dynamics, I’m sticking with the USD long because my JPY trade is starting to move up. I am hating the fact of this looking like a bear market becoming more bear. Know what I mean?

Let’s see what the next day looks like.
2020-08-22_17-28-15
The aggregate pip count is -398 pips. And this is what it looks like. Man…when I seen this…I was like…time to jump. I have to switch directions. Their all right. The USD is going down the tubes. No more countertrend playing for me.

So, I exited my 7 USD long trades. Then immediately got back in with them going short USD. With a lesser position sizing. I mean…it’s a bear market! Right?

Ok. Let’s move on. Wednesday comes and goes. End of day numbers come out. This is what it looked like.
2020-08-22_17-29-00
Now the aggregate pip count turns out to be +566 pips.
Figures.
Right?
Now what?
Well, my thinking was this. I’m deciding on going back to my original plan. I accepted the fact that I made a mistake yesterday. Look. This doesn’t necessarily mean that the trend will all of a sudden turn bull any time soon. I could just ride it out and be committed to this play (short). So, I had to choose between those 2 sentiments.

  • Go with my original plan
  • Stay short until a verified bull market presents itself (like to see some green dots, and a slope upwards)

Like I said, I chose the former. See. The JPY was moving higher this week. Those 2 ride together. I made a mistake. And I corrected it. Therefore, at that Wed EOD, I exited out of my USD short trades and immediately got back in going north. With adjusted position sizing (smaller). And I’m sticking with it. This is what it looked like the next day.


The USD aggregate pip count was a - 262 pips. Back on down.
Well, I don’t care at this point. I have to be committed, at least for a few more days anyway. I’m not changing anything so soon. I’ll ride the week out. And see how the JPY fares.

2020-08-22_17-30-20
Friday’s results. Back on the up.
Well, I have to stick with my original long bias plan.
Sure, I lost a good bit. That’s the game. Can’t win them all.

That’s what my USD trading account balance looks like. Not good. I started the month out (actually all 8 of them) with 10k. Life goes on.

This summarizes all of my trades.
2020-08-22_16-51-25
Don’t mind my USD account. Yes. I messed it all up. Royally. But I’m still gonna keep with the entry date of Aug 2nd.

Well, up to this point, I don’t have any other things on my horizon. Like the 4 other currencies.

When I see, feel, sense something. You’ll be the first to know. I’m just gonna stick with these 4 complete currencies for now. I’m still, kinda, waiting for the other foot to drop. The S&P has retraced 100% to it’s all time high. Unbelievable. Maybe now would be a good time to see another fall. That would bode well for me. Risk-off (safe havens) would gain. And risk-on currencies would fall.

We’ll see.

Alright Journal.
See ya next time.
Mike

1 Like

Good morning Journal.

What a week it has been. Let’s see what happened.
But first, we need to know what we were thinking last week at this time.

Well, heading into the final week of the month, this is what we were looking at.

  • CAD charging the way being the most bought currency
  • NZD being the most sold off currency for the month
  • Safe havens being sold more than anything else

Although, this was the summary for last week.

Honestly, it kind of seemed like the JPY wanted to gain some steam, going into this week.
But what about the USD?

Sure, I guess you could make the case for it to want to go higher (probably cause I was wanting it to). But the truth was they just had a couple good days. No real momentum was going for the Dollar.

Ok. Let’s take a look at what happened.


The top tables are the daily individual results for that day, by itself.
The bottom, is the weekly running results. And by that we can see that the NZD was the most bought currency for the week (+15.81%). And who was the most sold off currency? The USD. -11.31%

Take a good look at what happened. In my mind, we had a major change take place this week (remember how we were being led up to the week…explained above).

It’s the NZD.

Ok. Well. Someone could say that it’s the last day of the month. And all we had was some good profit taking. Ok. Yeah. Good point. It could all well be just that. We all know how bad they’ve been selling off lately. So. That’s nice. But, could anything else be happening? Like a real change in their trend? Well, we would need to take a closer look at the NZD. And this is what we want to keep in mind.

  • Is the NZD changing from a bear trend to a bull trend?
  • Or is this simply end of month profit taking?


This is their aggregate amount of pips. The YTD running total. This is how they fare when you add up all the 7 NZD pairs. In pips. Daily.
They’ve been in a stated bear market since the end of July (red dots on their line). And you can see the momentum (sloped down). Until recently.
Oh, and by the way. I wonder how many people have noticed (in hindsight of course) what the daily results were for last Friday. Look up there at the table. When I think about this, I definitely think that this was some kind of indication of what the NZD wanted to do. Remember, it’s only in hindsight that we can say this. I just wonder if on the 20th was their last real drop. And it begins on the 21st. Monday and Tuesday was the calm before the storm. Cause Wednesday on out is nothing but NZD buying. The numbers don’t lie. The consensus took hold.

Let’s get another perspective on the NZD.


The AUD on the left, the NZD on the right. This is how their trends compare with the other 7 currencies. If it’s green, it’s a bull trend. If it’s red, bear. This is their stated trend, the way I have calculated it. Anyway.
The NZD.
Last weekend, they were a stated bear trend against every other currency. Therefore, (on the right) is their aggregate trend determination (bear). Also the strength of it, the number inside. So, they sat with being a bear market, with a strength of 203. BTW…7-0 means 7 bear - 0 bull.

Basically, you can see the progression of how they went from that to a full blown bull market. The aggregate and also the individual parts.


You can see by the end of the week how on each pair the 5ema line crossed over the 9ema line, signifying their bull market. And that’s the only thing my table is stating. In pips.
You can see how the EUR/NZD pair is the most bullish. 60 pips in between those 5 & 9 lines.

Well, you have to look, but there’s a lot of information on that table. It tells you how much stronger the NZD is against each of the other currencies. And like I just mentioned, the most against the EUR.

And one more thing. The singled out numbers on the right, tell you how many pips the NZD came out with for that particular day (aggregate total). And well, add them up for the week.

  • Monday -71
  • Tuesday -37
  • Wednesday +676
  • Thursday +234
  • Friday +558

If you traded the NZD as a complete currency (having all 7 pairs running), long this week, you would have netted 1,360 pips.

I mean, who would have known? I surely didn’t see it coming. Who would have guessed that on that last Friday the NZD gave us a clue. Well, that’s the only thing I can possibly think of. Maybe, maybe not.

Anyway. Let’s get back to answering the question again. Profit taking? Or a definite change in trend?
Here’s the latest month running.

Well, you can clearly see the change here. Both the AUD and the NZD have risen up a whole lot, in comparison to the others.

I’m gonna go on record and say that I think the NZD has changed to a bull market, for a good length of time. I mean, it wasn’t just one day of profit taking, this week. It was the final 3 days. Therefore, I think it was a combination of profit taking and a formidable trend change. Also the AUD is following suit. It only makes sense.

Another thing to note…is the CAD. On Thursday, I was definitely thinking that the CAD was joining the other 2 Comms. But because of the results of what happened on Friday, makes me think otherwise. The CAD was following the USD. Not the Comms. I think that trio is no longer. Man…I remember when they all were so tight! Not anymore. Go back to the first table, daily results. Compare the CAD (brown) to the other 2 Comms on Thursday. And then compare them to the USD (white) on Friday. It’s quite clear who they really want to follow. (traitor)

And do I need to mention about the USD (don’t really want to)? Their in a bear market. Plain and simple.

Well, I’m gonna be making some trading changes. This was not a good month for me. I know where I’ve been going wrong. Gotta go back to my roots. Running out of time right now, but I plan on coming back this weekend and explaining what’s wrong with my trading. And what I plan on doing about it.

Alright Journal.
See ya little later.
Mike

Hi Mike,
I really appreciate you posting this trading journal. It is fascinating. Well done, and keep it up please.

1 Like

Good morning Journal.

Let’s talk.
Yeah, I’ve been making some mistakes lately.
Isn’t it interesting how a little tweek here and there gets you off the path, down the road? You end up finding yourself where you don’t want to be. Then you have to go back and find out where you went wrong. I mean, realistically, you can’t throw out the baby with the bath water. Some things work (in your trading), but some things don’t. It’s like, you have to go back and remember those “ah ha” moments.

Well, I want to talk about something…in particular. This has to be one of the most fundamental aspects of trading, in my opinion. Look. I realize that I might be way out there on this. Like…way out there. Surely I’ll get the “Mike…you’re over thinking it”. talk.

Maybe.
Maybe not.
Let’s find out.

I’ve always said, “If you can truly get to the bottom of knowing why you did whatever trading actions you did, then you’ve really discovered something incredible”.

See. Only after we realize some truth about ourselves, are we then able to make a real change. Cause if you don’t understand why you did something then you’re surely not gonna be able to fix it, if it’s broken.

I believe every trading decision we make will ends up being found in one of two core motivations. Here they are.

  • Speculation
  • Follow

Speculation - A conclusion or opinion reached by such contemplation
-Conjectural consideration of a matter; conjecture or surmise
-Conjecture = the formation or expression of an opinion or theory without sufficient evidence for proof

Follow - To keep up with and understand (an argument, story, etc)
-To watch the development of or keep up with: (to follow the news)
-To watch the movements, progress, or course of: (to follow a bird in flight)

Let me reiterate. I could be wrong. This all could be nothing but nonsense, meaningless, and pointless to even bring up. But, in my mind, the way I see where my trading decisions come from, can be fundamentally derived from one or the other.

For the record, I believe that my trading decisions need to come from a direct relationship from something that I am following. Precisely the market.

Need to start with asking WHY?, and finish with the motivation.

Speculation derived answers entail reasons. Many possibly good, bad, nonetheless specific reasons. Which then leads to “this is what I think.” Which then leads to “this is what I hope.”

Following derived answers entail more of an action/reaction response. You see something therefore you do something. It’s the mechanical ideology behind it. That’s why we have indicators, triggers, things to make us do something in particular.

Maybe all this simply has it’s roots in either being a mechanical trader as opposed to being a discretionary trader.

Ok. I’ll buy that. I’m just framing it in my own way.

Well, this is where I need to start, with my trading. And lately (this month) I’ve been speculating and not following. So…I have to change.

I had a good plan earlier this year. I believe the theory was pretty close. To being perfect, that is. But it’s a difficult thing. That’s what I’ve been up to lately.

Let me preface all this with the fact that I’m a perfectionist. I’ve known this about myself for a very long time. You know…borderline OCD like. Feeling incredible when you’ve accomplished a great thing. “Being perfect like my heavenly Father is perfect.” (Matt. 5:48) Things like that. I just won’t stop till the end.

That’s nice. I know.
Anyway.
I want to start explaining what I’ve been looking at, pondering, in amazement about, lately. I think it’s interesting stuff.

So, I’ll get this talking stuff out of the way, and come right back with the market stuff.

I’m on it.
Mike

Journal.
Here we go.

Want to know what’s fascinating? I’ll show you what’s fascinating.


This is the USD, complete currency stats. Complete currency = having all 7 USD pairs open and running at the same time. Same direction.
The bottom row going across is the YTD running amount of pips.
The second bottom (just above it) row is that particular days amount of pips, trading this complete currency.
The red signifies the USD is in a bear market. And inside the red is the strength of that trend (the higher the number the stronger that trend).
The 7-0 number means the USD is bear against all the other 7 currencies. So, the first # is how many they are in a bear market, the second # is how many they are in a bull market. Always adds up to 7.

If I would have traded the USD as a complete currency for the month of August, what would have been the outcome? Short.

  • 10935 - 8954 = 1,981 pips

If I would have traded the USD as a complete currency for the last 2 months, what would have been the outcome? Short.

  • 10935 - 6731 = 4,205 pips

Do you know how hard this would have been?

Not hard at all.

My only trading actions would be this. Follow me.
Enter July 1st with 7 USD pairs, long. Why long? Cause what does it show up there? Green. Right? It’s a bull market, at End Of Day June 30th. I follow that indicator, for the direction.

July 1st comes, end of day results were still in a bull market. So no changes. Resulting pips was -172. Ok. I do nothing. Then next day comes (July 2nd). End of day results show the USD turns into a bear market. Ok. That means I must switch directions. That entails exiting out of my long positions and immediately re entering in (all 7 USD pairs) going short. The pip results were -50 pips that day. No biggie.

Now I’m short USD. In all 7 USD pairs. Letting them run. Each and every day comes and goes. And what happens? Well, no changes. Their stated bear trend doesn’t change. That means I do nothing. Like…absolutely nothing for this whole entire 2 months worth. It’s just riding, and life is completely boring. But the results aren’t.

What am I doing here? Just following the stated market, which does not indicate any changes. Well, you get the point. And I do find this fascinating. There’s 2 points here. The benefits of following, and the dynamics of a trend.

Go ahead ask me. Am I speculating here, or following? I did throw out many reasons why I did speculate and thought that the USD was gonna start moving into a bull market status. I was wrong. You know what? I’m not proud. Maybe you will remember some of this. Here’s some kind of time line of what I decided to do what I did.

So, you get the point. I had all kind of reasons to support why I went long USD. And as you see up there, I even jumped out and switched from long to short. For one day though. Then decided to stick with my losing mentality of a strategy. Went back to long USD trades. And there hasn’t been any changes since then. We should all know by now that the USD has basically died. It never turned up to a bull market.

NEVER!

And what’s my lesson here? Well, like I’ve been saying all morning long. It should be better to follow than speculate. And I just got done showing you some results of what would have happened if I would have simply followed. For this last month. And even the last 2 months.

Anyway. I’m moving on.
I do believe this notion of following a trend has some real credence.

But the market doesn’t always present itself this way.
Let me cut this short and come back with the other point I want to make.

On it.
Mike

1 Like

I have been doing the same thing since the market turned around in March. It is something I’ve had a problem shaking. Maybe because my first year and a half USD was bull all the time? It has just been ingrained into my brain and has gotten me into trouble more than once.

Then that little voice whispers “it can’t go down forever”. Dangerous words indeed.

Wise words.

1 Like

Journal.

I’m gonna make the point of how the market makes it difficult. This is the downside of the way I follow the trend.

So, let’s take another example. How about the NZD? They’ve been doing some extremes lately, right? Well, how does it look regarding them?


They were in a bull market back in July. But that took a few days to really change around the middle of the month. Then it stayed bear until a couple days ago. So, what kind of results are we looking at here. How about for the month of August.

NZD short.

  • 6381 - 5062 = 1,319 - 234 = 1,085 pips

Follow me. 6381 is the last running total amount of pips (Aug 28th). Minus what end of day July 31st is (5062) equals 1,319. All that is the ending minus the beginning. Or you can simply add up each days amounts (in the row just above that). Ok. We have one more thing to deal with. Why the -234 number? Well, the stated trend changed. This is how it works.

End of day August 27th comes. Wow. Their trend changes from bear to bull market. Well, the pip results ended up being 234 pips to the positive. And since we were going short, that would mean, then, negative 234 pips to the running total. Right? We will not know this until the day is over. Not beforehand. Which means it’s at this time that we will change directions.

That’s nice. Let’s see what the previous month would have been.

  • 5062 - 3372 = 1,690

Then to deal with the trend changes pip results. These are highlighted in dark blue.

  • -192, -240, -181 = 613 pips
  • Therefore, 1,690 - 613 = 1,077 pips

Ok. Not bad at all. Just over 1K pips for each month. Seems like easy money to me. I mean, what are we doing here? Like, not much at all. Just following what the trend turns out to be, at the end of the day.

But we all know what the nemesis is for trend following, right? It’s when the market ranges. Or consolidates (same thing). It’s the back and forth movement it does, in which we just don’t know where it will end up. Continuing the trend? Or reversing trends? This has plagued traders since the beginning of time. It’s all about if & when the trend changes. Right? I mean, this is dealt with on every single trend following strategy out there. Some strategies are trying to catch the tops or bottoms…of what…the trend. Some strategies look for a break and retest of a trend, via a level on the chart. Some, getting in on the momentum of a trend. How about fractals? That’s just the visual representation of the candlesticks shown that convey what the trend is. We also got the indicators (thousands of them) that will tell us when something is trending or ranging. How about using that 200 moving average as a point of reference of when something is trending or not. So yeah…there are a lot out there. But we’re all trying for the same thing. For something to tell us when price will continue or change, in order to capture a profit from.

What I’ve been showing you (my method) falls under the description of :

  • From stated trend to stated trend

The hardest aspect for my system is in dealing with how the trend switches. Let me repost that pic again.


Now, tell me, how am I supposed to know that on Jul 16th the trend will stay bear? We have a double top situation here. The trend changed to bear, retraced and went back to bull, and then finally changed back to bear. For good. And look. If this always was the case, I wouldn’t have a problem. But we just don’t know if the trend will actually change. I guess I should show a situation in which is the opposite.


NZD.
Let’s follow it.
Jun 8th, at the top of a bull market, strength of 528. That’s very strong. It then comes down a whole lot to Jun 25th. Strength of 20. Still technically bull. Only bull against 2 other currencies, and bear to 5 other currencies, hence 2-5. That’s quite weak. But then what…it climbs up again. And hits another strong top of a bull market. But this time it only gets to the strength of 192. Then comes back down. Now, did it turn into a bear market? Nope. We could have easily followed this, cause it didn’t technically switch. Sure. Much patience goes into it, but the bottom line is we didn’t see a red turn around at any end of day. Right? Point being…Shouldn’t assume anything until you see it.
How about another different situation.

This months AUD.


Talk about pulling out your hair. Thanks a lot AUD.
Reminds me of a cartoon. “Duhh…which way did he go George? Which way did he go?”

Well, if you don’t already know by now, I was (am) short the AUD, for Aug. Well, let’s count them up. Result in pips. My bias is red so I get what’s stated. And if it’s green I get the opposite.
-113, -228, -57, -378, 340, 23, 2, -110, 214, -188, -269, 133, 75,151, 57, -129, -87, -165, -301, -484 = -1,514 pips
And that’s how that went. Horrible. I guess I was on the wrong side of things. And you know what? I wasn’t even playing the back and forth game!! I stuck with one way. And how many times did it change? Wayyyy to much. Well, in hindsight, the only way I would have made any money would have been to kept to a bull bias this month. Like every day. You should be able to see that the only way to have been successful with the AUD this month was a full on being stuck with long AUD. Or bull bias. I don’t know…look at the beginning of the month. Nothing tells me (here) that we’re gonna have to be bullish the AUD. The stated market is bear. Well, that’s my indicator. That’s what I am supposed to follow. For me, there’s no winning this month with them.

Like I said. It’s a killer, for trend followers, to get stuck into a ranging, consolidating market.

I did though, mitigate a lot of losses by staying one way or the other. Can you image the slippage if I would have switched every single time it stated it? Ok. Let’s find out what this number would have been, right now. It’s called the day late system. At the end of the day, I do what’s stated. Switch. Every day that it does. (I’m adding up what the white box’s state, and the opposite of what the dark blue box’s state)

  • -1,600 pips

Ok. Well, I did a tiny bit better, anyway.

Alright. You get the point. Sometimes the market makes it easy, and sometimes it doesn’t.

How about a look at what the GBP did this month.

Long the GBP this month would have netted you +511 pips.
Why so low? They didn’t switch trends, like, at all!
Well, look closely.
Look at the trend strength numbers. They were gang busters strong in the beginning of the month (400’s). But just went down from there. Ending under a hundred for the last few days. See. They technically stayed in a stated bull market, but didn’t switch over. And well, all you have to do is see their daily pip results. Look. In the middle of the month. Had a +633 pip day. Yay! Then dropped -444 pips the next. Boo! Then rockets up +765 pips! Then drops out of the sky with -832 pips! Man…that’s enough to make anyone crazy, for sure.

Well, you have to admit. There is some credence to staying in the correct trend, over the longer time frame. You would have made some money if you stayed bull GBP the whole entire month. Complete currency trading, that is. I think this is called coming out being flat (just about even).

Well, I’m gonna take a break and come back with some more stuff. The good thing is… we have an extra day of the month before the next month technically starts. I will start laying out some kind of plan. I have some idea of it. You better believe it has some following aspects to it, than speculating.

Mike

P.S. —
I’m gonna throw out here to anyone who is courageous enough to want to see some of my numbers (I used to do this on my other thread).
Someone could have fun with this. It’s my excel book of daily numbers.
But you can’t alter anything though.
MY 2020 NUMBERS.xlsx (844.4 KB)

image

I trend trade as well. What I do is, instead of trying to guess which way the price will go. you wait to see which side of the range the price breaks out of and closes at. So with this chart Im just going to wait till it closes below the consolidation instead of calling the top. It works pretty well because it signifies the end of a trend and the start of a new one.

1 Like