Good morning Journal.
Sorry Journal, just sitting here wondering what I want to talk about. And I think I got an idea. How about I kill two birds with one stone. Cause I want to do a thorough look at what the market has been up to lately. But also I want to do a normal walk-through of all my data collecting. I’m sure I probably have shown bits and pieces at various times, but I don’t think I ever went into depth into what I do.
Ok. Here we go.
I’m in the business of trading. Therefore I want to know my market. And since my market mostly has to do with relationships, I need to know how all things are relating to one another. Well, there are many different perspectives you can approach the market from, I happen to want to know what are the various time stamp versions.
Nothing means more to me than the daily result. Anything shorter than that means nothing to me. First off, the duration of my trades can run for days at a time. So why would I need to know how the intraday movement tracks? Well, there was a time when I collected the sessions results. That was in the beginning. In fact, there’s a thread in here showing how I kept track of that…like…every day. That was too much. Look. I was curious to know how things bent and turned inside of a day, but it’s a lot of work keeping track of that stuff. I think the thread was called something like Currency Dynamics.
Complete Currency Dynamics - Trading Discussion / Currencies - BabyPips.com Forex Trading Forum
There it is. I guess this is when most of my excel spreadsheet compiling methods started. Trust me, keeping track of the market via paper and pencil method took a very long time. But that’s how I started out. You wouldn’t believe how much time and effort I spent compiling all of the 8 currencies’ movements on paper. It was a lot. Hours and hours I spent every weekend, I remember. Even for me it gets exhausting. Thank goodness for excel. Whoever came up with the idea of excel is a genius. Honestly. I mean, I came from knowing nothing at all about excel, to now, needing that tool more than anything. In fact, I wouldn’t have a business if it wasn’t for excel. I guess it’s not all that smart to have such dependence on something. But it is what it is.
Ok. It’s time to get into what I do every EOD. And like I started out with, the daily time frame is my most important piece of data. But to the extent of where you can go with that is quite amazing. I’m about to show you.
This is a pic from my desktop.

For every EOD I’ll use 6 of those. I will compile all my daily numbers into that 2021 EOD numbers. A lot of stuff goes in there. I’m gonna show you. But then, after I get everything set into that, then I go right next door to the trading spreadsheet. This is where my trading metrics reside. All indicators, and documentation that I do regarding my trades will come from here. And then finally, next door to that is the historical data base. Well, it’ll be quite similar to all of what I store in the first one where all the EOD data resides, but this is the place I can go to for analysis purposes. Even for back testing. This is where a lot of work gets done. I just can’t be messing around with so many numbers at the place where I collect them all. There’s a time and a place for everything. Here’s where I can crunch, twist, play, formulate in different fashions all the historical data that I collect.
But then the 3 books directly underneath those 3 is my templets. I use these for efficiency purposes. Basically, it speeds up my time compiling the data. There are formulas set up in which all I have to do is copy and paste the new daily data. I’ve gotten smarter and lessened the amount of time that it takes to do it all, via these formulas.
Let’s move on. This is the first thing I compile. All of my %'s derive from this.


This is a birds eye view of probably the most important data I collect. Trust me, it doesn’t take long for me to get one day all filled in. Probably about 5 minutes. Max. I’m telling you, the power of excel is amazing. But all that up there is the core stuff. It’s broken down into the daily, weekly, monthly, quarterly, and yearly. I do want to go through and see what the latest is. And by that way, I’m gonna move on down the page and show it to you. Cause all of that data up there is just consolidated in a format below.
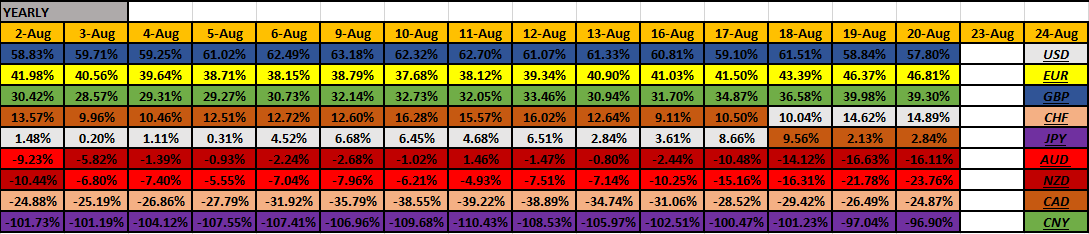
We got the %'s of how each currency has related against all of the other ones. So, when I look at this chart, this is what I’m thinking.
- European currency’s are having a good year. The GBP stronger than the EUR. And both of them are outdoing the USD. Actually by quite a bit. Therefore, I peg in my mind, that these 2 currencies are, and have been all year long, strong. This’ll probably continue on for the rest of the year, since this chart hasn’t changed much. I looked back, and the GBP has been on top since Feb. The EUR has been second since June. Before that the CAD was second. Yep, there was a time that the CAD was strong. Really strong. But not now.
I’m sorry I can’t show you the entire progression of the yearly perspective. Too long. But I got to tell you, it’s awesome to look back and see how they all changed against one another. But this is why I do this data compiling. Cause I just want to know. I always want to be able to go back and see what happened. I’m gonna take advantage of the fact that the market leaves behind footprints. Trust me.
-
The USD. To date, they are positive. Sure, lately they’ve been on a bull streak. It wasn’t always like that this year. Remember the doom and gloom talk that every analyst jumped on? Well, they’re not now are they? Nope. That subject has subsided to none existence. Actually, the USD came out of the negative values around the middle of June. So, I’m gonna say that the USD has been having a good summer.
-
Quick note about the CNY. Not that I trade them or anything, but I just got to know the sentiment. Comparison to the USD. They’re having a very good year against the Dollar. Just something to note, that’s all.
-
The CAD was having a good year, but back at about break even now. They were second and being up in the mid 30%'s back in May. For most of that month they were dominating just below the GBP.
-
The AUD, NZD are sitting negative on the year. Yeah, it’s not been going so well with them this year. I mean, you would think that after last year this would have been their year. Nope. Thanks to COVID lingering around, I think, they’re in check. Can’t get into positive territory. We very well might be in a new era. All the stock markets of the world shows a different story. New record highs. Like almost everyday! But this is strange. It has always been that when the risk on sentiment is thriving, these guys are strong also. Not this year. It’s different. And I need to know these things. This is the only way. By keeping track of 'em!
-
The CHF and the JPY. Both safe havens. And this year they both have been the favorite to sell. You would think it was a risk-on type year, with these guys on the bottom. But not really. It kind of has been a risk-on year, but the European currencies being the most preferred to buy. And these 2 being the preferred ones to sell. Also to note how the CHF has not been following the EUR. What a divergence! This is just what I sock away in my mind about this year. That’s not so normal of a relationship.
And the other thing I’m keeping in mind is regarding the JPY. All I’m doing is awaiting their lift off. I mean, they can’t stay this low forever, can they? I’m watching though. This is a real anomaly. A real extreme. But hey, if it’s a new world (cough COVID cough) then it’s a new world. I can accept that. But all I know is that if the JPY ever wants to get strong again, I want to be apart of it. I’m watching and waiting to catch that ride (if it’ll ever happen). And I’m not talking about a good couple days either. I’m talking like when everybody hops on board and rides it strong for a good length of time. I’ve seen it. I even have those days, weeks, months, documented. I can go back to the year '18. For anything daily. But hey, maybe this time is different. It’s a possibility. We’ll have to see. In the meantime, when, if, they want to turn -80%'s and higher, I’ll be in. Strong.
Ok. That’s enough year talk.
How about the latest quarter.

We’re in the middle of the 3rd quarter. And the biggest thing that catches my eye is the CHF. They’ve started out the quarter being the strongest. I even remember changing their stated trend from bear to bull. In July they were in a bear trend. In Aug I switched them to bull trend. That quarterly chart should explain why. But then look at what happens as the month of Aug unravels. They (in pink) dip down quite a bit. Good thing I am not too hasty on changing my trend determinations too quickly. Cause look what’s been happening lately. It was only in this past week that they took on strength. Like…they remembered…their strong this quarter. And that’s what happened. Went back to their bull trend. Now their the top dog. It only takes one week. This last week belonged to them.
Also, I am paying attention to the other safe haven currencies this quarter. USD, JPY. They are not the currencies that are being sold off. It’s the Comms that are. You should be able to see that 2 of the Comms (AUD,CAD) are the weakest by a lot. No comparison. But it’s a shame the NZD couldn’t come up with a rate hike. Thanks to one person who got COVID? Are you kidding me? Well, they could have changed the course of the Comms, I think, if they would have hiked their rates. But no. We have a new era, new world. The Comms are gonna be sold more than bought.
Monthly perspective.

See. And this is my point exactly. The market seen it coming. The NZD had a rate hike coming. That was due on the 18th of this month. It would have been at the very beginning of that EOD data. See how the market was buying them up? That’s the lead up. Not only them but the AUD was getting bought up also. And then what happened? Well, one person (thanks a lot) got COVID on that Tuesday the 17th. That’s when the word got out. Took the wind out of their sails, huh? And who was on the other end of that trade? The mighty USD. Actually, all the safe havens benefitted from that this past week. Those 3 took turns getting bought up.
But concerning the European currencies, they seem to skate right on by, not too much affected. Their not being sold off because of this turn of events. Remember, they’re strong this year. I don’t have that data, up above, for nothing! The market knows. And so do I.
Well, this is definitely a turn of events. The market wanted to go by way of the risk on currencies. I bet you a lot of money got stuck with their pants down. And the Comm currencies was not trending high, prior to this month. What was, then, the prevailing trend in the market before the NZD getting strong in this month of Aug?
Well, we can look at the quarterly perspective. July, Aug, Sep. What was I just explaining up above? The European currencies (EUR,GBP,CHF) all are very strong. Them mixed in with a touch of safe haven flow. We could say the majors are dominating. The USD has been having good days. The JPY has been trying to come up off the floor with some good days, not consistently though. But I would say the most telling thing is that the market went back to the CHF buying. I talked about that already. I think that’s the most correct answer to the question of where the market was heading, now that the Comms can’t convince everybody of buying them (thanks a lot NZD).
So. We know that some traders got caught with their pants down. Lost some money. But now what? I think it’s possible that they just might wait another week, after things have settled down, and try again. I don’t know…do they have money apportioned and all ready to go for the Comms? Like…will they think those currency’s are at a discount now? Cause, boy, that NZD took a real hit. Hundreds of pips lost. Honestly. Maybe they will get in on the discounted prices and ride up a long haul. I don’t know, but I think it could be possible. I’m watching for that scenario.
Well, that’s the latest narrative that I have for what’s going on in the market. Those are a lot of my thoughts. I will only trade if I see a scenario play out (on my live acct). And the one scenario I just told you I’m looking out for. The NZD to grow some legs. If they do this coming week, towards the end of the week, I’m gonna get in. See, I accept the fact that I don’t know what’s gonna happen. I’m not going to think I know something. But what I can do is envision a scenario to take place. Hey, if the NZD is a lost cause, then so be it. Won’t bother me any. I won’t touch them unless I see something big. I got to see some multiple days of buying. Also the AUD to follow. Until then, I’m content to sit on the sidelines and see market move. And do what I do best. Collect the daily data.
So yeah, let’s get back to that. I guess I got to go quite quickly. Cause we haven’t even scratched the surface on what I do on a daily basis.
This is a break down of each pairs daily pip totals.

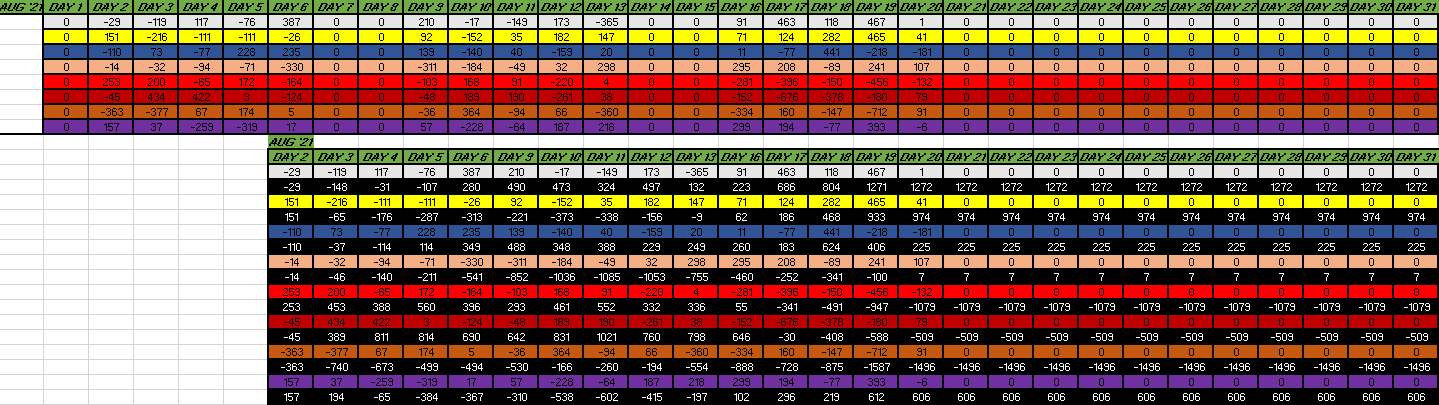
Basically, I compile each of the pairs results (above) into the complete currency daily results (below). That’ll be in that middle table. The bottom table is just the way how I can keep a running total for the month. The total running amount of pips is in black. That’s for the month.
So. For one example. The USD (in white). On Friday their net amount of pips added up against each currency came out to be +1. That puts their monthly running total at 1272. You can compare each currency’s aggregate total amount to each other. The USD has netted the most pips. Meanwhile the CAD has netted the least amount of pips, -1496. I mean, if I wanted to, I could look up above and diagnose any single currency pair if I wanted to. I can go back to any data (through 2018) and see any particular day’s results. And the thing is, I’ll forever have this data available for anything I would want to do. Back testing. Or any kind of diagnosis I can possibly want.
But I prefer knowing what each currency’s aggregate amounts are. Not any single pair. But, in order for me to know what the aggregate amount is, I need to go through all of the pairs. That’s all.

I am able to chart the running pips. This is for the year running. This is the USD.
And this is how I determine what each currency trend is. It’s this one chart. You can’t tell me the USD is in nothing other than in a bull market trend. I guess I put it into the yearly perspective, but what’s going on in the near term. And actually, take a look at the USD. Latest. They hit the yearly running high point. And it all started when they broke out of that longer running bear run. They carved out a good floor, then blasted their way on up. And ever since, it’s been bullish.
That’s nice.
Here’s my latest set of data that I collect. It’s the individual pairs. Pip amounts.

I need to start with that table.
Then I formulate that into this nice daily line up.

You only need to be concerned with the first and second (middle) columns. That’s forever etched into history. With the amount of pips that pair ended up with. My trading results (for my basket of trades) resides there on the right column. Oh, and the totals are on the bottom. Boy, did my basket trades did awesome this week. Since my basket of trades (16 pairs) trade alongside what the trend is, this is a good proxy of how much the market trended. Huge numbers this week! Each day my trades resulted in higher and higher amounts. Look. Monday = 463 pips. And then culminating on Thursday with +951 pips. Friday was such a small amount of retracement. That kind of tells me we just might continue on with this trend. We’ll see.
But more to the point. Here, I am collecting the hierarchy of each and every currency pair, in order of strength down to weakness. It’s their order. Can you imagine how this can facilitate any kind of back testing I would want to do? I mean, I have the answers of how each currency faired against one another. The best fairing currency pair this week went to the USD/CAD. That result was +180 pips. Big day. And guess what…I had that in my basket of trades. Therefore, it was a 180 pip win for me (right column).
But I get a volatility picture here also. The bigger the numbers the more volatility occurred that day. The middle column, on the bottom, it’s totaled. And just compare Thursday to Friday. 1919 pips were totally available on Thurs compared to only 517 pips totally available on Fri. The market moved on Thurs, but not Fri. That’s all.
Well, that’s the extent of what I do every EOD. Trust me, to get all those numbers in place, doesn’t take long. Probably 15 min max. I just spend more time on the other 2 groups of excel books, shown above. The trading one is important. I do most of my thinking when I’m in there.
But, all in all, I could spend about 30 minutes for a minimum if I had other real life stuff to attend to. But that mostly doesn’t happen. I like to spend an hour on my numbers. 45 minutes is probably the average amount of time each day that I compile, look at, think about, wrap my head around, and strategize. All of that comes from that data that I collect.
It’s fun!
It’s my life.
I’ve been doing this, strongly, ever since 2018. That’s this excel, daily, compiling. It took different forms and have changed over the years, but what I showed you is the latest. Hopefully I won’t be changing anything. Cause I really, really like what I currently got.
Well, there’s some insight for ya.
Maybe one of these days I’ll show you the other two excel books that I do daily.
Or maybe I won’t. Cause it’s probably no one’s else’s cup of tea.
It’s definitely my cup of tea.
Keeps my mind going.
Plus…if anyone wants to know what’s going on in the market, I have the answers.
Alright Journal.
Thanks for listening.
Been fun. Thank you.
Mike