My journey journal...from demo to live...and beyond

Good morning Journal.

Let’s see…what’s going on.

Well, this should be fun. A little continuation from all that nonsense I wrote up last weekend. Here’s what I was thinking, and here’s what I’ve done so far.

So.
No joke.
(In my mind)

I got $300,000 handed to me.
I’m all set. The biggest hurdle in the way of my goals and dreams is taken care of. Now it’s time to set on the journey that I’ve been waiting for. It is time. This is the business that I’ve been waiting for. Waiting on. Practicing. Struggling with. Writing about. But mostly, praying for.

The time has come. And now I have the means to get this started. Surely, that should be enough to begin with. It’s the capital they talk about. Seed money. Start up capital, to be more precise. I remember that from the course I took a couple years ago. Boots to Business program. It was a veterans course for learning how to start your own business. I learned a lot of things going through all that. It’s one thing to have dreams and visions of what you want to do. But you get a little closer to it when you are actually talking to other business owners about the venture. It seems to get more real when you are in a class learning the material.

Maybe this can come true.
It all starts out with an idea.
Draw up a good business plan on it.
Get the funding approved from somewhere.
Carry out the plan. Or in another words, start the business.

Like I said, I did learn a lot. In fact, I still have my business plan on a word document somewhere. I spent so much time on that, I remember. But going through the whole process was not all that pretty. Kind of bothersome. Cause all I was doing was trying to convince someone else that I could do this. I did get a chance to talk to many different business people about it. That was sort of fun. But, in the end, it was like I was a salesman. And I had something to sell you. Yeah, me. However I could prove it to you, on a piece of paper, that I could do this and that it will work was the goal. But of course, they would have to believe you and then give you that large sum of money. With strings attached, no doubt.

Yeah, going through that whole process bothered me. It was like begging. Pleading my case. You’re at the mercy of someone (or some entity) who just has a lot of money. Deep down inside, that just doesn’t feel right. But whatever I learned, I’m sure it helped for something. It was an experience. Pathetic might be a good word for that time. You know how hard it is to get funding approved for a trading business? Very. It’s not like trying to establish a coffee shop or something. Some dreams are just impossible to make come true. But I tried.

Anyway. Sorry about that.
I just got stuck in time there for a moment.
Where was I?

Ok. Well, what am I going to do with 300k?
Trust me, my mind has gone down this particular thought process many times before. But this time I’m not playing.

I know one thing. I’m not going to put all that in one trading account. Something just don’t feel right about having that much money at risk. I just don’t like the idea of all of it exposed in the market. Man…you never know what can happen. I just have to be a little smarter than that. So this is how I’m doing it.

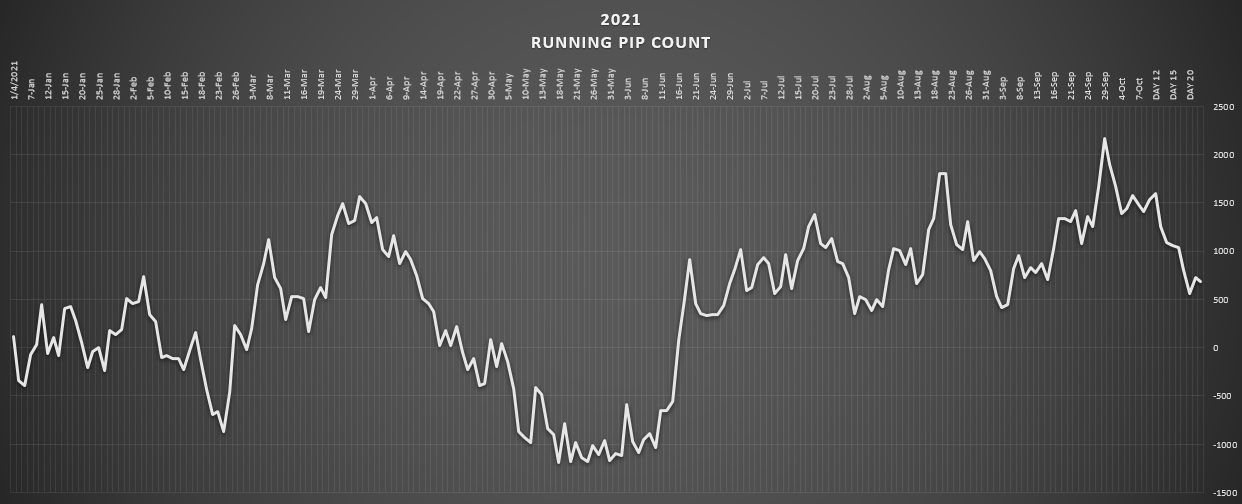
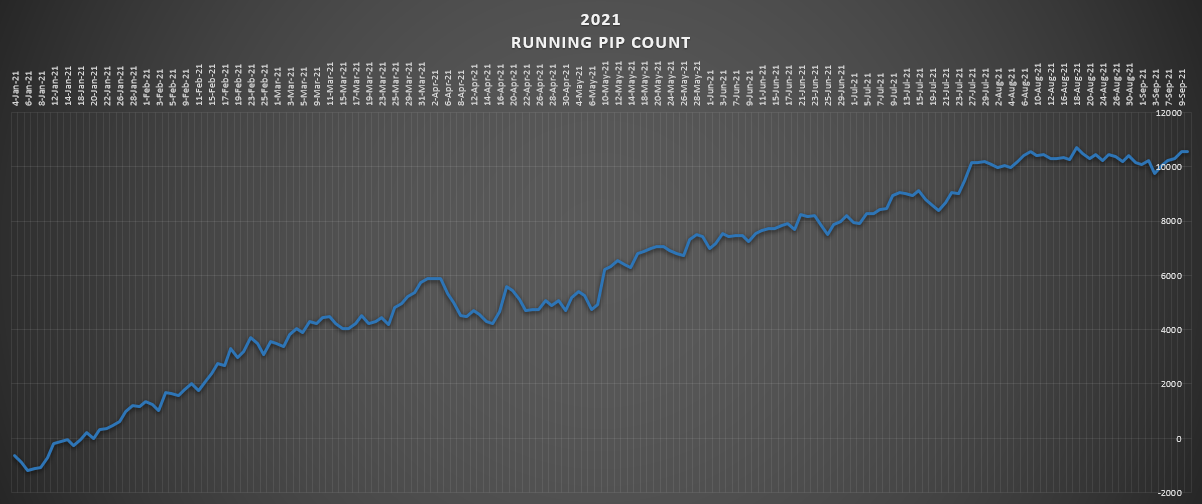
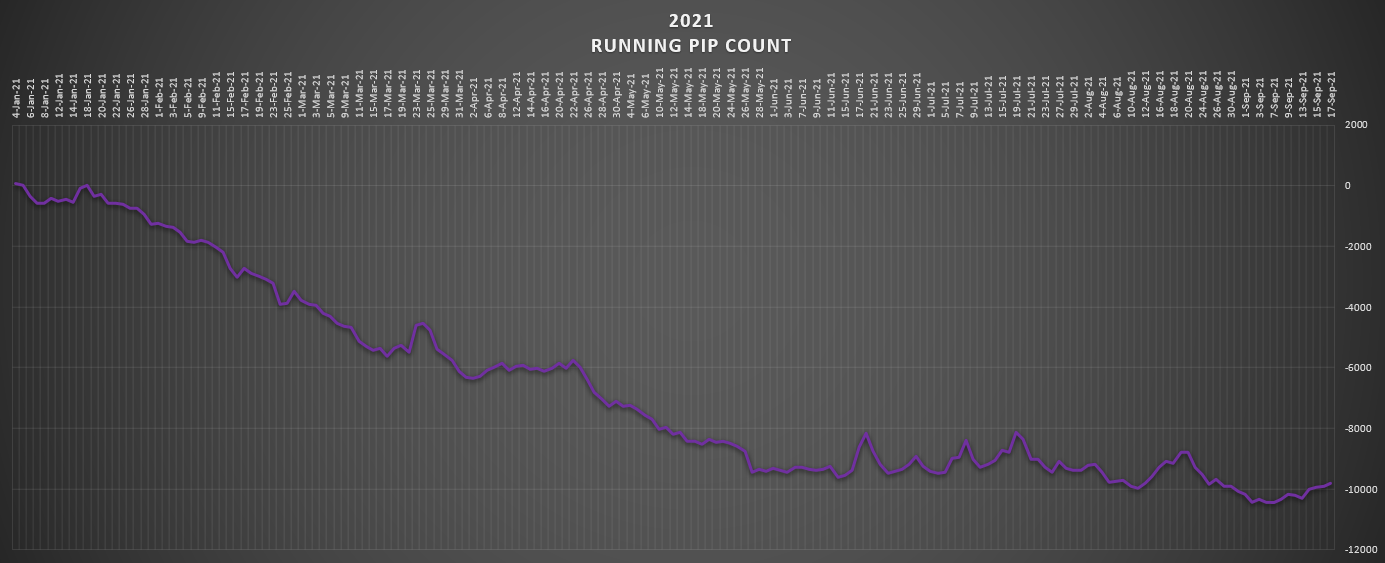
That’s the total amount of equity I have. Ok. Great. It’s down. On paper (and on an excel sheet). But I will open up one trading account with 100k. Even though it all won’t be exposed in the market at one time, I tend to think that it will, just by the fact that a broker has it all. Know what I mean?

The next most important thing I noted was that I plan on withdrawing from my total line of equity at the end of every month. How much? Well, all I need is 3k. That’s like for real, also. That’s more than plenty for me to pay all my bills. Anything more would just go into savings.

So therefore, that’s my goal. Well, I should say, that is what’s gonna happen at the end of every month. And I think that’s important because it gives me some kind of reference point regarding how much I need to generate out of the market.

Well, 3k out of 100k is 3%. That’s all I’m shooting for. Regarding my trades. That’s it. I’ve done that before. Many, many times. Even though we’re not at the beginning of the month I think I have plenty of time to get the job done.

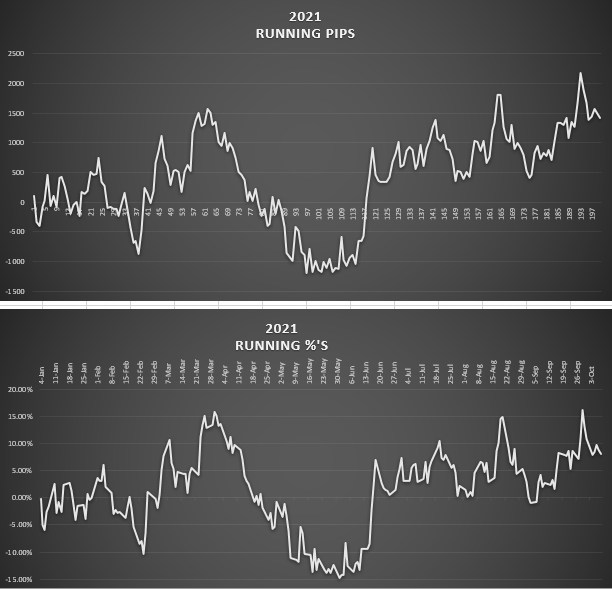
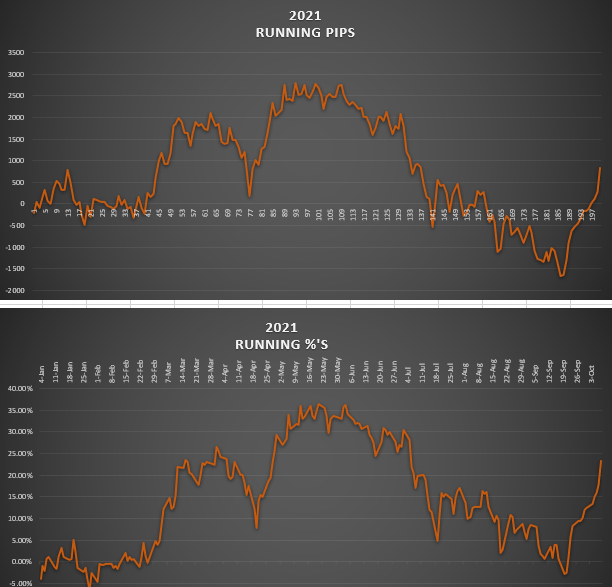
I have 3 trading strategies. Surely I’m not going to use the basket of trades that I like running in the market. But it does help me understand what’s happening when it is running. That will run, and continue to run, on my demo account.

I’m gonna have to revert back to some primitive style trading. Actually, that falls under what my trading strategy # 3 is (A.T. III). One shot. It’s where I’m like a lion. Waiting in the wings for the opportunity to present itself. Then I just pull the trigger on that one pair to trade. Quite boring. But I got to pay the bills.

I want to show my thought process on this. Cause it went down this past week. My very first live trade. It happened. And I have results.

I break out the pencil and paper and write down what I would want to see happen in the market. It’s the scenario that I’m looking for. It would be like the lion wanting to see a gazelle walk right on by in front of you, grazing on some grass like there’s no problems in the world. To be close enough to strike, with minimal risk and a most probable chance.

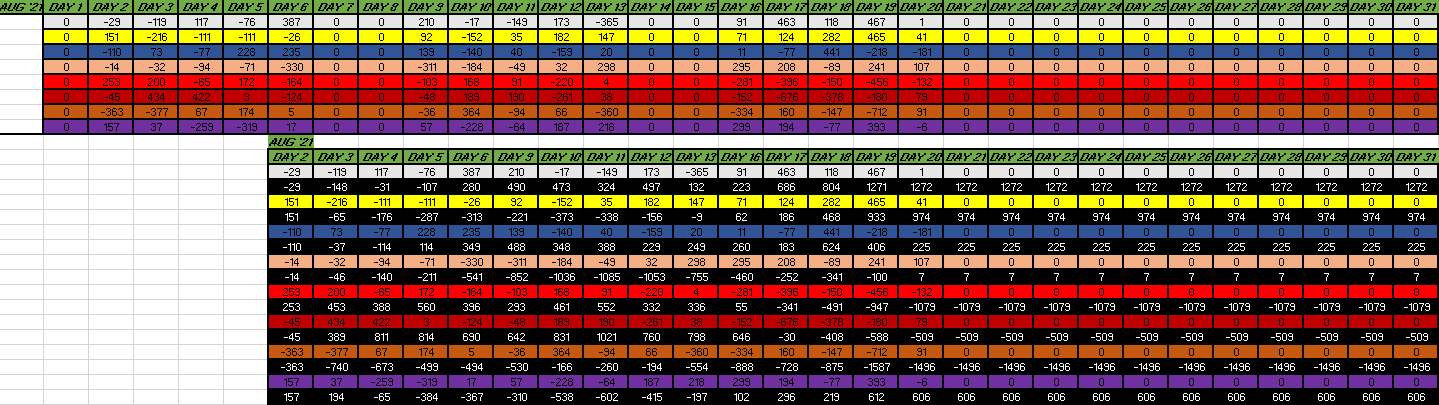
These are some of my notes.

I’m waiting for some risk-off scenario. I have cause to believe that it’s around. It’s in the air. I just don’t know when it’ll strike. But when it does come around, then what?
That leads me to be looking at either the JPY, CHF, USD. For strong.
But then for the weak currency I will be looking at those who are trending low. Which are: JPY, AUD, NZD, CAD.
Of course I can’t pick the JPY cause that’s one of the safe haven currencies above, regardless if they are trending low (which they are). Therefore, my field narrows down to one of the Comm currencies.

So, there are a few currency pairs to look at given all that criteria. But this is the one that jumps out to me.
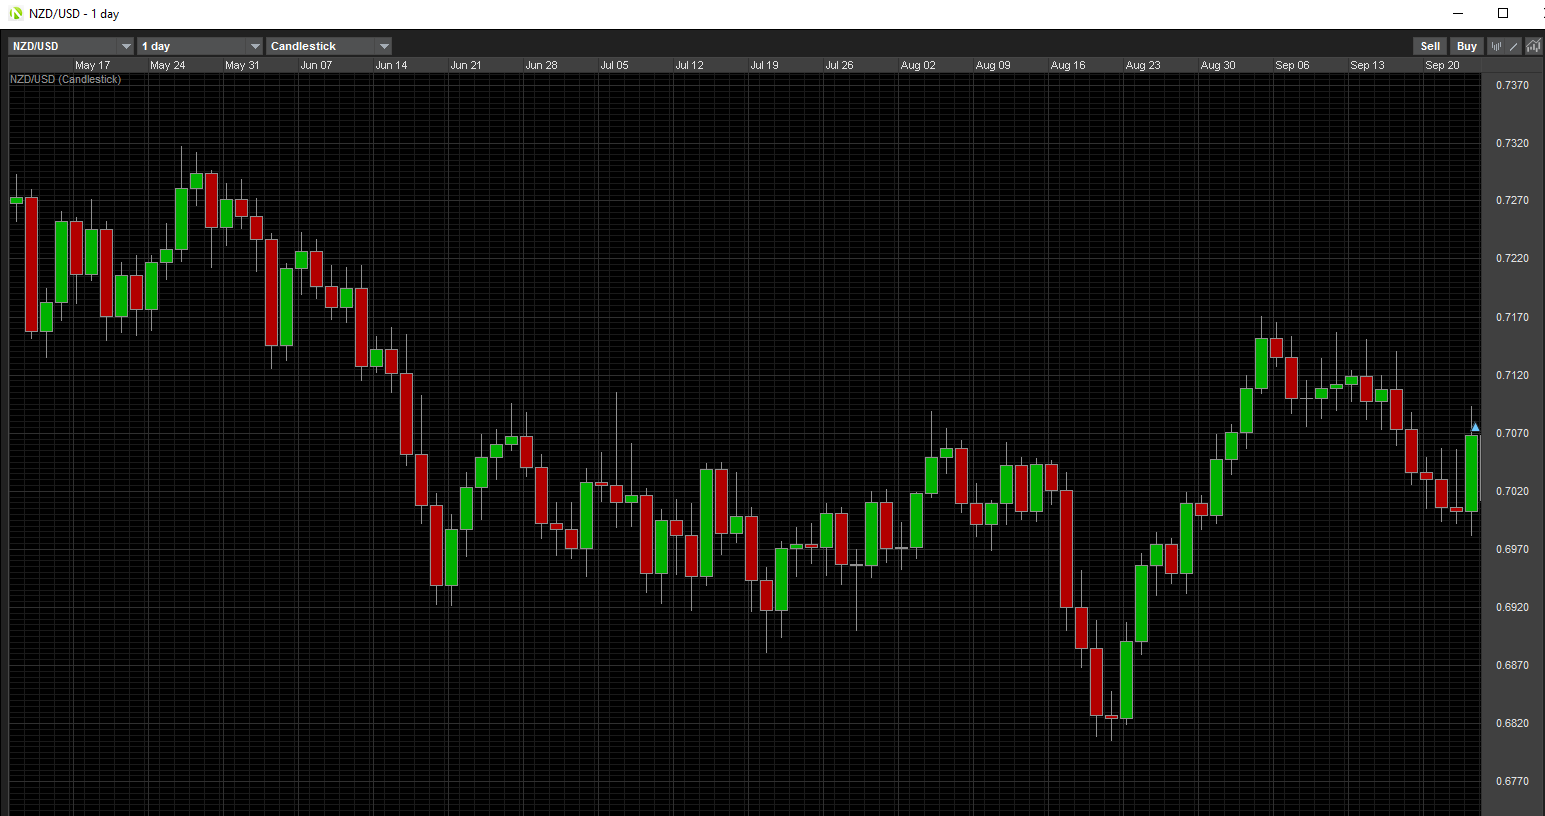
CAD/JPY
For low.
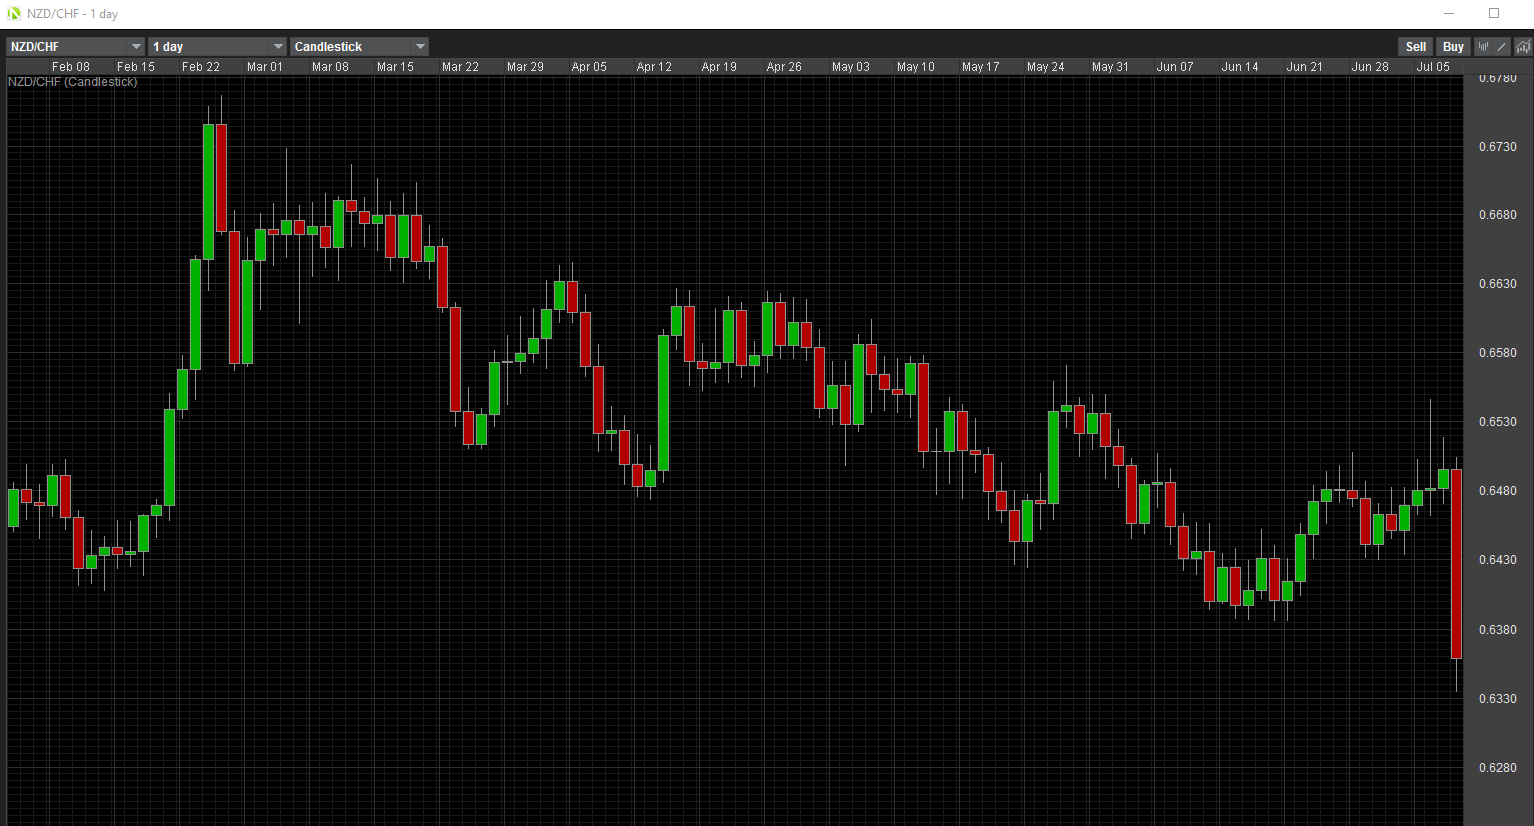
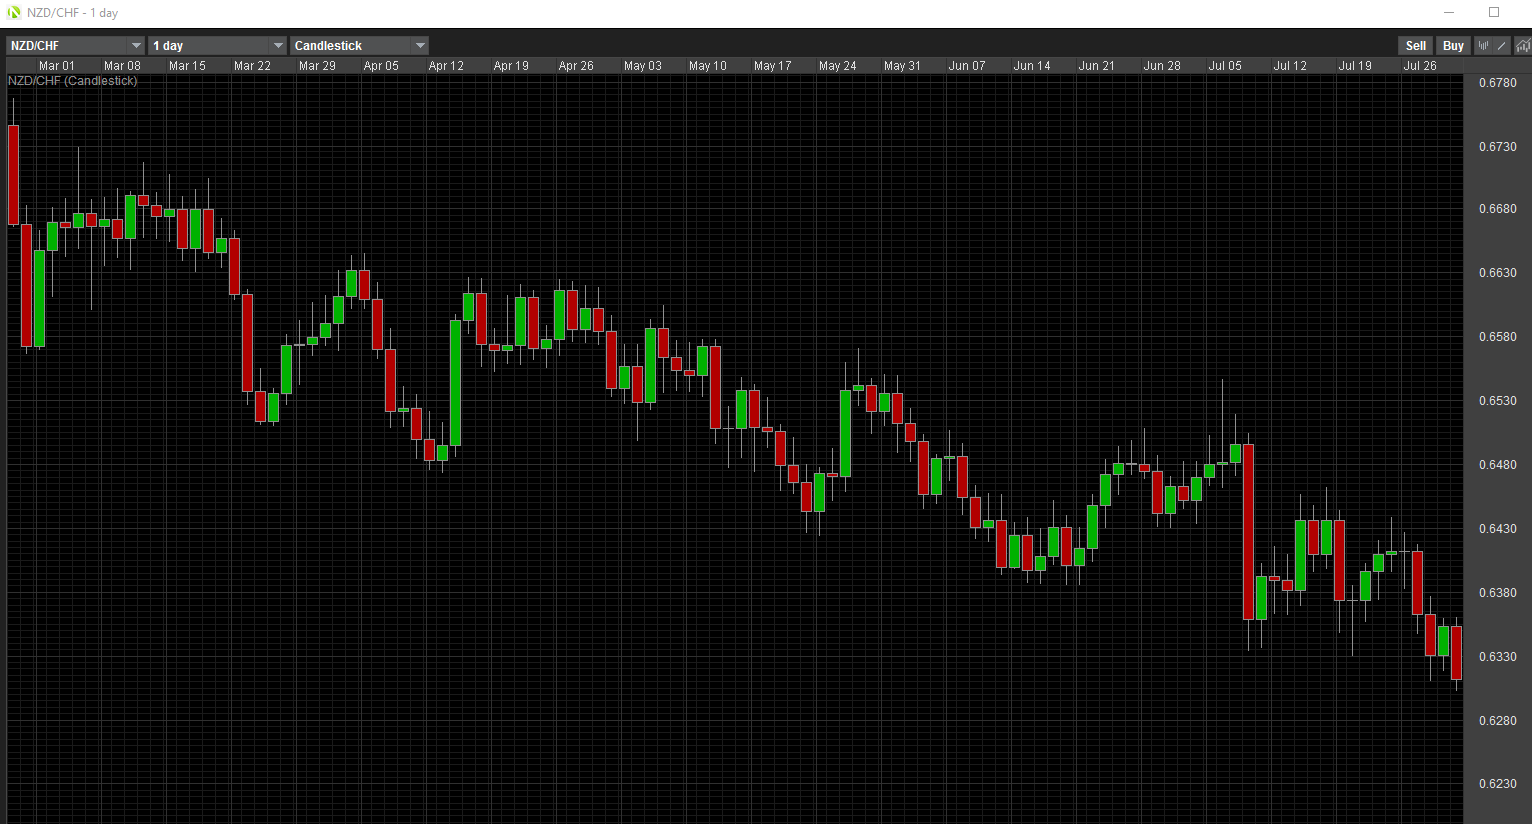
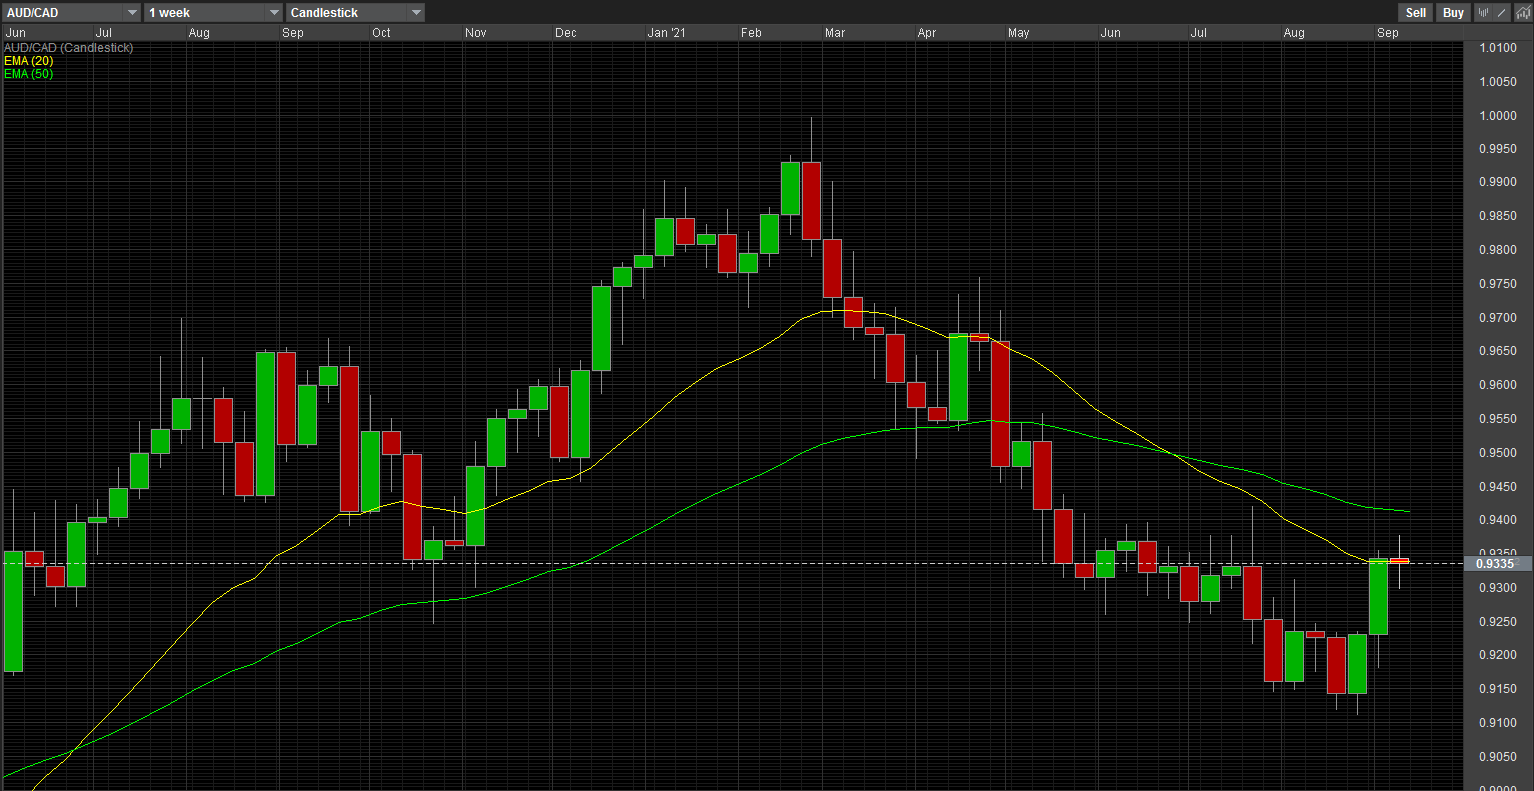
On the weekly time frame, the price action looks promising. The trend is down. But the most recent price action retracement is moving higher. You know what they say…Sell the Rallies.

So. I got to wait for the opportunity to present itself on this pair.

The week unravels.
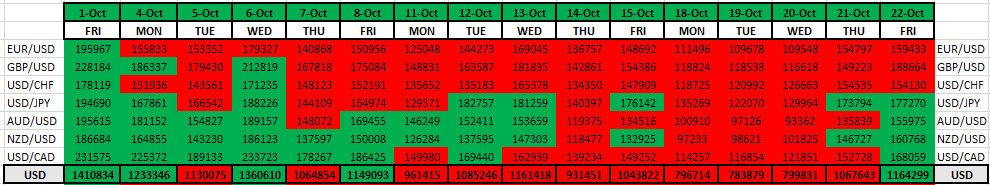
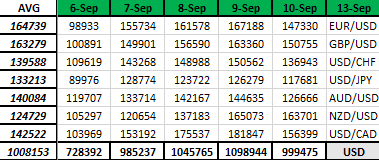
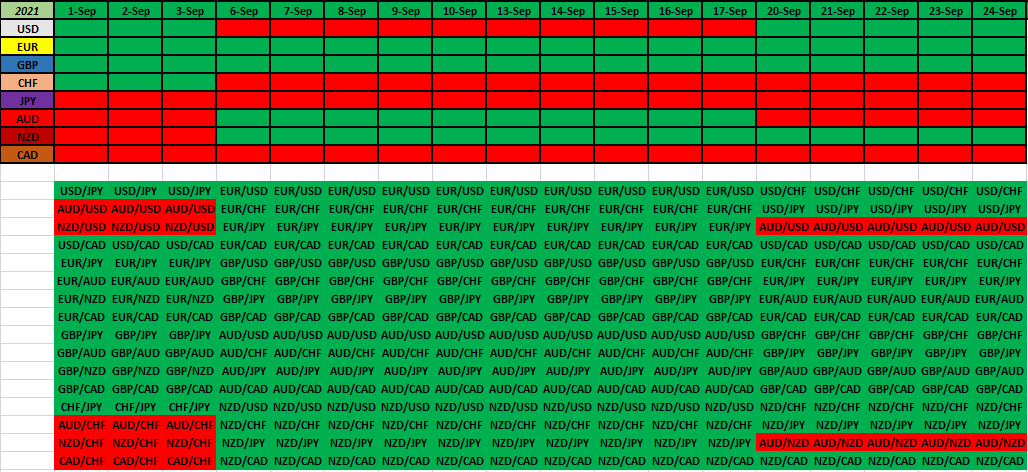
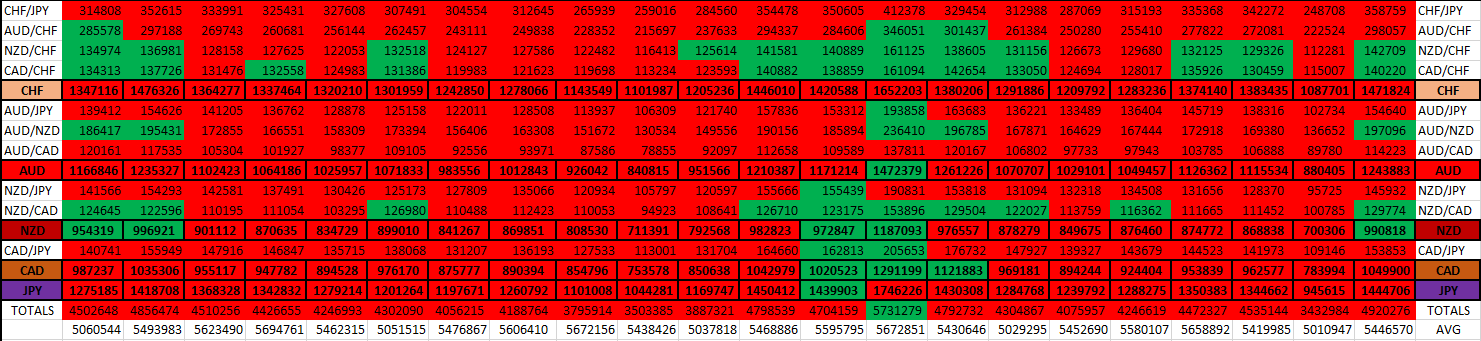
Monday comes and goes. EOD data shows nothing but the USD the strongest currency.
2021-08-15_08-03-25
Can’t really tell about risk on or risk off that day. Was mixed. The day comes and goes and nothing tells me that I should do anything regarding trading. Even the EOD results.
Tuesday.
2021-08-15_08-07-57
You don’t need to be a genius to see that it was a risk-on type day. Also, what do you think that CAD/JPY pair was doing that day? When you got the CAD moving the strongest and the JPY just about moving the weakest. This is a no brainer. I’m sitting out and still waiting.

Wednesday.
2021-08-15_08-11-13
These are EOD results, but the point is, that during the day it was risk-on still happening. That was being carried over from the previous day.

Still. I’m not even thinking of a possible trade. To risky of an environment for me.

Thursday.
Now it’s getting interesting.
Let’s look at what the pair is up to. From the start of the week up through Thurs.


I’m not glued to the market during my days. Even though I’m on vacation still (as the kids are still off from school). I’ll check in with the broad market and currency’s from time to time. But this Thursday I started to notice a change in the air. Risk-off is coming.

Then I look at this chart, honestly for the first time this week. When I seen that very large hourly candle, I’m like, that’s a tell. Yeah, I might have been a couple hours late, but we’re not too far off away from that though. That one candle pretty much told me that I need to get into this trade. This is the opportunity I’ve been waiting for.


That triangle tell you exactly when and where I got in at. South of course.
This was 2:40 pm ET.

Ok. That’s nice. What’s the plan now?
Well, I wrote that stuff down. This is exactly what I wrote.

  • Only settle for a profit
  • Leave open to end of week (1 more day)
  • Desire risk off to come back before the week closes

— If it does —

  • Take some profit
  • Ride it through till next week — If I’m in much profit

— If it doesn’t —

  • Jump — Take the loss

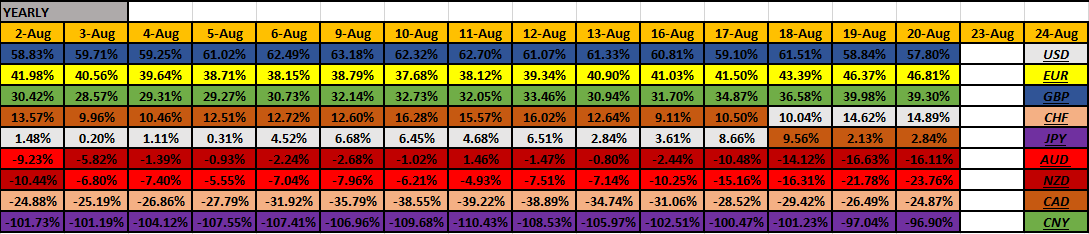
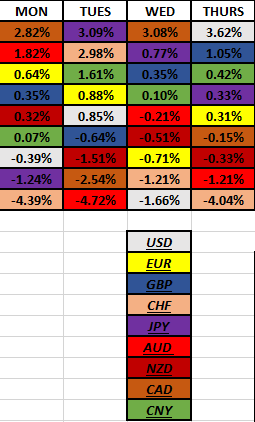
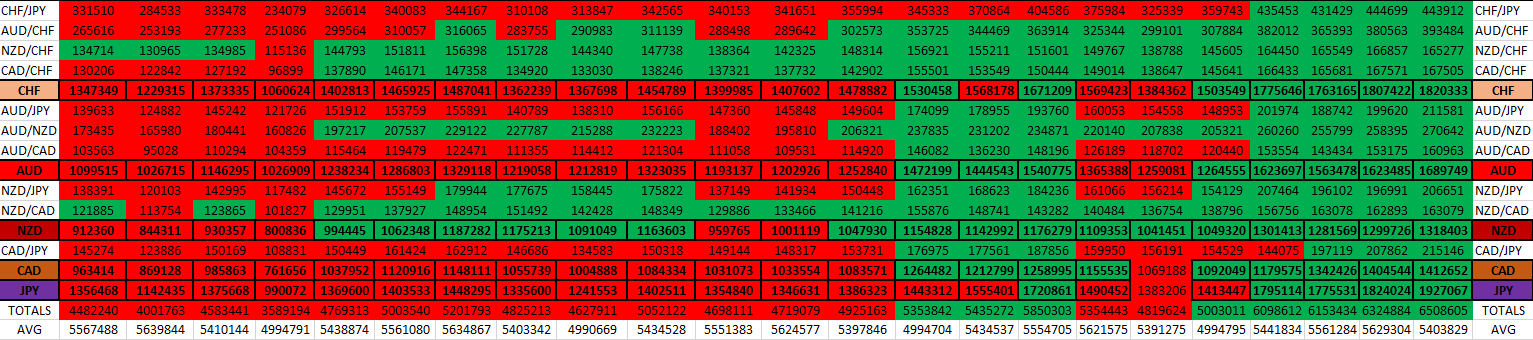
Well, the EOD data for Thursday comes in (only like 2 hours later).

2021-08-15_08-38-35
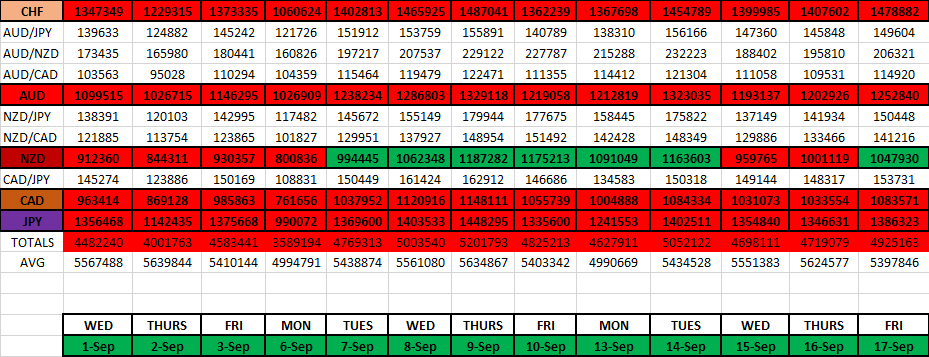
Well, to my surprise these results did show me that we had some risk-off this day. These numbers are quite low for how much a currency will travel in a day. Very low. Like 4% is normal for the strongest and for the weakest.

Ok. So. Some details of my trade.
Of course I broke out the Babypips
Position Size Calculator - BabyPips.com
Pip Value Calculator - BabyPips.com

Since I don’t play with stop losses, I guess I have to put something in. So I put in a 100 pip stop loss. Cause I wouldn’t want a trade to go much further than that much. And I use the figure 5% of how much I want to risk.
So, between those input numbers, I end up with 552,050 units of a position size.
That’ll be a $50 amount for every 1 pip movement of travel.
So that means if it moves 60 pips then that’ll equal $3,000. That’s what I’ll be looking for at the end of the month. That amount would be great to make as profit.

This just gives me some kind of idea of what to expect if I went with this unit size amount, that’s all. Surely I’m not gonna put on a stop loss. Or even a take profit. No way. I’m not going to box any trade in. Are you kidding me? I’ve learned some things over the years. That’s nonsense. That’s when you get trouble coming.
Cause the trade just won’t go the way you want it to.

All I know is that I’m going in with that amount of position size, and that’s it!
That’s all I need to know.
So. It’s placed. And let’s see what happens.
I have all month if I get into trouble.
But, as my plan is stated, I’m hoping for some profit before the week ends. Which will be very soon mind you.

This is what lunch time Friday looks like.


You better believe I’m happy. No worries here. So, I’m noticing that every hourly candle here in red is not retracing up much at all. That is telling me that there is some serious selling going on. And it doesn’t make sense for me to jump any time real soon. But surely before the day ends, oh, I’m out alright. Should be enough dough.

Then I jump a couple hours later.


See the triangle? I’m out at that point. And that is where the week ended at also. Guess what? Looks like I hit the bottom of that one. Now that’s lucky.

I probably need to remember about this, cause the way this was moving, there just might be much more to come next week. I got to remember to keep my eye on this pair. Though, I do not like watching individual pairs. nod,nod,nod

Well, how much did this produce?
2021-08-13_14-43-31
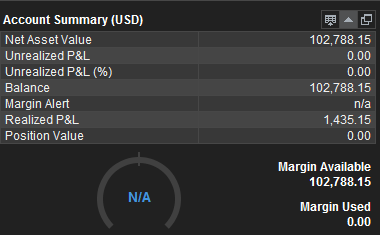
Oh yeah. That’s close enough for me. You know how much I will be deducting from my account at the end of the month. But all I know is, that I am about there already!

No pressure.
I’m gonna take a nap.
Hopefully some gazelles will come on by before the month ends. But if they don’t want to, I’m not gonna sweat it. A couple dollars out of my 300k is not gonna hurt me.

But I got to tell ya.
I feel that I get great opportunities when I wait patiently as the week rolls out. I’m seeing what’s going on. And when things want to turn a certain way, well, it does seem to end up going that way. This is deja vue. I know I posted a very similar set up and situation some time ago. Like a couple months ago or something like that.

Man…I should probably make a complete strategy out of this.
Honestly.
In fact, I don’t think I ever had a losing scenario this way yet.

I just works.

Anyway. I wanted to tell the story.
And my live account trading is off to a wonderful start!
I guess this is the way I have to play this primitive trading style.
It’s not me. But, if I have to make the profits, well then, so be it. I’ll bite.
I’ll just keep my other demo accounts running and monitoring.

Alright Journal, thanks for listening.
Mike

1 Like

Journal it’s good to see in live time how a trader can get a sense of risk by analysing price behaviour.

Maybe a lesson for us all how the market reacts to risk - specifically Japanese risk - Thursday/Friday sadly Japan reported a ‘natural disaster’ with ’ explosive growth’ in covid infection numbers.

Many learner FA traders figured that as Jpy negative - but the rule of the market has always been that in times of distress Japanese investors take money home thus Jpy buying.

Tell Mike good start and thnks for sharing.

1 Like

Good morning Journal.

Sorry Journal, just sitting here wondering what I want to talk about. And I think I got an idea. How about I kill two birds with one stone. Cause I want to do a thorough look at what the market has been up to lately. But also I want to do a normal walk-through of all my data collecting. I’m sure I probably have shown bits and pieces at various times, but I don’t think I ever went into depth into what I do.

Ok. Here we go.

I’m in the business of trading. Therefore I want to know my market. And since my market mostly has to do with relationships, I need to know how all things are relating to one another. Well, there are many different perspectives you can approach the market from, I happen to want to know what are the various time stamp versions.

Nothing means more to me than the daily result. Anything shorter than that means nothing to me. First off, the duration of my trades can run for days at a time. So why would I need to know how the intraday movement tracks? Well, there was a time when I collected the sessions results. That was in the beginning. In fact, there’s a thread in here showing how I kept track of that…like…every day. That was too much. Look. I was curious to know how things bent and turned inside of a day, but it’s a lot of work keeping track of that stuff. I think the thread was called something like Currency Dynamics.

Complete Currency Dynamics - Trading Discussion / Currencies - BabyPips.com Forex Trading Forum

There it is. I guess this is when most of my excel spreadsheet compiling methods started. Trust me, keeping track of the market via paper and pencil method took a very long time. But that’s how I started out. You wouldn’t believe how much time and effort I spent compiling all of the 8 currencies’ movements on paper. It was a lot. Hours and hours I spent every weekend, I remember. Even for me it gets exhausting. Thank goodness for excel. Whoever came up with the idea of excel is a genius. Honestly. I mean, I came from knowing nothing at all about excel, to now, needing that tool more than anything. In fact, I wouldn’t have a business if it wasn’t for excel. I guess it’s not all that smart to have such dependence on something. But it is what it is.

Ok. It’s time to get into what I do every EOD. And like I started out with, the daily time frame is my most important piece of data. But to the extent of where you can go with that is quite amazing. I’m about to show you.

This is a pic from my desktop.
2021-08-22_05-11-31
For every EOD I’ll use 6 of those. I will compile all my daily numbers into that 2021 EOD numbers. A lot of stuff goes in there. I’m gonna show you. But then, after I get everything set into that, then I go right next door to the trading spreadsheet. This is where my trading metrics reside. All indicators, and documentation that I do regarding my trades will come from here. And then finally, next door to that is the historical data base. Well, it’ll be quite similar to all of what I store in the first one where all the EOD data resides, but this is the place I can go to for analysis purposes. Even for back testing. This is where a lot of work gets done. I just can’t be messing around with so many numbers at the place where I collect them all. There’s a time and a place for everything. Here’s where I can crunch, twist, play, formulate in different fashions all the historical data that I collect.

But then the 3 books directly underneath those 3 is my templets. I use these for efficiency purposes. Basically, it speeds up my time compiling the data. There are formulas set up in which all I have to do is copy and paste the new daily data. I’ve gotten smarter and lessened the amount of time that it takes to do it all, via these formulas.

Let’s move on. This is the first thing I compile. All of my %'s derive from this.


This is a birds eye view of probably the most important data I collect. Trust me, it doesn’t take long for me to get one day all filled in. Probably about 5 minutes. Max. I’m telling you, the power of excel is amazing. But all that up there is the core stuff. It’s broken down into the daily, weekly, monthly, quarterly, and yearly. I do want to go through and see what the latest is. And by that way, I’m gonna move on down the page and show it to you. Cause all of that data up there is just consolidated in a format below.


We got the %'s of how each currency has related against all of the other ones. So, when I look at this chart, this is what I’m thinking.

  • European currency’s are having a good year. The GBP stronger than the EUR. And both of them are outdoing the USD. Actually by quite a bit. Therefore, I peg in my mind, that these 2 currencies are, and have been all year long, strong. This’ll probably continue on for the rest of the year, since this chart hasn’t changed much. I looked back, and the GBP has been on top since Feb. The EUR has been second since June. Before that the CAD was second. Yep, there was a time that the CAD was strong. Really strong. But not now.

I’m sorry I can’t show you the entire progression of the yearly perspective. Too long. But I got to tell you, it’s awesome to look back and see how they all changed against one another. But this is why I do this data compiling. Cause I just want to know. I always want to be able to go back and see what happened. I’m gonna take advantage of the fact that the market leaves behind footprints. Trust me.

  • The USD. To date, they are positive. Sure, lately they’ve been on a bull streak. It wasn’t always like that this year. Remember the doom and gloom talk that every analyst jumped on? Well, they’re not now are they? Nope. That subject has subsided to none existence. Actually, the USD came out of the negative values around the middle of June. So, I’m gonna say that the USD has been having a good summer.

  • Quick note about the CNY. Not that I trade them or anything, but I just got to know the sentiment. Comparison to the USD. They’re having a very good year against the Dollar. Just something to note, that’s all.

  • The CAD was having a good year, but back at about break even now. They were second and being up in the mid 30%'s back in May. For most of that month they were dominating just below the GBP.

  • The AUD, NZD are sitting negative on the year. Yeah, it’s not been going so well with them this year. I mean, you would think that after last year this would have been their year. Nope. Thanks to COVID lingering around, I think, they’re in check. Can’t get into positive territory. We very well might be in a new era. All the stock markets of the world shows a different story. New record highs. Like almost everyday! But this is strange. It has always been that when the risk on sentiment is thriving, these guys are strong also. Not this year. It’s different. And I need to know these things. This is the only way. By keeping track of 'em!

  • The CHF and the JPY. Both safe havens. And this year they both have been the favorite to sell. You would think it was a risk-on type year, with these guys on the bottom. But not really. It kind of has been a risk-on year, but the European currencies being the most preferred to buy. And these 2 being the preferred ones to sell. Also to note how the CHF has not been following the EUR. What a divergence! This is just what I sock away in my mind about this year. That’s not so normal of a relationship.
    And the other thing I’m keeping in mind is regarding the JPY. All I’m doing is awaiting their lift off. I mean, they can’t stay this low forever, can they? I’m watching though. This is a real anomaly. A real extreme. But hey, if it’s a new world (cough COVID cough) then it’s a new world. I can accept that. But all I know is that if the JPY ever wants to get strong again, I want to be apart of it. I’m watching and waiting to catch that ride (if it’ll ever happen). And I’m not talking about a good couple days either. I’m talking like when everybody hops on board and rides it strong for a good length of time. I’ve seen it. I even have those days, weeks, months, documented. I can go back to the year '18. For anything daily. But hey, maybe this time is different. It’s a possibility. We’ll have to see. In the meantime, when, if, they want to turn -80%'s and higher, I’ll be in. Strong.

Ok. That’s enough year talk.
How about the latest quarter.


We’re in the middle of the 3rd quarter. And the biggest thing that catches my eye is the CHF. They’ve started out the quarter being the strongest. I even remember changing their stated trend from bear to bull. In July they were in a bear trend. In Aug I switched them to bull trend. That quarterly chart should explain why. But then look at what happens as the month of Aug unravels. They (in pink) dip down quite a bit. Good thing I am not too hasty on changing my trend determinations too quickly. Cause look what’s been happening lately. It was only in this past week that they took on strength. Like…they remembered…their strong this quarter. And that’s what happened. Went back to their bull trend. Now their the top dog. It only takes one week. This last week belonged to them.

Also, I am paying attention to the other safe haven currencies this quarter. USD, JPY. They are not the currencies that are being sold off. It’s the Comms that are. You should be able to see that 2 of the Comms (AUD,CAD) are the weakest by a lot. No comparison. But it’s a shame the NZD couldn’t come up with a rate hike. Thanks to one person who got COVID? Are you kidding me? Well, they could have changed the course of the Comms, I think, if they would have hiked their rates. But no. We have a new era, new world. The Comms are gonna be sold more than bought.

Monthly perspective.


See. And this is my point exactly. The market seen it coming. The NZD had a rate hike coming. That was due on the 18th of this month. It would have been at the very beginning of that EOD data. See how the market was buying them up? That’s the lead up. Not only them but the AUD was getting bought up also. And then what happened? Well, one person (thanks a lot) got COVID on that Tuesday the 17th. That’s when the word got out. Took the wind out of their sails, huh? And who was on the other end of that trade? The mighty USD. Actually, all the safe havens benefitted from that this past week. Those 3 took turns getting bought up.

But concerning the European currencies, they seem to skate right on by, not too much affected. Their not being sold off because of this turn of events. Remember, they’re strong this year. I don’t have that data, up above, for nothing! The market knows. And so do I.

Well, this is definitely a turn of events. The market wanted to go by way of the risk on currencies. I bet you a lot of money got stuck with their pants down. And the Comm currencies was not trending high, prior to this month. What was, then, the prevailing trend in the market before the NZD getting strong in this month of Aug?

Well, we can look at the quarterly perspective. July, Aug, Sep. What was I just explaining up above? The European currencies (EUR,GBP,CHF) all are very strong. Them mixed in with a touch of safe haven flow. We could say the majors are dominating. The USD has been having good days. The JPY has been trying to come up off the floor with some good days, not consistently though. But I would say the most telling thing is that the market went back to the CHF buying. I talked about that already. I think that’s the most correct answer to the question of where the market was heading, now that the Comms can’t convince everybody of buying them (thanks a lot NZD).

So. We know that some traders got caught with their pants down. Lost some money. But now what? I think it’s possible that they just might wait another week, after things have settled down, and try again. I don’t know…do they have money apportioned and all ready to go for the Comms? Like…will they think those currency’s are at a discount now? Cause, boy, that NZD took a real hit. Hundreds of pips lost. Honestly. Maybe they will get in on the discounted prices and ride up a long haul. I don’t know, but I think it could be possible. I’m watching for that scenario.

Well, that’s the latest narrative that I have for what’s going on in the market. Those are a lot of my thoughts. I will only trade if I see a scenario play out (on my live acct). And the one scenario I just told you I’m looking out for. The NZD to grow some legs. If they do this coming week, towards the end of the week, I’m gonna get in. See, I accept the fact that I don’t know what’s gonna happen. I’m not going to think I know something. But what I can do is envision a scenario to take place. Hey, if the NZD is a lost cause, then so be it. Won’t bother me any. I won’t touch them unless I see something big. I got to see some multiple days of buying. Also the AUD to follow. Until then, I’m content to sit on the sidelines and see market move. And do what I do best. Collect the daily data.

So yeah, let’s get back to that. I guess I got to go quite quickly. Cause we haven’t even scratched the surface on what I do on a daily basis.

This is a break down of each pairs daily pip totals.


Basically, I compile each of the pairs results (above) into the complete currency daily results (below). That’ll be in that middle table. The bottom table is just the way how I can keep a running total for the month. The total running amount of pips is in black. That’s for the month.

So. For one example. The USD (in white). On Friday their net amount of pips added up against each currency came out to be +1. That puts their monthly running total at 1272. You can compare each currency’s aggregate total amount to each other. The USD has netted the most pips. Meanwhile the CAD has netted the least amount of pips, -1496. I mean, if I wanted to, I could look up above and diagnose any single currency pair if I wanted to. I can go back to any data (through 2018) and see any particular day’s results. And the thing is, I’ll forever have this data available for anything I would want to do. Back testing. Or any kind of diagnosis I can possibly want.

But I prefer knowing what each currency’s aggregate amounts are. Not any single pair. But, in order for me to know what the aggregate amount is, I need to go through all of the pairs. That’s all.


I am able to chart the running pips. This is for the year running. This is the USD.
And this is how I determine what each currency trend is. It’s this one chart. You can’t tell me the USD is in nothing other than in a bull market trend. I guess I put it into the yearly perspective, but what’s going on in the near term. And actually, take a look at the USD. Latest. They hit the yearly running high point. And it all started when they broke out of that longer running bear run. They carved out a good floor, then blasted their way on up. And ever since, it’s been bullish.

That’s nice.

Here’s my latest set of data that I collect. It’s the individual pairs. Pip amounts.


I need to start with that table.

Then I formulate that into this nice daily line up.


You only need to be concerned with the first and second (middle) columns. That’s forever etched into history. With the amount of pips that pair ended up with. My trading results (for my basket of trades) resides there on the right column. Oh, and the totals are on the bottom. Boy, did my basket trades did awesome this week. Since my basket of trades (16 pairs) trade alongside what the trend is, this is a good proxy of how much the market trended. Huge numbers this week! Each day my trades resulted in higher and higher amounts. Look. Monday = 463 pips. And then culminating on Thursday with +951 pips. Friday was such a small amount of retracement. That kind of tells me we just might continue on with this trend. We’ll see.

But more to the point. Here, I am collecting the hierarchy of each and every currency pair, in order of strength down to weakness. It’s their order. Can you imagine how this can facilitate any kind of back testing I would want to do? I mean, I have the answers of how each currency faired against one another. The best fairing currency pair this week went to the USD/CAD. That result was +180 pips. Big day. And guess what…I had that in my basket of trades. Therefore, it was a 180 pip win for me (right column).

But I get a volatility picture here also. The bigger the numbers the more volatility occurred that day. The middle column, on the bottom, it’s totaled. And just compare Thursday to Friday. 1919 pips were totally available on Thurs compared to only 517 pips totally available on Fri. The market moved on Thurs, but not Fri. That’s all.

Well, that’s the extent of what I do every EOD. Trust me, to get all those numbers in place, doesn’t take long. Probably 15 min max. I just spend more time on the other 2 groups of excel books, shown above. The trading one is important. I do most of my thinking when I’m in there.

But, all in all, I could spend about 30 minutes for a minimum if I had other real life stuff to attend to. But that mostly doesn’t happen. I like to spend an hour on my numbers. 45 minutes is probably the average amount of time each day that I compile, look at, think about, wrap my head around, and strategize. All of that comes from that data that I collect.

It’s fun!
It’s my life.
I’ve been doing this, strongly, ever since 2018. That’s this excel, daily, compiling. It took different forms and have changed over the years, but what I showed you is the latest. Hopefully I won’t be changing anything. Cause I really, really like what I currently got.

Well, there’s some insight for ya.
Maybe one of these days I’ll show you the other two excel books that I do daily.

Or maybe I won’t. Cause it’s probably no one’s else’s cup of tea.

It’s definitely my cup of tea.
Keeps my mind going.
Plus…if anyone wants to know what’s going on in the market, I have the answers.

Alright Journal.
Thanks for listening.
Been fun. Thank you.
Mike

1 Like

Good morning Journal.

Well, once again, I’m sitting here for awhile, wondering what I’m gonna type about. Look. You know how I like to type away. It is fun. Very releasing. But I do need something to talk about. Well. I usually have to remember the whole point of this, which is, what’s going on with me? And I guess there’s always something going on.

Yeah man, it’s the old “Back to work, back to school” scenario, for me. That was a catch phrase I used to say to my kids growing up. I said it a million times to them. It meant that it was time for me to go back to work and them to go back to school. But it all was work the same. When the weekend is over, it’s what we have to get ready to do. And yet I never knew, back then, that I would end up saying this to myself, and myself only, on a regular basis.

They all might be out of school and on their own, but I never knew that I would end up being a school bus driver. But, it’s that time again. I’ve been driving lately. Even though school hasn’t officially started yet (which it’s starting this week on Tues) I’ve had to do some trips. Last weekend and this weekend (last night). It’s the high school band trips. They go with the football team on away games and do their thing on the field, the half time show. Boy, do I like being apart of all that. It brings back fond memories, from when I was their age all through school. I was a musician.

So yeah, I’ve dusted off my bus and been putting on a little bit of miles lately. Last week was the start of my private school kids run also. That is a short run for me in the morning time. Actually, it’s the run squeezed in between my high school kids and my elementary kids’ runs. So technically I have 3 separate runs for the morning time. But only 2 in the afternoon (no private school kids in the p.m.).

Anyway, this week, everybody will be onboard. It is back to work, back to school. Vacation time over. Time to get back into the normal routine of things. Early morning runs up to lunch time. Then a 2 - 3 hour afternoon break time. Then I got the afternoon runs, which will then bring me home right at about 5 o’clock. Then it’s time for my 5pm numbers. There’s nothing I enjoy more than to see what happened in the market. See how they all relate to one another. Oh yeah, I showed you all that stuff last weekend. Well, most of all that I do. I couldn’t finish. But you got the idea.

Don’t get me wrong, I do look over my numbers, and the market during that lull in time that I have during the middle of the day. I can’t help it. I’m just attracted to the business. Whether it’s something going on in the market, or on my excel spreadsheets, it’s just enjoyable.

That’s all good and nice.
But the question I want to pose to myself is this.
What did I accomplish during the summer? Regarding my business?

Well, let’s see. I got to think about this. Cause I want to remember what I was thinking going into this time. Did I have any plans or goals as such?

(much time lapsing)

I went into the summer without having a big agenda. I mean, that’s kind of unusual for me, cause I really like it when I have a big project or something to accomplish. But no. I do remember, as always, that I want to be productive and make some progress for the business. However I can take advantage of the time that I have, I usually do. But, I think for a minimum, I did take advantage of the morning time. Many, many times have I woken up around the 3 o’clock hour. My alarm clock is still set for 4. If I go that late, then it’s sleeping in. But that’s my quiet time. It’s when I read. Really, that’s the only time when it’s completely silent. And I guess I can actually say, that I do get a lot of work done then. It’s called praying. Honestly, there’s nothing more productive that I can do than that.

But, I have looked back on the journal here and seen what I’ve been up to. I really tripped up during the beginning of July. What a lesson. Oh well, I guess I did learn something.

And then I produced some new indicators. The COT report was one of them. It was fun wrapping my head all around that. Sure. Was fun rereading our old thread. Good memories. But I guess it was for that time, only. Things just move on, that’s all.

I did embark on another indicator. I collected this years data on it. I’m sorry I didn’t come on in here and expound on it. Cause I don’t know if I’m gonna go much further on it. What got in the way was the normality indicator. Now I like that very much. I’ll get to that in a moment. But the one indicator that I started to explore was volume. I kind of think, somehow, that there’s a benefit of knowing what volume is happening. I got some books on the subject. I haven’t yet, but maybe I will dust them off and see if I should go somewhere with this. I do think paying attention to volume might be of some help. But I’m not sure yet.

Check this out.


In short, got every pairs daily volume results. Then on the right their daily avg’s.
On the bottom, the daily total. Then under that is what’s the daily total avg.
I guess I want to know what the volume was for the day compared to what’s average. I don’t know. Do I like this stuff just because it’s numbers? I don’t know, maybe. But then again, that’s why I’m in this business to begin with. Cause it’s all about numbers, I think. You just got to know which ones are the important ones. Right? Maybe I just need to couple these numbers with something else. I’m not all that sure yet. But, I am keeping track of them, as you can see. Well, I got all of the YTD. That most bottom RUN AVG is from this entire year.

Anyway. This summer, thanks to some good guy out there, normality is the subject I find extremely important. Bottom line, it’s a tool. It’s information. An insight into knowing what the market is up to. It’s one of the dynamics that I’m gonna continually be aware of. It’s not really a trading indicator, but I’m finding that I’m able to see more of the particular pairs this way. Cause I’m used to, and prefer, to see the market more aggregately than anything else. But, I am a trader though. And this just might help me find that one pair that I should trade. We’ll see how it all fits into the grand scheme of things. Know what I mean?

This is fun stuff.
I think that would be a good summary of how my summer went. I’m enjoying the process of learning what I need to learn. Discovering more and more things. Experiencing all of what I need to experience. As long as He’s with me and I’m with Him, I’m sure all will work out fine.

Yeah, I might not have the amount of time anymore, for such exploration. But I think I have enough to keep me busy.

This week I will be having my end of month summary to do. For Aug. It should be a lot better than last months. Boy. I don’t want to go through that again. Now that was a bad month (July). Hard lesson I had to learn then. This month was so much more pleasant. I just find it very important to do these months summary’s. That’s all.

And yeah, I do remember that, going into September every year, is when things are gonna start flying, in the market. I mean, that is when all of the big dogs come back to work. Vacation time is over, even with them. And we’re gonna start seeing some money fly. I just hope I can follow along, with my trading.

Alright Journal, thanks for listening.
Mike

2 Likes

Good morning Journal.

Wow. I just got done finishing up my Aug summary’s.
2021-09-05_08-21-55
I have 2 for each month. A trading results one (strickly for all trading results), and a broad summary (write up on what I’ve been up to that month).

I’m very happy how things are progressing. There’s no way I can show you the details. Too many. But lot’s going on. There is one thing that I got to get better at though. I need to be better prepared for when the end of the month comes. Cause this is taking way too long to get through. Looking back on the entire month can get exhausting. I have taken notes along the way. It’s just that I have to take better notes. It shouldn’t take like 2 hours to do this. I’m gonna have to work on this.

I am proud of myself for doing all this in the first place. This just might be the first year that I will have an entire year of detailed month by month records. I am happy about this. I think I will celebrate all of this at the years end. I should be able to give a quick and precise summary of each month. That should be fun. I think I do that every end of year anyway, but at least this time I will be able to see all of what happened relatively quickly.

Let’s see. What do I want to bring to light about this months summary?

I made a lot of money. More than normal. Probably made up for the very bad month of July. Well, ok then. Let me give a dollar amount. Let’s compare.

  • Aug totals - from my demo accounts
  • 4 closed trades
  • $ 2,057.09 from 4 separate 10k trading accounts
  • +5.92%, +7.25%, 0.0%, +7.04%
  • Live account - One trade = +2.78%
  • Total of 5 trades closed in this month

— July totals - from my demo

  • -$1,836 from closed trades - one demo account
  • 2 unclosed trades still running (demo)

Well, I’ll tell you the most interesting thing out of all this.
I’ve been thinking about this. And I really think I’m on to something.
This is the principle.

If you stay in a trade long enough, it’ll eventually end in the positive.

Boy do I want to talk about this.
But let me first explain what happened with this one particular trade.

First off, I need to explain my Anchor Trade III strategy.
One pair traded.
With only one rule.
It must result in a positive.

NZD/CHF — Long
Opened on July 6th.
Why?
The RBNZ was supposed to hike interest rates, remember? So, I was getting in on the run up to that interest rate decision. It was early on in the week. I thought it was a fore gone conclusion.

But, do you remember what happened? It was the next day, one day before the rate hike day, that one person got COVID and they locked down. Well, that threw the whole interest rate hike thing. Instead of hiking, they kept things the same.


Don’t forget my one, and only, rule.

The result.
Wasn’t good.

And now, there’s only one thing to do. Sit and wait this out.
This is a big reason why I had not such a good month of July. Let’s see what the end of the month looks like.


Yep. Not good.
Even lower.

Well, the good side of things is this.
IT’S NOT CLOSED OUT YET.

I have not lost anything. Technically speaking.
Realize this.
It’s only when you close out a trade that accounts get squared off. Not beforehand.
This is in my favor.
Am I down over 200 pips?
Well, yeah.
I stick to my rules. I mean, rule. Cause there’s only one rule.

Well, another month goes by.
What is happening in the meantime?
Well, I can’t trade any other trades until this finished it’s course.
I do nothing. That’s all.

Let’s fast forward to the end of Aug.


Had some hope going into Aug. Look. It went up pretty much up to where I bought it at. That was the bought up, leading up to Aug’s NFP Friday. But then look what happened. It went all the way back down. EVEN FURTHER.

You know what I’m doing, this whole time.
Nothing.
Praying.
Actually, just not paying attention to it anymore. There’s nothing I can do anyway.
But I did get a lot of hope coming into the end of this month, as you see there.

Remember my one and only rule.
Well, into this month of Sep, it looks better and better.


And there it is. Yeah, I started paying attention to it, closely, on that last day. Cause that’s the first time it went up to my break even point. As soon as I seen it being up 2 pips from where I bought it at, I took profit. Sure, I should’ve waited till end of day, I would’ve been up way much more. But for as long as this ride took…I’m not playing this game anymore.

I successfully exited out of this trade.

And for the record, this was my 8th successful trade. In a row.
This was the longest awaited trade. 41 days. Man.

Any lessons here?
Yes. And this is what I want to talk about.

It’s a principle that I think no one thinks about. But is the biggest reason why trades fail.

When you put time constraints on a trade, chances are you’re probably gonna lose. We all know that new traders don’t have the patience and strength to wait out trades. It’s the psychological battle that inevitably will take you out.

Time.

What a factor.

When we get out of a trade, it can only be boiled down to 2 things.

  • Where?
    or
  • When?

You have a lot more options when you consider the When factor.

The Where will only result in 2 options. Either positive or negative. It can’t be anything else. That’s all you got.

So, in effect, what am I doing?
I’m making the rule that I will only get out when it’s in the positive.
It’s just a matter of time before it eventually gets there.

Should I care how many trades I take?
No. I don’t care at all. I think that’s a stumbling block in the market.

Actually, the more constraints and conditions you put on a trade, the harder and harder it’s gonna be to come on out in the positive. That’s what I think.

If you think you can expect the market to act, and do something, in a certain amount of time, you’re gonna be wrong. Guaranteed.

I don’t know how else to say this.
This is a principle.
It’s something extremely important to realize. And understand.
Our market is all about time. When we do something is of utmost importance. And if we think we can operate on our time frame, as opposed to the markets time frame, then we’re gonna be in trouble.

This is a lesson.
A lesson that every trader will eventually come to realize. Whether they know it or not.
Who thinks of this stuff? Who brings all this to the forefront of his brain?
And yet, it’s so simple. Be patient.
That’ll cut down on the learning curve.

I’ve proved that I can do this (being patient).
I just hope that I can continually operate in this way, that’s all.

Well Journal, I got to run.
Sorry for all that.
Where did the time go?
Well, thanks for listening.
Mike

2 Likes

Good morning Journal.

Let’s see. What am I gonna talk about?

Well, what I really want to do is make my way around the market. I haven’t done this in a while. This is my playground area where I can do this. Not only is this fun, but I kind of need to put things into the proper perspective in my brain. I honestly think the market is changing and I need talk about it. Look. I could be wrong. Very wrong. But I’m wanting to know. The future will come upon us and this is the place that I can always go back to and see in hindsight where I was wrong, in my thinking. And then again, if I’m correct about the future of things, I will be able to come back in here and see the whole before and after unraveling.

How else will I learn things, anyway?

Let’s go down the line. I’ll start with the most important and work my way down.

The USD.
This is where we were last weekend at this time.


The USD aggregate tell. What I see here is an uptrend changing to a downtrend. I think a top was formed, and down it’s coming. The 1000 line I’m calling support broken. This was what I said. And believe. That most recent fall, I believe says it all.

What happened this week?


This was up through Wednesday. The USD got strong. It retraced the losses. Ok. That makes all kind of sense. I’m not gonna change my mind just because of a little strength. That’s how the market works. But what I’m looking at is that 1000 line again. I believe that’s now a resistance level (previously support). And now we’ve come back up to it. Just look back at that 1000 line. How many times does it bounce on here? Too many, which tells me that it’s support or resistance. It’s all the same laws that are used on any other chart. I mean hey, if it goes higher, then I know I’m wrong. If it bounces, then my theory will be correct. Which is a change from an uptrend to a downtrend. Well, I believe it so much so that I’m gonna trade this. As I stated somewhere else, this was another indicator that shouted at me for an opportunity. Let’s see how the rest of the week went (2 days).


Thursday went down (second to last straight line). Then Friday went back up half of that. But this resistance level sure did hold the line. So my theory is still intact.
Which is, the USD on a change of trend.

I could be wrong. Always. And will always have that going through my mind. But I have to keep with the theory until it changes. For instance, that support level at the 500 line could very well hold and continue the USD for a continuation of the uptrend. Absolutely. But we haven’t gotten there yet. Until then though, I’m calling a downtrend for the USD. Because of that drop. That’s nasty! I don’t know, you got to read everything else on the chart, not just support and resistance levels. How about these dynamics of how price moves. Sure does look like moving down with a purpose, to me.

We’ll see though. I just think that this bull run that the USD had going ever since Jun 1st has run it’s course. That’s all. Plus, given the fundamentals surrounding the USA, that only makes sense to me. Who in their right mind throws money around like that? I mean, come on. That’ll be the day the UK does something like that. I mean, yeah, I know that the world is watching. And even doing the same thing, helicopter money flying. But this is ridiculous. We’re gonna pay for it. The laws of physics, finance, and everything else will eventually come to roost. We just don’t know when.

Sorry.

This is my macro sentiment concerning the USD. I’m calling the present time the USD in a downtrend. And when, or if, this changes, then so be it. I’ll be wrong. Won’t be the first time. I’ll admit it. I’ll look back on this and find out where I went wrong. And I’ll learn something by it. But this is my indicator. And I believe in it.

Well, I want to put to use this other indicator I’m starting to use. Here’s a shot of the volume that took place this week.

2021-09-12_07-31-31
USD pairs. Daily results. With each pairs daily avg (on the left side). And the USD as a whole on the bottom. That daily avg is on the bottom left corner. And all I’m gonna do is compare what happened to it’s average. I just care about being more than it’s avg.

  • Monday — Aggregate = below avg day. And every pair below it’s avg.
  • Tuesday — Aggregate = below avg day.
    2 pairs above their average. USD/CHF, and the USD/CAD.
  • Wednesday — Aggregate = above avg day.
    4 pairs above avg (USD/CHF, AUD/USD, NZD/USD, USD/CAD). 3 pairs below avg (EUR/USD, GBP/USD, USD/JPY).
  • Thursday — Aggregate = above avg day.
    6 pairs above avg (EUR/USD,GBP/USD, USD/CHF, AUD/USD, NZD/USD, USD/CAD). 1 pair below avg (USD/JPY).
  • Friday — Aggregate = below avg.
    2 pairs above avg (NZD/USD, USD/CAD). 5 pairs below avg (EUR/USD,GBP/USD,USD/CHF,USD/JPY,AUD/USD).

I’ll tell you what I think is most interesting.
— The USD/CAD pair.

  • 4 days above avg. The most of every pair. Monday was a holiday, or else it probably would be 5.

Let’s remember what happened with the USD this week. Aggregately speaking.
It rose up the entire first half of the week, through Wed. It was more of less avg volume. Then mid week the volume became greater. Well then, that was when the change, or turn, occurred. Then the volume decreased towards the end. Maybe I should write down these possible volume principles.

More volatility occurs during trend turns.
Less volatility occurs during trend flowing.

I don’t know. We’ll have to see if those should stand, as principles. I just don’t want to forget about this possibility, that’s all.

But the rest of the week, I feel, went to the Comms. Most of the above volume went to those pairs. And my theory of more risk on, in the market, just might be true.

I wonder whether this is true or not.

Risk-on results in more volatility.
Risk-off results in less volatility.

I have no idea. But I want to keep this in mind. I guess it could go either way.
Greed = more volatility?
Fear = more volatility?
Trend = more volatility?
Changing trends = more volatility?

This is what I’m out to answer.
Alright, let’s move on.
I’m done talking.

The EUR.


The trend is up. Long bias. Can’t be anything else. Cause they are not depreciating. It’s been that way all year long. And frankly, I’m getting tired of saying this. Cause the whole point of this is, to buy the EUR, not sell. Simple as that.

No changes are being signaled.

The GBP.


Technically speaking, their a bull bias. Uptrend in tact. But I got to say. It just might be wavering lately. Not making any higher highs. Leveling out. Took a dip this past week. But bounced right back in it. Modestly that is. So, the trend is up, but not as strong as it used to be, as it has been all year long.

The CHF.


Well, along with the USD, I called this a change in trend last weekend at this time. And the way it went this week, confirms the theory. It bounced at some support, and we need to see where it goes from here. I knew this was premature to call a change in trend, but I had to go with it. So far, so good. A double top formed.

Maybe I didn’t officially make the call last week, in here anyway. But I made these trend changes. Look.

2021-09-12_08-44-44
I go a week at a time. I won’t change trends mid week.

Moving on.
The JPY.


The trend is low. Sure, they tried to fool you with looking like making a floor for a good many months there. But nope. The market is keeping with the prevailing down trend that’s been in place the entire year. Simple as that. And for the record, I never called a change in trend, until it would reach that -8000 level line. It never did. Got to see it first, right?

Now it’s gonna get interesting.

The AUD.


I did change their trend from low to high last weekend. But they took quite a dive this week. And I am calling that -3000 line the resistance / support level. And that’s where they’re at right now. Sure, a bit under it at the present moment. But I’m calling where we are at the inflection point. Surely this coming week will be the tell. Will we have the resistance level turn support (-3000 line)?

That’s what I think.
But the market will tell me the truth.
If I have to change back their bull trend to bear, then so be it. But I got to see it first.

The NZD is some kind of factor, also. Little brother just might have something to say.


Uptrend. They broke up and over the -1500 line. I was calling that resistance.
But what divergence to the AUD, huh? But this is the reason why I think the Comms will take over the bias, broadly speaking. It is this chart. The NZD is strong. Their trend has finally changed. Up to this point anyway. It’s been a long time coming. Their down trend has been ever since the end of Feb. So. Now’s a good time for it. Maybe it’ll go all the way to the end of the year. We’ll have to see.

Look. It’s just what I’m seeing right now. Can they go to where they started the year from? That would be from the 0 line. It only takes about 2 weeks for them to consume 1000 pips. Got plenty of time before the end of the year for that to be accomplished. No problem buddy. Let’s just see what happens.

The CAD.


The down trend continues. And I won’t call anything different till this chart reaches above the 0 line, minimum. Man…I just don’t know what happened to the CAD. It’s not because of the oil, is it? That’s been a mostly bullish market. And being the favored trading partner to the US, that shouldn’t have given them reason to fall apart like that. So therefore, the only reason I see is from their own internal fundamentals. They rely so much on their export business that maybe it’s the supply chain issues. I just don’t know. But something’s got to be behind all that. Maybe even their own central bank, who knows. All I know is, it’s a trend. And that’s what we like the most…a trend to continue. Maybe that’s what they want, a devalued CAD. Cause we all know that that is not always a bad thing! In fact, that’ll help with their trade competition.

Anyway.

That’s all of them.

I’m not going to change any of these trends. The only one in question is the AUD. That’s gonna be settled this coming week.

And if I see a rising AUD, then that’ll be my cue for a trade. Long AUD.
But then short who?
Well, who’s trending low?
I showed you all their stated trends above.

There’s 4 of them.

  • USD
  • CHF
  • JPY
  • CAD

Ok fine then. I’ll go through these with you.
Let’s see. From the top.

AUD/USD.
I first look at the weekly chart.


Nicely looking. Those 2 weeks of gains tell me the buyers have been in town. And a nice retracement last week brings it back to a cheaper place. Actually, is it sitting on some kind of level now. If it’s a resistance level (downtrend in place), then it should go back on down. But if it turned into a support level, then a change in trend would occur. Well, that’s what I’m thinking is going to happen.

My trading plan consists of waiting till a minimum of Wed to see the direction. So, I’m not gonna chance anything until around then. But how about the daily chart.


There’s, easily, a hundred pips up to that most recent swing high. Anything is tradable in between now and that point. No doubt. But I got to see how the week goes first.

Next.
AUD/CHF.


Kind of looks the same as the previous. Weekly. But then again, this might be sitting up higher than where the support level is at. I think it’s at .6650 area. And my o my are they 2 pretty big green candles. Telling me some good buying been going on there. No wicks. Right?

Daily chart.


Well, this latest swing high reaches higher than the previous swing high. Encouraging. Telling me that it can go higher. Maybe the next real resistance level is at the .6910 area. So basically, I think it has room to go, if it wants. So again, promising. I kind of like this better than against the USD.

Next.
AUD/JPY.
Weekly.


Same thing. Came back down to the level (one of them). That retracement surely makes for a good place to get in, if it starts to move up. But look at the Daily chart.


I think anything between 81.00 & 82.00 looks good. But that daily wick spike up looks good. Sure, someone would say that it’s a hammer (or something like that). Which signifies a move down. I don’t necessarily agree. At all. I think price tested the waters up there. And could possibly go back up there. If I was a day trader, this would be on my radar, for sure. But again, I have to see how the week is playing out first.

Time.
It’s the biggest factor in trading.

Not where.
But that happens to be what I’m talking about right now. Is where.
Time is more important to me though.

One more.
AUD/CAD.


This definitely is at a major level. It might stay around here for a time, who knows. If, somehow, it takes off from around here, then I’d say the trend would be strong. Either way. North…a definite change in trend. South…a continuation. But I think it’ll hang out around here for a while. Someone likes it here. We’ll have to see.

Daily.


I don’t see a whole lot. Other than the fact of the 20 about to cross over the 50 soon. As an indicator, that should mean something. But in regards to price action, I got nothing.

Zoomed out.


I don’t know. I’m not a fan. Price action doesn’t show me anything. Ok. .9540 area is where it’ll shoot for next, if it wants to go high. 200 pips away.

Honestly, I’m afraid to trade the CAD. Let’s just say that there’s better chances with many other pairs out there than these guys. I mean, are they one of the Comms currencies? Sometimes they are, sometimes they aren’t. Their just not that cut and dry anymore (like they used to be).

Ok. So. That’ll be 3 pairs on my radar then.
See. This is my preparation for the week.
Couple things.

  • Risk on to make a real come back.
  • Need to see the market flow in the first 3 days of the week.
  • Have my 3 pairs that I’m particularly watching.

This about sums up my trading for the week.
If all hell breaks loose, and we have the safe havens take over, then so be it.
I don’t mind being wrong whatsoever. It’s just that I need a certain scenario to play out. If I don’t see it, then I won’t trade. Simple as that.

And hey, if I have to change all my trends back to where they were 2 weeks ago, then I will. I’ve been wrong before, I will be wrong again. But if I am, I will get to the bottom of why. Maybe the market doesn’t know the breadth of how dire the world’s situation really is. And then go back to some big time USD buying, JPY buying, and CHF. Could happen, but I got to see it first, though.

I follow.
Not speculate.

Alright Journal, I’m done babbling.
Sorry for all that nonsense.
Thanks for listening though.
Mike

1 Like

Very cool content mate following!

Good morning Journal.

Let’s do some diagnosing.

Speaking of that. I have to tell ya Journal, I’m excited about this book I just got yesterday. Man o man, do I like this book. It’s been quite awhile since I read a good one on the markets.

Geopolitical Alpha.
Marko Papic

It was just written last year. These are best kind of books I like. Up to date and current with the events. But, it’s coming from the mind of a chief strategist. How he thinks and his framework of a model. He laid this out early. So, by the end of chapter 2 you got this foundation of a way of thinking about how to view what’s going on in the world.

It kind of reminds me of George Soros and his thinking that made him famous in his battle with the Bank of England, back in the 90’s. It’s that forward thinking that he was convicted about. It’s kind of like that. It’s how a great mind thinks.

Basically, he has a framework laid out. It’s like a guideline to follow when it comes to realizing what’s really important in the arena of geopolitics, and what’s not so important also. I would say their like principles. I guess that every chief analyst would have some kind of principles in which they follow. Cause they have to make decisions on where their money is gonna go. And you don’t want to be wrong on assumptions regarding world leaders. Right?

It definitely has to do with macro thinking on what’s going on in the world today. There’s pitfalls you don’t want to fall trap to. If your thinking isn’t right, then the money that follows could be at serious risk.

I’m thoroughly enjoying this book. Getting insights on an intelligent mind is priceless. And it’s stuff I hope to remember when I make up my own mind on important world happenings. That’s all.

Ok.
Sorry about that.
Where was I?

Oh yeah, I want to wrap my mind around what’s going on in the world of currency’s.

I’m gonna try to get more of a complete picture this time. It’s the before, during, and after perspective. I’m gonna go down the line, as usual, but incorporate these these points.

The USD.

I’m starting where we last left off. Last weekend at this time. I’m calling for a continuation of this down trend. Cause I’m seeing the 1000 line holding as resistance. Well then, what happened this week?

2021-09-19_08-05-28
In the first 3 days of the week, not much. The USD (white) only is showing more negative numbers. Actually, Wed’s EOD they are the most sold currency. Ok, so then. Looking like the down trend is gonna keep.

Moving on.
Thursday, EOD.
2021-09-19_08-12-00
Bam, there it is. The USD comes in strong. The most bought up currency (Isn’t that just like the market? Going from one extreme to the next, the very next day). And look at the amount. Quite purposeful. The only other moving currency that day was the CHF. But that’s another story.

Well, let’s go to the chart and see how this looks on my big board.


Well, of course. It comes all the way up to this resistance level. Again. Sure. Why not? Well then, we got one more day to go in the week. Remember, we play the week as a whole. Nothing more important than that, in my mind.

I definitely am thinking that this is gonna come on back down. Know why? Cause it has happened so many times before. I’m not worried. Although I am trading something other than the USD. I had my sites on the AUD/CHF pair (broke even on that).

Let’s see what happened on Friday.
2021-09-19_08-22-02
Ok. It happened. The USD came in as the most bought currency that day. Again!
And as I have there underneath, the weeks cumulative totals, the USD was the most bought up currency for the week. All that happened in those last 2 days. And while we’re at it, the JPY ended the week second most bought currency. Which points to a more safe haven buying bias for the week. Except the CHF. Something happened to them. I think the SNB didn’t want to be apart of it. They diverged away from the safe havens and the EUR. I’m telling you, they don’t want to be strong.

Anyway. Back to the USD.
Where does this leave us now?
Well, let’s go back to the big board again.


I remember seeing this on Friday late. I can’t believe it. Of course, I’m sitting here in denial. I surely thought that the USD was on a down trend. Good thing I didn’t bet on it. But, it’s time to reassess.

The question is…what’s the bias for the USD now?

This is one day into it. Very possibly Monday can come along and correct all this and come back under the resistance level. And then it can continue on with the down trend. Sure. It’s possible. A one off.

Or. We have a continuation from the up trend that the USD has been on ever since the beginning of June. I could have been wrong and should have called the 500 gridline the support level that needed broken. Cause surely it’s plausible that the big climb up just went back down 100%. That can happen in a trend.

Technically speaking, above the 1000 line is bullish and below that line is bearish. Simple as that. And as we sit, the USD is bullish. We’ll just have to see whether what happened on Friday was a one-off or whether that’s really the direction in which it wants to go in. Up. Strong. See? The market is not always cut and dry. Looks like we need a little more time. Probably through to the end of the month.

Go ahead ask me.
Will I change my trend determination, for them?

I have to.
Remember, I follow.
This would be the difference between speculating and following. It doesn’t make sense for me to switch their trend determination just yet. But I have to. I don’t want to. Look. If the market didn’t want the USD to be getting this strong, then I don’t think it would have made these last 2 days in a row to be the most bought up currency. There would have been some profit taking on Friday. But nope. It kept going straight up. No stopping.

This is called following.
Now, if all this changes next week, then so be it.
I will follow and change things back again. Oh well.

Let’s move on.
The EUR.
This is what we were looking at coming into this week.

And now the latest.


Still on the up climb. Surely not falling.
It’s the same old story. No changes to the bullishness story they’ve been on since March 17th. I wish all of them were this easy, of a trend tract.

What am I doing with all this?
Do you know what I’m doing?
Simply, determining the direction.

Getting the direction correct is one of the important matters in trading.
It’s not the most important factor though.

Time is the most important factor.
When to get in, and when to get out, is most important.

If you were trading the EUR for short you would have had a much tougher time than if you were trading them long. The bias is for long.

Moving on.
The GBP.

Are they wavering?
Let’s see what happened this week.


Nope. Their not wavering. Their bullish trend is continuing. This week pulled them up even a little farther. And it’s the same as the EUR. All year, heading in one direction, up.

Let’s get into something more interesting.
The CHF.
Where were we?

You should know that they didn’t have a good week. How’s the big board look now?


The newly formed down trend is definitely more confirmed this week. I wish the USD was this easy to see. But these guys are not having anything to do with the safe haven buying that’s been going on lately. Right? Nope. Can’t lump them in with that. But they’ve been contributing to how mixed the market has been lately. It just doesn’t make sense. What can we do though? This is how it is.

How about the other safe haven.
JPY.

This weeks results.


Yes, it is a safe haven currency. And has climbed back up some. But surely not enough to change it’s bias. It’s low. What a long way to go to make a change in this direction. This just tells me that the JPY is not the currency to go with for a safe haven buy. Not this year anyway. I would have to start seeing some straight up lines from here to start going long the Yen. But not until that time though. No way.

How about the AUD.
Last week.

Ok. So. I got the AUD on a high bias now. I changed their trend from low to high. That’s my reasoning. And this week will tell me whether I’m wrong, or not.
Let’s look.


Ok. Well. Here’s another one I have to change. This is not trending high anymore. It’s not. What can I do. This broke down under the -3000 gridline level. This has continued on with their previously long down trend. The risk on sentiment that I thought would be coming just didn’t. Here’s proof. But it does coincide with what the USD is doing. The opposite. The USD is going back up and the AUD is going back down.

This is currently what’s going on. And until it changes, it is what it is.

The NZD.

This should be interesting. Did they follow in the steps of the AUD this week?
Let’s see.


No. They didn’t. The NZD is still on their up trend. This is not falling.
It’s all relative. Look up above. They did come in at -3.56% for the week (3rd from last). That does look pretty bad. In that context. But, in this context, it’s a different story. Their not retracing all those gains made previously. Right? I mean, their elevated. I’m not altering this stuff.

And I guess I will continue with my previous statement. It’s this chart that is still telling me that risk on is still in the air. Somewhere. Just don’t know when it’ll happen. And if not, then these guys got to start falling much more. It’s just what I see. That’s all.

Last but not least.
The CAD.

Where did they go this week?


Their trend continues.
Again. Some of these currency’s trend direction is easier to see. Nothing should have told you to buy the CAD ever since their trend turned south back at the start of June. That’s if you’re a trend follower.

Ok. Looks like I got all of them.
Now what?
Well, I got some changes to make.


Got the stated trends above. There’s 2 I have to change.
And that’ll change the basket of trades that I want running in the market. It’s the demo dynamic that I need to see carry out in the market. High trend against low trend. Those are listed below. 16 pairs running perpetually in the market.

That’s nice. I know.

Anyway.
Boy Journal, I got to tell ya. I’m finding very good stuff regarding my volume indicator. I can’t go into it now, but soon enough, I think it’ll be a very helpful indicator for me.

Ok. I’ll bite.
Just a sample of what I got so far.
But first off, this is what I’m dealing with.


I get this from Barchart.
Basically, looks like my numbers are the amount of contracts traded in a day. And it looks like it’s coming from the futures market. All of these pairs.

But check this out. The current month of Sep.


These are all the pairs. But arranged in the manner to see what the currency as a whole is doing. The sum of all it’s parts. Well, that is what’s boxed in. Going across.
Let’s look at these. The USD. Everyday this month, their 7 USD pairs’ volume amount has resulted in below average. Cause it’s in red.

The daily average volume amount is counted from Jan 2020 to the present.
I’m averaging these volume’s by the days of the week.
There’s 89 Mondays since Jan '20 to the present. So all of my Monday volume results will be specific to Monday’s only. Same goes for every other day of the week.

Like I said, and believe, time is a crucial factor. So what happens in a specific day of the week should be counted as such. Apples to apples and oranges to oranges.

Getting back to the table above.
All of the currency’s except one has resulted in below average days this month so far. Can you see which currency is above average?
The NZD. In green.
They’ve had 7 above average days and 6 below average days.
I think this is telling. I think it’s telling me there’s above activity happening with them.
And what do we know about what’s going on with the NZD?
Well, they changed their trend recently. It’s all up above.
This is another reason why I think that the risk on sentiment hasn’t really disappeared. It’s hidden. But there. What else explains a higher than normal volume amount?

I’m just scratching the surface. Cause I want to start getting into which specific pairs are trading higher than normal volume. And maybe that can possibly lead me to some trading decisions. We’ll have to see.

This is fun stuff.

Thanks for listening Journal.
Mike

1 Like

Good morning Journal.

Let’s see, what’s going on?

Well, honestly, a lot of the same thing.
Everyday comes and goes. I compile the EOD numbers. See where things stand. And nine times out of ten I’m sitting out on the sidelines, concerning trading that is.

Seems kind of boring.
But it’s not.

What I should be asking is “What’s God doing?”

Yeah, I do ask myself that all the time. Let me see, when it comes to life, a whole lot. I mean, I see what he’s doing everywhere I go and whatever I’m doing. No doubt. Man…don’t get me started. I got story after story, lesson after lesson, on what He’s showing me. I could be typing here for a very long time if I went with this topic. And I would enjoy it very much.

But.

He is with me on this stuff also. I’m not alone here. Absolutely not. I mean, sometimes I do wonder where this passion has come from. Every since my inception into this business, it’s been full on for me. You just feel it down into the core of yourself. You just know it’s you. It’s like I found myself. After 45 years of being on this planet, when you get to the revelation of this, it’s a very exciting thing. Finding yourself is very fulfilling. Of course, that was 9 years ago. But every step of the way has been inexpressibly wonderful.

Good times. Bad times.
Challenging.
Puzzling.
Interesting.
Humbling.

But God is God. He made me this way. And if I don’t see that it’s His work being done within me, then it’s all for nothing. In fact, nothing in life means anything if you can’t see Him in it. Cause when it’s all said and done with, all (real) purpose in life comes from Him. And there’s nothing better. I know it. And believe it.

“Delight yourself also in the Lord, and He shall give you the desires of your heart”.

That’s nice.
So.
Let me ask the question again.
What’s God doing? With me.

Well, let’s see.
I guess I have to think about this.

It’s not about the trades. Cause that’s where my mind goes first. Am I winning more? Or losing more? Is it about my trading?

No.

Sure, those are aspects of the business. There’s a ton of things that are important in running a trading business. But I think He’s doing more important things…

I’m learning how to walk with Him.
That’s putting it broadly.
But, just like in everything in life, it’s knowing how to live by faith.
Even concerning the market.

What attitude should I have concerning what’s going on in the world today?
How should I be looking at the data, that I collect?
What kind of mindset does He want me to have concerning my business?
What’s important and what’s not so important?
What does He think?

Well, I believe those are all answerable questions. I mean, that’s what it means to walk with Him. It’s the journey. And if it isn’t with Him, then it means nothing. I know I can’t go wrong with following Him. Absolutely not. God’s not so shallow as to think it’s all about winning or losing trades. As long as I’m on His wavelength, I know I’m gonna be successful. But, I have to say, this is the journey I’m on. It’s called His will be done. Simple as that. Nothing is more exciting!

I’m sorry Journal. But I have no other outlet to talk about this stuff. But…I got to tell you. You know what keeps me going? He gave me a personal word. It was a couple years ago. It was so profound that I wrote it on my wall in the office. It’s still up, today. But, He told me this. “I am closer to you than you think”.
Do you know what that does to a person?
Now that is inexpressible. There are no words that come close.

Now.
Back on down to the earth.
And the market.

I do have to say that I’m very intrigued about this newly found indicator that I’ve been following. Journal, I’ve been telling you about this. This is extremely interesting to me. And it’s continuing.

Volume.

I’m compiling the back data on this, but it’s taking some time. I have the month of Sep and Aug all done. Let me show you what I think is interesting.

Here’s the month of Aug.


On each column going down is a day that shows all of the pairs. The numbers are the volume of shares or contracts traded that day. All of the boxed up numbers are the aggregate for each currency. It’s simply all of their 7 pairs added up. And then each volume number is colored. Red for under the avg. Green for above the avg. The average is for each particular day. That’s opposed to adding them all up and totaling them. I believe that each day of the week should be counted under it’s own. Monday through Friday is the only possible groupings. So, if it’s a Monday, then it’ll be counted and averaged to all of the Monday’s, only, since 2020. I think we’re at around 91 of every day of the week, to date. The same goes with the other particular days of the week. But, I’m using this era. The new era that we now live in. So you should realize that the average shot up really high last year during the spring time. And therefore, what’s considered average would be a bit higher than previous years and days.

Well, you got a shot of every pair during Aug. The totals are on the bottom. Those totals are everybody (28 pairs). And then they are compared to what the avg is. Again, the average is by their particular days. But you should be able to see that Aug 19th was the only day that the market summed higher than the average. And then just look above and you can see the break down of which pairs were higher than their particular averages. Also you can see and compare each currency’s aggregate. During this day it was only the Comms that ended up above their average (AUD,NZD,CAD).

Look. I understand that we need to look at the months by themselves. Aug is during the summer time. Not a whole lot going on when money is away on vacation. Like I said, I’m just starting on the data collecting. This is gonna take some time. It’s just what I have so far.

Let’s look at what happened this month.
It’s quite different.


Much more green around huh. Well, split this into two separate times. 1st part up through the 17th. During this time the market, as a whole, did not produce anything above average. But, there was one currency that did, aggregately. See which one?

The NZD. Well, do you remember me telling you a couple weeks ago how the NZD was rising up to the top? They were. Their longer term normality numbers did spike up during this time. I think there’s a correlation with this. This is all I got up to this point.

But look at the rest of the month. We got volatility. Above average volume. Both for a lot of currency’s as a whole (aggregate) and with the individual pairs. But, to look at the market as a whole, there was only 2 days that the market volume ended below what it’s average is (for that particular day). That’ll be the 23rd and the 24th.

Well, there’s a lot of information to be had. I’ll tell you what I think.

  • The market really moved. Is this because of the end of month, and quarter?
  • No currency has higher aggregate volume than the NZD.
  • The CHF pairs against the Comms are the biggest volume pairs.
  • The very last day resulted in every single pair above their average. Actually, this was Oct 1st.

As I stated before, I’m looking to answer the questions of:
— Does it mean anything whether they have an above average day or not?
— Are there correlations between something trending and higher than avg volume?
— Are there correlations between normal trending days and volume?
— Is higher volume a good thing or not?
— Is there another way to measure volume other than above or below avg?

Look. If I can get only one question answered it would be this…

  • Are there any correlations between what’s trending and volume?

And I’m talking about after the fact here. Yes. I said it. I see this as a lagging indicator. It would be nice to understand why a certain amount of volume occurs. I don’t know…maybe less volume means something also. Does this indicate the path of least resistance and that’s the direction the market really wants to go in? I don’t know, something like that.

I will be looking for these answers. So. Between the back testing, and the forward testing numbers that I will run will, hopefully, shed some light on the subject. Maybe there is no difference in the amounts of volume that come out. If this stuff is no better than random results, then I would like to know that also.

But I think knowing the direction the market wants to go in is very beneficial. If this will help me with that, then I’ll keep it. If not, then so be it. I don’t want to be weighed down with nonsense stuff.

Alright Journal.
That’s all I got on the subject, so far.
Keep you posted on anything enlightening.
Thanks for listening.
Mike

2 Likes

Good morning Journal.

Let’s see. I got to wrap my head around what’s going on in the market.
I know it’s been a few weeks, but I think it’s a good time now. Hopefully the dust has settled after that last quarter, and a running start to this one.

I need to walk my way through this.

The USD.


I divided up the year by the quarters. Since we’re starting the last one, I wanted to see what it all looked like. Not that things go by that time table, but was curious. And I see that we ended this last quarter on a high. Actually, the highest point of this year. So. I’ll just put out what I think are the important facts.

  • The USD is presently in a bull market. The bias is long.
  • The 1000 line is the dividing point. Above = bull. Below = bear. Lower than the 500 line is definitely a bear trend.

I stole this idea from the BabyPips data. It is another perspective to keep in mind.


Well, this is a closer view of their run up to the end of the quarter. They have been correcting their recent gains (pips). Totally normal. But. Is this their last hurrah? Or just a rest before more of a continuation of their bull trend?

Let’s throw in some recent comparison.
2021-10-10_07-00-23
Top table is the monthly running. Bottom is single day results.
Well, NFP Friday just occurred. Oh, that’s right. It wasn’t a good report. Below expectations. And well, you can see the run up to it. Looks like the market was seeing it coming. Cause their dragging bottom, along with the Yen.

Those are some small numbers. I mean, only Friday was anywhere close to normal (for the top and bottom anyway). How about a look at the volume. Maybe I can get some kind of clues to what’s going on.

2021-10-10_07-09-41
2021-10-10_07-10-29
The volume has been higher than normal, for most days. On the very bottom shows the market as a whole. It’s total is compared to what is the average for that particular day. Green is above it’s avg. Red is below. And those red days are ending up quite close. It’s all relative. But you can’t argue that the market is moving. We’ve definitely moved into a higher volume environment than what we were in.

Back to the USD. It looks like if their aggregate volume (boxed up row) is above average, then the market as a whole ends up above also. Makes sense. But that wasn’t the case on Friday. They ended up above, but the market ended below. Kind of close though. Maybe that means nothing.

I’m still puzzled how the NZD ends up being above average, like, everyday. I’ll have to save this till later.

What else do I need to know about the USD?


Here’s my normality perspective. At the present time all 7 USD pairs are trending strong, on their 20/50 EMA indicator. You can see that on Thursday of this week it changed to every pair (7). It was 6 pairs for some time. Guess who was the only other currency stronger at that time? The NZD. Not anymore. Let’s look at that pair.

The NZD/USD.


Well, I was gonna post a pic of their chart that matches these numbers. You know, the ones with the lines and such. But I just can’t do it. I’m not gonna do what everyone else does. I don’t even like to look at them. The answers are not there. I’m sorry. If they were, I think I would have discovered them by now. Cause, for every which way someone could point out the direction it should go in, I can point out the opposite direction it could go just as well, technically speaking. It’s pointless in my mind. I’m not buying it. I guess I’m changing. I honestly don’t like looking at charts anymore (I haven’t for quite awhile now). Again. The answers are not there. That’s my belief.

The whole point up there is just that the USD has gotten stronger than the NZD. That’s it. And I can see by how much. And when. This is the only pair out of the seven that comes the closest, therefore you would think it would be this one that would change back if the USD got weaker again. That’s all. This is the only important information I will get out of that perspective.

How about this.
2021-10-10_08-17-03
The big difference between what’s counted is that on the running %'s, the CNY is counted among the participants. They are not counted when I add up the pip count. I’m not gonna count the CNY pips. Those are different. Even different from the JPY way. Now the % count is a great common denominator. But that’ll make 9 players for the %, and 8 players for the pips. Their charts are not gonna match up.

And it’s not looking too much different in regards to what the trend should be. Like one saying bullish and the other saying bearish. No. But they are different. See the bottom one? This last spike higher hit the years top for the third time now. Ok. I’ll note that. But the top one shows making higher swing highs. Is different. I know.

Journal…don’t tell me to go back and make it all equal (8 currency pip results against each other & 8 currency % results against each other). That would answer the question of which method should be relied upon more. Sounds like a lot of work. I did start out in '18 with the %'s of the 8 currency’s against each other. But in '19 I wanted to include China. That took a lot of work to undo. I don’t want to do that again. Plus, I need to keep my eye on what the CNY is up to. Therefore it’s worth it.

Alright. I’m done with the USD.
Who’s next on my radar?
Well, after what happened this week, I think I need to look more closely at the CAD.
They got strong. How strong?

2021-10-10_08-48-47
Boy, when they turn the bend, they sure turn the bend alright.
Well, I was counting them bull if they went above the 0 line, on the pip count. Yep. That happened this week. Therefore, at the open, I will count them as trending high. I got to switch my basket of trades that I let run, on demo. This is how you follow. I didn’t know this was gonna take place cause you can see that they can have some monster up days. Just don’t know how long it’ll last though. Well, they broke up and out of that down trend they’ve been in since, we’ll call it, the beginning of June.

Ok. Change in trend. You don’t get any bigger changes than that.
Here’s a shorter term look at when it all happened.

  • 20th - 24th = +760 net pips
  • 27th - 1st = +462 net pips
  • 4th - 8th = +993 net pips

This is how I see it. No one could have called the bottom there around the 20th, 21st. The week of the 20th - 24th was the very first time we seen the light of day. Cause remember, their still on their bear trend at this time. All they did was retrace a lot of losses then. Then the next week, 27th to the 1st was nothing but profit taking for end of month and quarter. We didn’t even know at this time that their bear market would have changed. It’s only what happened this past week that told us, technically, their on a change in trend. And their employment report surely agreed with that sentiment. The market always seems to know what’s going to happen shortly. I call it the run-up.

Now, you got to know that the market participants, probably right now, are looking at this and thinking that there needs to be a retracement from all those pips. Like those counter trend traders. It’s an opportunity here, right? Cause believe me, not everyone is looking at this and thinking of jumping in on the change in trend. You got those who wait for break and retest action. Right? They want confirmation before they put their money on the line.

We just don’t know how strong of a trend this is gonna be for them. Believe me, these days, anything can happen. But it’s always best to follow along. And also I think the fundamentals line up with that. Just look at Mr. Oil. Their employment numbers. And what’s going on with the US also. The clue is, is nothing but higher at this time.

Will they be the new top dog?
Well, let’s see what’s been going on this year so far.


Yeah, you definitely can’t count them out.
Check out what their highest looked like earlier in the year.

They do have it in them. The rest of the year could be very interesting. And as I look at that table, look at the divergence between them and the USD back then. The CAD was way stronger than them and even the Comm brothers.

They have it in them.

Speaking of the GBP, let’s look at them. I think they might be falling apart. I don’t know.

2021-10-10_10-23-16
Well, the lower % chart shows a bleaker picture. Even the top is not making higher highs, that’s for sure.

Yeah, I got to say, it’s not looking good for them. Look at that last real steep dip they did at the end of last month. Looks quite nasty. That might be a sign of things to come. Let’s see exactly what kind of drop that took.


Well, it was pretty bad. But they sure do know how to bounce back fairly quickly.
I don’t know…seems like their struggling. Let’s see. Where would I count them falling into bear market territory?


On my chart here, if I see them (their aggregate pip count) fall below that Sep 3rd low point, then I will consider them in a bear market.

Hey…it’s been a long year. They’ve been bullish every since the year started. I kind of think their exhausted. All I’m doing is watching, that’s all. Watching and following. What I do is in response to what the market does. But in the meantime, they still are in a bull trend. When that changes, if it does, then I’ll be the first to tell you.

What else.
Can’t go without looking at what the Comm brothers are doing. Right?
Let’s see. The AUD was supposed to be getting stronger. Well they had a good week, anyway.

2021-10-10_10-44-12
Now this is tough. It goes like this. Big bear trend for most of the year. Hit bottom around the middle of Aug. Then makes a break out. This occurred for the rest of Aug and into Sep. But then it drops back into the previous bear trend area. As it falls during this time, during September, you’re not thinking it turned bull yet. It’s more of a continuation and a remembrance of where they were. Bear. But now we got a climb going on. So…technically speaking…they would still be in their previous bear trend until it would attain that previous swing high level. Well, on the % chart, we would pretty much be at that level now. Got a ways to go on the pip chart.

Of course. It’s always the case. We need more time to play out, for this one.
Are they trying to carve out a big bottom here? Seems like it. It just takes time for it to be revealed.

And now the NZD.
This isn’t gonna be pretty.
2021-10-10_10-57-14
Yeah, they took a drop also. I guess not as bad as it could be. Cause they didn’t fully retrace their previous gains. Well, it is similar to the AUD. We need more time to play out. It could go either way.

Not even the interest rate hike can boost this up. That’s bearish if you ask me. I just don’t understand that, at all. Unless it’s a delayed sort of thing, it doesn’t make sense to me. But, time is the biggest factor. We’ll have to see if the money will eventually find that trade. The interest rate differential trade, that is.

Let’s take a closer look.


They raised their interest rate on Oct 6th.
Ok. That’s nice.
I guess that’s what the market said also.

I didn’t put up the AUD close up. Here they are.


Wow. Well, they were similar up until Sep 3rd. Then begins the divergence. See it there? You have to compare those 2 charts.
Why don’t I just put them on one.

That’s what we got, concerning the Comm brothers.
Specifically —

  • AUD — Bear trend. Until the pip count over takes the previous swing high.
  • NZD — Bear trend. Until the pip count climbs above the previous swing high.

Which, for both of them, is where they were at on Sep 3rd.

That’s all I got.
All I know is the CAD is moving. We’ll have to see what kind of affect that has on the USD. We should be seeing this soon.
Remember that the volume is on the high side.
That means something should happen.

Alright Journal, thanks for listening.
Mike

2 Likes

Good morning Journal.

Let’s see. Where we gonna go today?

Well, since I have the opportunity to, we can talk about my trading. There’s a lot of good and bad about it. Trust me, I have a lot of work to do on this, but I just might be on to something.

Look. This is nothing new, to you Journal. It’s just that, I can’t come on in here every weekend and talk about my trade. Cause most of the time it’s nothing but bad news.

Let me start from the beginning, again.
This is how I trade.
Specifically, this is called my Anchor Trade III trade.
It’s simple.

First off…the whole entire point of me trading in this particular way is to prove whether I can trade. See. I keep a record of every trade that I’ve placed. And that is what’s gonna be the proof. If someone comes up to me and asks, “Are you a good trader? Or are you a good talker?” I need to be able to prove it. I need evidence.

In actuality, I really don’t care what people think. In fact, if I can get away with it, I wouldn’t want to be talking to people, period. I mean, in a sense. Sure, we all need some kind of interaction. No doubt. But I’m talking about the need to confide in people. Have them to think a certain way about me. Proving whatever kind of skills I can have. It’s the human way. That’s all. It’s how we all relate to one another. We’re always trying to make ourselves look a certain way.

I don’t care one bit about that. What I do care about, more so, is whether I’m a true trader. There’s a lot that goes into what being a true trader really means. Trust me, a lot. But here I’m talking about whether I can come up with a strategy in which a trade will end up in the positive. Most of the time. Actually, all of the time (you’ll see why I am saying that shortly). And to be able to prove it over and over again. Basically, I just want to know for myself. In all honesty. Deep down inside. I want to see how I did it all on paper.

All that nonsense is what brings me to this particular strategy.
And here it is.

— Trading one pair.
— One rule only. The trade must result in the positive.
— No constraints on the trade. No stop losses. No take profits. No time table.

How easy and simple is that?

I’ve been on this journey for a little while now. I’ve documented many of these trades in this journal. And it’s continues.

— I started this Proof of Concept on April 29th
— I have 13 documented successful trades (no negative resulting trades)
— That’s one trade at a time (never had 2 trades open at one time)
— 2 trades resulted in break even
— I’m currently on the 14th trade - is running still

There’s good and bad to it. But before I get to those points I’ll show you what the present situation is for me on this current running trade.

Journal, I’m sure you remember the last trade I had. I gave you the scoop on that one. It was quite a story. Well, let’s just say that this is a carbon copy of that.

From the beginning.
NZD/USD long.
Opened this up on Sep 23rd.

This is the second time I had in mind to trade the RBNZ rate decision. And this is the second time I failed. Miserably. I’m thinking I’m gonna remember this now, moving forward. In any case, it seems like I’m missing something. I’m going after a currency that the market is not!

This is what I was looking at when I started on it.


Daily time frame. Basically, looking back on this price action, we had a break up and over some pretty good resistance level. And it has come back down now to retest it. Ok. That’s your standard run-of-the-mill scenario. Don’t forget. Previously they had another interest rate decision that was supposed to be hiked. But at the last minute, someone contracted COVID, and the deal was off. I told you all about that story before. And here we go again. This time all the analysts are agreeing that their gonna hike rates. The date is Oct 6th. Ok. We got some time. So look up there. What makes more sense than to see this fractal story move higher and higher? That’s all I see. I mean, even that last candle that I just got in at was a nice big green candle. See the triangle of where I got in at?

Well, you know the market. It doesn’t go the way you think it’s going to.
Let’s just see what the end of the month looks like.


Oh, I’m losing alright. But what can I do…
Nothing.
But, I’m not all that worried. We still have some time before the interest rate decision day. It’s the 6th. Like a week away. We’ll just have to see how it plays out.
And here it is. The day of.

This is that EOD. The 6th.
It doesn’t make sense. Whatsoever.
Since when does hiking rates end up lower? Especially with the NZD. I’ve never seen them go low during a time like this. They actually raised rates! And I don’t think anyone got COVID this time.

This doesn’t make sense.

Well, according to my plan, I got to wait this out. It’s the strategy.
I don’t trade any other trades. I don’t touch this in any way. Position sizing, or anything. All I’m doing is playing the time game.

Let’s fast forward this to the present time.


Well, I feel better (of course I do…I’m typing about it).
But look how long it took to get back up there. Like, only 3 candles. That didn’t take long, huh?
Well, at the present time, I’m still in it. Haven’t jumped yet.
I’m getting tired of getting back up to break even. But there’s other things going on though. Basically, I think we got more to go here.

Look. I’m not a fan of charts. Seriously. But to play the silly game, it would go like this. I’m not gonna be drawing any kind of lines. But if you look back, it’s evident that in the middle of the whole chart is a consolidation zone (as mentioned earlier). Well, I kind of think we’re gonna get back to continuing on with higher swing highs from this area. We just took a bit of a detour. It took longer, that’s all. I mean, during the time that the decision day was, this looks like a swing low. A higher swing low that is. So this looks like it’s on it’s way up from here. That’s all.

Ok. I’ll give you an example of why I think chart reading is complete nonsense.
Just look back to the beginning of this chart. It’s much higher isn’t it? Well, all we got here (just right of middle) is just another lower swing high. Right? And we can easily have a turn around about where we presently are now. And it would coincide with longer term swing highs.

My whole point is, for whatever argument you give for one way, I’ll give you the opposite argument for the other way. Just as plausible.

Chart reading is for the birds. I’m not buying it. I’m not gonna be held hostage to this nonsense. This is probably one of the biggest deceiving things about trading. Therefore, I don’t rely, depend, think about, or trust charts.
Sure, it’s a tool. Along with many other tools, of course. I’ve just put that quite low on my list of things that I think are important. That’s all.

Sorry about that rant. It’s just upsetting to me.
It’s just what happens after you get burned time and time again. Got to learn.
That’s precisely what I’m doing.

Anyway.

Back to some important things I want to mention about my trading strategy.
This has been what’s been going through mind about it.

— PROS —

  • Ending positively every time is a wonderful thing.
  • When I’m in a trade, my account is frozen. I only trade one trade at a time.
  • No time constraints on a trade pays off. It always has, up to this point.
  • I can get away with trading bigger position sizing this way.
  • I have not lost until the trade is over.

— CONS —

  • Inability to seize any other opportunities that might be occurring, due to being on the sidelines.
  • Drawdowns can get quite sizeable, before a trade is closed out.
  • Some end of months (bottom line) don’t look so good, on the account.

Well, there it is. The good and the bad.
I don’t know…at this point…can I say that I can trade?
Do I have enough time with this strategy to be able to say that it works?
If not, how many trades will I need to tell me that it works?
Will there be a point in which something will tell me that it doesn’t work?
What would that be? A trade in which will never come back to my break even point?
Anything’s possible.

I’ve conveyed this before. Probably too many times. I’m sorry.
But I do believe in this.
The more constraints you put on a trade, the more detrimental it’ll be.
Especially when it comes to TIME.
I think trading is all about time. That’s probably why they say that you need patience as a trader. What’s patience anyway?

— Having the ability to wait things out.

I just love things like this. Seriously.
Somethings in life are so simple, and yet humans find it so hard. (Reminds me about the subject of faith).

You want money. You want it now. You’re not gonna get that.
You want to be right. You want to be now. You’re not gonna get that.
You want a trade to work out in a certain way. You’re not gonna get that.

A real trader comes to realize this.
I’m still trying to get it myself.

Alright Journal, I’m done with all that nonsense.
Thanks for listening.
Mike

3 Likes

Hi Mike,

I am posting a link to a guy who does stuff in an Excel spreadsheet. This is unrelated to your thread, but you came into my mind many times whilst I was watching this 1 hr 15 minute video.

I have just read your latest post to your journal. I care about you and I care about your tenacity to get to the truth. So if this is of no use to you please just let me know and I will not comment any further.

I feel in some respects we are very similar, but maybe from different starting points. I also want to be able to tell myself that I can master trading, and like you I don’t really care what anyone thinks of me (except my wife and family who sometimes say I work far too hard for my own good).

Anyway, the Excel stuff is something I am very passionate about but have not used much in the past with respect to Forex. I intend to do a lot more of that shortly. Meantime it was great to see the author casually explain how he took .csv data feeds into his spreadsheet, made some simple formulas expressing averages (six period averages on 15 minute data for all 8 currencies in scope of majors and crosses), and then went on to explain how he wrote formulas to represent a simple oscillator (short average period of 6 and long average period of 20 - I think).

Please browse through to see if any of these ideas give you any light bulbs in your quest.

I am concerned about your most recent concentration on one pair, one trade at a time, and most particularly no stop loss. There are a couple of reasons.
The first and main reason is that although it is unlikely that a currency pair can ever go to zero, it could happen that a currency becomes worth a tenth or a hundredth of its value. In that case, if your trade is leveraged, you could end up with a margin call (or your demo account reducing to zero in a black swan event).
The second reason, and this relates to a piece of work I am doing at this link where I have agreed to test a backtesting software, is that of the rollover or swap cost. In real trading, this is a daily cost that is added or subtracted from the trader account depending on the differential interest rates of both currencies in the pair. These days, those interest rates are very small compared with in the past ,but they do count, and if the demo account does not allow for putting in a swap cost element, your results over a large number of trading days may be very far out of line with reality.

I hope you accept these comments as constructive. And you may wish to read the thread I have created about testing the backtesting package. Swap cost is covered in lesson L21 (which I have yet to add, but intend to do so within the next hour).

Keep at it my friend. I do believe you will find the right path having committed so much time, effort and tenacity to this task. The right path may end up being something else than Forex trading, but the skills you have collected in this endeavour are priceless.

Till next time… be good, and be careful out there.

2 Likes

Interesting @Mondeoman - I found around 18/20 years ago that it was essential to download CSVs of teh DoW if you wanted accurate daily and longer charts (Got the CSVs from Dukascopy) - because of the way the charts calculated the daily High and Lows - The Highs recorded were never reached and often not even close - ditto the lows ! so you had to start from 1 minute CSVs and form the longer scale bars for yourself.

[I actually stayed up for an entire 24 hours and checked the H/L s every few minutes for teh entire period to prove this] - but the effect on trading plans based on S/R on the longer timescales would clearlt be massive if the peaks and troughs were fictional - which they were - even though “Official” ! and thus TPs were never triggered although apparently exceeded by values of multiple “Spreads” :grimacing: ]

And of course if teh data is wrong - any indicators you can devise are also going to be wrong - if you are using pending orders as triggers.

@MikeWolski - I don’t know if you have this thread backed up on your own machine - but it is now a huge resource and if it were mine - I would have it copy and pasted into word or similar - just in case I ever did want to “Write that book” - or in case the Website may just “Not be there” one morning !

I’ve lost a huge thread I did many yeasr ago on “Global Warming” - as I worked my way through the “Science” and the arguments Pro and Con - I deeply regret not having that one backed up - because I kNOW that all the work I did in Forming my opinion - and nowadays with the massive censorship of various sources the information is just now not available !

Anyhow just saying - do think about backing it up mate - these sites do not give any warning - just one morning they are no longer there ! :roll_eyes:

2 Likes

Hi @Falstaff thank you for bringing this to my attention. As I am sure you know yourself, data cleansing is a really important step in analysis. BS in, BS out. I had not thought to check the validity of the input data (OHLC) but since you mention it, I have noticed from time to time some really big excursions on short timeframe crypto values that do not occur on every exchange platform’s charting package. I will add this to my list of things to do, besides validating server side, network side and client side gremlins (like Win10 updates turned off). A big undertaking here, but I just have to get started with automated backtesting. The manual stuff gives me headaches. As for going back for 20 years as some members suggest, I really don’t see the point in that. And I don’t expect to find an algo that covers all pairs either, not for any timeframe.
:grimacing:

Good morning.

To my big brothers…thank you!

Mondeoman — all the advise and counsel you’ve given is taken and digested. As always. Thank you very much! Oh…and for the video. Yeah, the guy is a little dry, but I got through it. Thanks for thinking of me!

Falstaff — I still remember our conversation a few years back on the subject of me writing a book (it’s back there many, many pages ago). But, yes, that would be a dream come true. Hopefully it’ll come to be one of these days. And I will not forget about what I told you I wanted to do, between me and you. To be able to give you a big thanks, monetarily speaking. Cause, after all, I think it was your idea in the first place. You believed in me, and if it ever comes true, I would be that thankful.
In any case, I will heed you advise on the back up. Thanks!

Gonna come right back with my post.
Mike

Good morning Journal.

Well, let’s see. Where we gonna go today?

I guess I need to wrap my head around what the market is up to lately.
You know, put it all into perspective. Cause I do believe, if you know where the market has come from, and where it presently sits, that’s the best thing anybody can do.

Putting the pieces of the puzzle together is fun! I mean, concerning what has happened already in the market, I think those are the pieces we have already. Although we do need to put them together correctly. But then when we start seeing the picture more clearly can we hopefully see where we will be going. That’s what I mean when I say it’s the best thing anyone can do. Do the best with what you got and see how the future turns out.

Man…I just remembered something. Journal, remember back in the day, they came out with these pictures that made you look deep inside them. I mean, on the surface it just looked like a pretty design. But if you kept looking inside it (and your eyes crossed a little bit), all of a sudden you would see a 3D image of something cool. Like a bird flying or something. It was like, WOW! Now I see it. It’s like a secret picture. And the thing of it is, not everyone can simply look at it and see it. It took some kind of skill. With the eyes.

In any case, that’s like the market.
What is really going on inside the market. Huh?
Well, the footprints are being laid. And wherever it wants to go it’s gonna go. I’m sorry, but there’s gonna be some evidence tracked behind. Secrets are no more. Sure, the consensus is not always agreed upon, but in the end there’s always a winner. And a loser. But we know that the market will always be the winner. Every time. So therefore, I say it’s best to follow. Instead of speculate.

That’s nice.

What’s going on?

How about we look at what the USD has been doing.

Oh, by the way, I’ve been wanting to convey this. And now’s my chance.
Speaking of the USD index.
A lot of traders (Babypips) agree of how useful the USDX is. It’s the index tracked of the USD against a lot of other currency’s. Sure. I agree. Big time. In fact, that’s precisely what I’m all about, in a nutshell.

I have developed an index for every currency. Not just for the USD. I’m not biased.
Think about it. Why have they come up with the idea of boiling the USD down to one trade weighted value? That’s what an index is, right? You’re totaling the sum of all it’s parts. Coming up with one consensus value, an average, and that speaks and gives a summary of what the USD is doing. It’s simplifying, really.

Well, why are they the only currency to have that?
Oh, I know, their special. They are the world’s reserve currency. It’s the most important one. And, at one point in time, it was the anchor and benchmark with which everything else was tied to. Basically, it’s the most important currency.

Well, along those lines, I’ve always thought that if you truly want an accurate account of what a currency is doing, then you just do that very thing to all of them.
Give EVERY currency their own index.
Then compare them all in that way.
That’s the best way to compare apples to apples and oranges to oranges.
There’s no better way. You’re getting the real consensus of a currency that way.

And I believe all of these major currency’s are just as important as the USD. Cause I believe every trader thinks that also. Where money goes, period, is important.

Moving on.
The USD index.


This bigger picture view shows the Dollar on a down trend. I draw the line at the 1000 gridline area. I believe that was the support area. Yeah, last weekend I did switch (prematurely) their stated trend from long to short. They were sitting just a bit above that 1000 line. Thankfully it broke below that (cause I didn’t want to have to change things back). But now their sitting at another support area (just look back and see the bounces here). If they drop below here, then I know for sure their short bias is confirmed.

But, this is my tell, right here. It’s so simple. This is like a secret to me. It’s the quickest, most reliable method of showing me direction. Sure, there’s chart reading skills that’s needed. But experience is helping with that.

How about a shorter time frame perspective.


Now if that doesn’t give you some good details, nothing does. We can see that ever since the last couple days of Sep and going into Oct they’ve been heading lower. That’s the consensus.

I have in mind that we are in the last quarter of the year. And I’m wondering if the USD will continue heading down the whole time. We’ll just have to see.

Well, humor me. Let me show you some volume. I’ll confine this just to the USD.


Got each of the USD pairs. Volume for the day. And then all added up for a USD total (boxed line going across). And then underneath that is the grand total of all 8 currencies volume. That’ll tell you what the market did as a whole. Red is under it’s avg. Green is above it’s avg. And here we can see that, all except one day, that anytime the USD ends above average that the market as a whole ends that same way. Oct 8th the USD ended above avg and the market didn’t.

Well, I’ll tell you what I’ve been seeing, on this subject of volume. During the end of Sep and through the beginning of Oct have been much higher volume. But then as we’ve been moving through this month it’s died down a lot. Although Friday came in above avg. I’m not too sure why, but it is interesting to me.

Humor me one more time, Journal.
Check out this latest chart I came up with. I really like this.


In black, total market volume. In reddish, what the average for that particular day is. All this does is compare what amount of volume came out that day to it’s average. And when I see that it’s above, then I know that the market really moved that day.

There’s some good info there. I think.
But one thing I wanted to mention. Do you see how the average daily volume numbers have been coming down? Over the course of this year it’s been decreasing. See, this is dynamic data. Every day that goes by the average amount changes. My starting point is Jan 2020, and every day since then the average number will change and reflect anew. I’m in the middle of working on getting this chart updated to reflect everything from 1/'20 to the present time. Soon I will have completed this entire era. Cause I think we, the market, are living in a new time. What was volume before this time, I believe, we can’t compare to. It’s a new day. A new era. And I’m anchoring these days to how we’ve move along from that point in time. That’s all.

Alright.
What else do I need to know about the USD?


A look at the %'s. In the yearly perspective, back at the beginning of the month/quarter, they sat at about a running + 10%. But this month changed that to, now, in the negative territory. -1.33% presently.

In the lower table we got the monthly, quarterly (same thing), line up. We got the USD and the JPY upholding the bottom. That’s for sure. And if you look closely, we can note how the USD resulted for the 3rd quarter. It was in the positive territory. +7.79%. See? I’ve always mentioned how a turn of a month or even a quarter makes the most change. Surely that has happened this time.

The market is moving one way. For the most part. The big cats on bottom (safe havens) and the Comms on the top. That’s for this last quarter of the year, so far.

Well, let’s move on down the line.
The EUR. What have they been up to?


That’s right. I never did tell you Journal that I’ve moved the EUR from trending high to low now. I did that last weekend at this time. I made many changes last weekend. Well, I guess that’s why I’m going over it all now. But yeah, this past week confirmed my determination that they have changed from trending high to trending low now. I mean, you can see it there. Their coming down. They broke below that V shape area there at Sep 3rd. That’s where I called support area. So far it’s proving correct. Surely we have support around this next level at 5000 area also. Have to keep tabs on this. And I do. Every weekend.

How about their shorter term look.


Yep. They’ve done pretty much just like what the USD has done. Every since the end of Sep they’ve gone low.

Look. That’s just what this EUR index is showing.
Who knows how the real USD index shows all this. I mean, can you even accurately determine what the USD and the EUR are really doing, when that USDX is weighted more to the EUR than anything else?

All I know is that my charts are not biased one way or the other. My currency’s get most equal and even treatment.

But this is what’s happening. Both the EUR and the USD are trending low. What can I say? That’s the market for ya. It don’t care.

Moving on.
The GBP index.


Their trend bias is long. I do have to admit, I thought the Pound was on it’s way down, back there on that last pretty good dip. But nope. They’ve been supported. I think it’s the risk-on sentiment bringing them higher. And of course that only makes sense. When money wants to move to risk, these guys seem to be among the favorites.

How about shorter term.


Yeah, you can see here also what happens around the turn of the month. Sure, they took a pretty good dive heading into Oct. But come the 1st of the month they go pretty much straight up. We have to compare this to what the Comms have been doing. I think they might be similar.

I know. I thought about it. I could combine all the currency’s on one of these charts. And we could see them side by side and see that dynamic. But I don’t think that is very important, anymore. I mentioned this a while back. And I still think this way. What’s most important is seeing, determining, contriving their own path. Correlations are good only to a point. Everyone carves out their own path. I think that’s a principle. I learned that lesson some time back.

Moving on.
The CHF index.


At the present time, as last weekend at this time, I have their bias trend as being low. Short. Cause that’s the last thing they’ve been on. I never changed anything with them for a while. Ever since they couldn’t reach up and over that double top area I’ve counted them on a down trend. Although it is interesting to see this break up higher lately (past couple days). Surely they would have to climb way much higher for me to change this bias of theirs. We’ll cross that bridge when we get there. Until then I believe their direction bias is for low.

Shorter term details.


All I know is the SNB better be on their toes. Hopefully this is not going to go anywhere and they step in like they did back there around the 21st, 22nd.
Look. It’s always fun for me to blame and talk about the SNB the way I do. I really don’t know what their doing. Plus their site deposits data have not been showing that their intervening lately. But we do know one thing, they always have the excuse that they don’t want a strong currency. In fact, I think they always think it’s too overvalued.

Anyway.

Rounding out the safe havens.
The JPY.


Just when you think it can’t get any worse. It can.
Well, maybe it’s how you look at it. If this is what they want, then I guess it’s a good thing. I don’t know. But I do remember reading an article this past week (Forexlive) about how they (the Bank of Japan) are watching the market closely. I mean, the writing is on the wall. Their currency is devalued like big time. Is this what they really want? Are things getting out of hand? They are definitely watching and would possibly intervene to get some mean revision back. I forget the exact reasons, but fundamentally speaking, this just might be hurting their economy in certain ways (maybe in the banking industry or in the retail industry).

I have to say though, this is extremely interesting to me. I mean, anything that goes straight one way for such a long time catches my attention. More specifically, will there be opportunity for some mean revision? Like some really big moves up ahead, for north? I just don’t know. I’ll be watching for that though.


Same story as the USD and the EUR. Down it goes into this last quarter of the year.

How about some Comms.
The AUD.


This is so much clearer now, right? It had to get up and over that last swing high, cause this most recent climb hasn’t been totally obvious. Easily, we could have gone right back to the long down trend that’s been in place for most of this year. The bias is for long now. Looks like their trying to get back up to break even for the year. We’ll have to see how that plays out.

I want to show the NZD now.


Remember the divergence we had between the AUD and these guys? Well, that had been smoothed out a lot lately. Cause it sure did seem like the NZD was gonna continue on with their down trend, unlike what the AUD was doing. It practically went straight up, ever since the previous Thurs & Fri. A week and a couple days fixed all that (divergence) nonsense.

Check out this chart. It’s the short term version showing how the divergent gap has been closing.


Look closely. We all were scratching our heads up until Oct 13th (I know I was). But then here comes the NZD. Boy…they surely closed the gap a lot.

Look. I know there’s probably a good strategy regarding this dynamic. And I think I have explored it. But got burned. Cause you don’t know how long something will continue. There’s a saying that goes something like this, “The market can be more irrational than you can be solvent.” I will always remember that, cause it’s so true. We got lucky here. The market doesn’t come back to normal so quickly as this. Trust me, I know. That’s why I gave up on that idea of a strategy.

My advise. Don’t do it.
I wrote so much about that. In fact, I think it was between the USD and the JPY correlation dynamic. Just imagine if you think the JPY should be getting strong by now! Boy…I would hate to be in your shoes if you had a trade running and waiting for that gap to close.

That’s nice.

One more.
The CAD index.


Their bias trend is for high. Long. I’m kind of surprised they haven’t dropped much in relation to their gains. That kind of tells me that it’s more of a stronger long trend.

Short term view.


It’s been strong. No doubt. This last quarter really has separated the men from the boys. You know who’s moving where.

And I would say, moving forward, that until these trends change, I kind of think they will continue. I mean, after all, isn’t that the definition of a trend? It continues on a directional path. Plus, I haven’t seen any indication of changes to those particular paths. Real changes anyway.

Well, maybe my volume indicator might be indicating more volume and possibly changes come with that. Of course we only had an above volume day on Friday. Boy…I’m wondering why?

Interesting stuff to me.

Anyway.
Thanks for listening Journal.
Been fun wrapping my head around it all.
We’re coming into the last week of the month. I’m definitely sitting out on the sidelines. Cause I made some money last week.
Remember that NZD/USD trade I had running?
Well, coming out of negative territory, I ended up with +120 pips on that.
It was my 14th consecutive successful trade. And I’m happy.
So now, I’ll just wait for a good opportunity to present itself. I’m not in any hurry.

Mike

1 Like

Good morning Journal.

Don’t mind me Journal…I’m just sitting here wondering where we are gonna go.

Thinking.

Well, let’s step back a little.

And that’s kind of what I’ve been doing this week.
Kind of.

This past week I took action on the advise, mentioned earlier. That’s backing up this thread. And well, it wasn’t too easy. After searching around for any kind of easy way to do it, I found only one way. The hard way. Copy and paste.

And that’s what I did. I copied and pasted this entire thread onto the Word document application. Boy…that took a long time. I think it ended up being like over 1300 pages. Quite long. Exhausting. But done. And then I started to get some ideas about what to do with it. Sure. I was getting excited about this.

During the whole process of copying and pasting, by the way which took about 4 - 5 hours, I did take some time to read some portions of it. Sure, some stuff, especially in the beginning, was quite stupid. I mean what can I say…it’s how it came out, at the time. And I feel embarrassed about it. But it is what it is.

And then, on the other hand, there was some very interesting stuff that I wanted to spend much more time reading. For instance last year when the pandemic was approaching. I mean, you got to admit, what everyone was thinking and wondering about was like new territory, for us humans. And yes, I did express my thoughts during that time. So, of course, that’s some good reading. And I do have plans one of these days to go through the entirety of that time. Cause remember, I was idle then. I do remember, personally, that I was starting to lose my mind. Like, no kidding. It definitely was a time that I haven’t experienced before. And I do wonder how much of that did I write about.

But that’s for another time.

Well then, when I completed it, I had plans on editing it. Like, going through and making it more readable. Which I kind of did. Only to a point though. The problem is that I have to learn how that application works. It reminds me of the learning curve I went through learning Excel. You know how many years that took me? Many. And this is like the same thing. Instead of learning the myriad of things you can do with numbers, learning the myriad of things related to words, paragraphs, entire stories is a separate task. Sure, on the one hand it is a wonderful thing. But on the other, it’s like learning a whole new language. It’s not easy. And it takes time.

Given that, inability, I only got so far. I mean, I can’t even come up with a table of contents. It’s hard! The preprogrammed things it has is not exactly what I want to do. And so I kind of have to do it manually. Which is even harder to figure out.

I don’t know. It’s where I’m at now.
I have it all down though. In a place where I can go and look at it. It might not be in a format where it’s all grouped nicely or anything resembling readable. Like, I wanted the table of contents to reflect a chronological walk through my journey. For instance by the years. And then within those years to see exactly what happened. Somehow to be able to summarize what I went through then. Know what I mean?

I don’t know. That’s editing for ya, I guess.

But also.
On another note.

I got to thinking about the whole thing, period.
What’s the point, anyway?

What is it?
It’s my walk. My experiences. How it all happened. In print. As I went through it.
So.

I mean, isn’t that everybody’s life though?
The only difference between me and every other human on this planet is that I’m putting it down in print, where I can read it at a later time. That’s all. What’s the big deal? It’s how us humans are. Everyone has a history. Everyone learns along the way. We all progress along a particular way. And we are all different. Therefore, we’re all gonna have a different story.

Look. I’m not any more special than anyone else. Absolutely not. God made us all special in our own ways (and that should show us how awesome He is, to begin with). But, that’s all good and nice. Honestly. Yes.

So…why am I doing this again?

Well, in the beginning, I knew this was gonna be a good story. When you just know where you want to go. When you figured out, without a doubt deep down inside your bones, that one day you’re gonna become this thing (trader), then the only thing that makes sense is to write about it, document the journey of how it’s gonna turn out. Right? I mean, the only thing that’s gonna derail that end goal would be death. Honestly. When I go, then goes the dream. The story. The journey.

All that nonsense is to say that it’s God’s plan for me.
I know it.

And well, that’s what I was thinking back in the beginning. I’m just wondering why my story should be esteemed any greater than any other aspiring traders story.
It shouldn’t! Just because my story is going down in print shouldn’t mean it’s any more special. Like seriously. I believe everybody should have a book written about themselves.

I digress…
You know…
That’s why I love to talk to older people (ok…old). Cause you know why? Their stories are awesome! Man…do you know the things we can learn from old people? Are you kidding me? The experiences people have had a long time ago just cannot compare to anything I’ve experienced. It’s true. But I just love stories from people who lived in a different time than me.

This reminds me of our (mine and Trish) conversation yesterday. We had a nice lunch somewhere. And this is what was brought up. If you could invite 5 people over for a visit, who would it be? Like, anyone who ever lived.

Well, I picked my hero from my youth. Who else? Michael Jackson. I mean, come on, he was the most talented human who ever lived. Right? Boy…the questions I would ask him. The gift bestowed upon him…his experiences…his fame…his struggles…and probably most of all exactly how he came up with the music he did. Cause that’s hits home to me. I love music. I loved his music.

Also in our conversation, it’s funny how mine and Trish’s parents had that same feeling towards Elvis. Boy…they loved him. Sure, there’s the generational difference in the realm of music. But you know what? It’s the same adoration towards talented people who lived. It’s awesome. God truly blesses some people. But it’s fun to hear stories of them all. Huh? I mean, I would give my right arm to have my mom around to hear all how she experienced that again. Her (Trish) dad also. Boy…he was a talker alright. I remember listening to his stories at his kitchen table. Sure, maybe they all weren’t true, but I didn’t care. He was a history buff. And boy did that make for some good thought escapes. He was awesome. I miss that.

Sorry 'bout that.
Where was I?

I don’t know…I just like stories.

Ok. Maybe that is another thing I like to do. Write. Type. Explain. Come up with stories. Oh yeah, that’s fun stuff. I guess maybe that’s why I am doing this. Cause in the beginning I did realize what a tough field this is. Think about it. We’re talking about trying to figure out what’s going to happen in the future. Speculation. And humans somehow think they can come to figure it out. Sure, that’s interesting stuff. But what really got me, I remember, was learning from someone online (an old investor giving advice). He said that trading is 90% psychological. That hit home for me. Somehow I realize within myself that that’s an area in which I can excel in. Whatever I would have to learn, I would learn. I’m definitely capable, to the nth degree, I believe.

But…I know that there will only be a small percentage of new traders that will ever climb their way all the way up to the top. And which of those who do will ever document the entire way?

That’s probably where I think I might be different than most.

Again.
I’m just a guy who likes to type.
And trade.

Everyone has a special gift.
And I’m no different!!!

Ok.
So.
Where we at?

My journal.

I guess I’ll keep trying to figure out Word. And then hopefully one day be able to have all this nonsense available in a readable, context.

Also along those lines, I’m still on my journey. I mean, I haven’t died yet. And until that day comes I’ll still be striving, grasping, trying to reach my utmost potential in trading.

Let’s see. I should break out my vision statement again.
Cause this is exactly where I want to go.

“I am fulfilling my God given destiny of owning and operating my own successful full-time trading business.”

Well then, that should mean that there should come a day in which I will be able to sit down here, and type away in this journal of mine, when my formidable trading business is up and running. Sure, I might not be throwing out there my exact $ amounts in my trading accounts, but why couldn’t it be possible to arrive at the point in which I sustain myself, financially, independently through my real live trading business?

I mean, what’s it gonna be like when that day comes?
Well, whatever form it’s gonna take, I’ll be writing about it.
For sure.

Well, all I can say is stay tuned Journal.
As long as I am living on this earth, the journey will continue.

Mike

P.S. — Thanks big brother (Falstaff), for the push.

1 Like

Hi @MikeWolski,
Thanks for your journey journal this week. Sometimes I get a weird feeling. When @Falstaff suggested you save the entire journal, I tried to save my own (much smaller) journal on here by printing it to a .pdf file. I had done the same to my printer when it was only about 8 pages long, and noted, annoyingly, that many of the images printed as blurs not as images. Sort of defeated the purpose of printing it out really.

And I thought of you, struggling to find a way. On the other hand, I started something similar last Friday. I have 90 pages of notes (in MS Word) accumulated over a few months this year during listening to about 80 podcasts from VP of NNFX fame, and watching about 100 of his videos.

So after some months delay being diverted to concentrate on Crypto and crypto mining for a while, I got back on track to progressing my “trading plan to end all trading plans”, and coincident with me agreeing to test a backtesting software (FT5) I realized that I needed a test strategy and test plan that was both realistic for the audience, and could potentially at the same time progress my own trading plan (2021 plan, a bit late by now).

So I looked at my 90 page “Terms of Reference” document for the 2021 trading plan and did a word search on “test”… Hmm … 183 entries in the entire document. It has taken me two long sessions and I decided to hand write the page references to that “test” content. I now have about six pages of “test related” content that I can now confidently write a test strategy and a test plan for continuing the FT5 test schedule. But how does that fit into my overall Plan? This is, after all, a test strategy and plan only for TESTING the FT5 application. I also need to incorporate that into a Trading Strategy and Plan document, which is the output of my work to date on a 2021 trading plan.

So I am not finished, but like you it has caused me to think “what is the overall effective Index or Table of Contents” that will guide me in knowing what to do first, then what to do next?

Below is the (draft) table of contents for my 2021 Forex Trading Plan - Stage 2. It is stage 2 because stage 1 was my previous aborted 2014/2015 plan that I curtailed having lost 13% of bank, with 445 trades, and no sign of an edge having been developed.

No doubt this is going to change somewhat over the next week or two, but it may give you some food for thought about indexing your own marathon effort to date.

Table of Contents

  1. INTRODUCTION 4
    1.1 Purpose 4
    1.2 Intended Audience 4
    1.3 Document Approval Process 4
  2. BACKGROUND 4
    2.1 Vision 4
    2.2 Goals 4
    2.3 Initial Objectives 4
    2.4 Strategy 5
    2.5 Plan 5
    2.5.1 Detailed Plan 5
    2.5.2 Schedule and Work Breakdown Structure 6
    2.5.3 Estimated Effort 6
    2.5.4 Success Criteria 6
  3. PROJECT DEFINITION 7
    3.1 Method 7
    3.2 Approach 7
  4. SCOPE 7
    4.1 In-Scope 7
    4.1.1 Actions Required 7
    4.1.2 Milestones 7
    4.1.3 Deliverables 7
    4.2 Out of Scope 8
  5. ASSUMPTIONS 8
  6. DEPENDENCIES 8
  7. Risks and Opportunities 8
    7.1 Risks 8
    7.2 Opportunities 9
  8. Appendix 1 – Statement of Requirements 10
    8.1 Money Management 10
    8.2 Psychology 10
    8.3 Technical Analysis 10
  9. Appendix 2 – Golden Rules 10
    9.1 Money Management 10
    9.2 Psychology 10
    9.3 Technical Analysis 10
  10. Appendix 3 – Traits (habits) 10
    10.1 Money Management 10
    10.2 Psychology 10
    10.3 Technical Analysis 10
  11. Appendix 4 – Elimination 10
  12. Appendix 5 – The Algorithm 10
  13. Appendix 6 – Requirements Traceability Matrix 11
  14. Appendix 7 – The Test Strategy 11
    14.1 Money Management 11
    14.2 Trade Psychology 11
    14.3 Technical Indicators 11
    14.4 Elimination 11
    14.5 Trade Setup 11
    14.6 Trade Entry 11
    14.7 Trade Management 11
    14.8 Trade Exit 11
  15. Appendix 8 – The Test Plan 11
    15.1 Money Management 11
    15.2 Trade Psychology 11
    15.3 Technical Indicators 11
    15.4 Elimination 11
    15.5 Trade Setup 11
    15.6 Trade Entry 11
    15.7 Trade Management 11
    15.8 Trade Exit 11
  16. Appendix 9 – The Test Results and Journals 11
    16.1 Demonstration Account 11
    16.2 Live Account 11
    16.3 Lifecycle Management 11
1 Like

Absolutely brilliant Mike :sunglasses:

I have to say - if I was anywhere near that consistent - I’d be looking to re-evaluate my “money management” rules !

Excel can do magic with words and paragraphs too mate ! You can type an awful lot into a cell - I used to do that when writing reports and claims or intricate letters - perhaps just type each thought as it arose into a new cell in the same column for days or weeks - then the next cell to the right I’d type more detail and examples and use more cells to the right as needed .

When I was ready to review the situation, highlight the master column and tell it “Filter” (In the DATA tab) - then you can tell it to look for cells with the word you want in it - like “Xmas” for example and it will hide all the rows where the cell does not contain the word “Xmas” - You can then copy all the relevant cells, together with their expansion notes to the right and !“Paste special” it onto another sheet , which you then title “Xmas” and you can then hyperlink that tab onto your index tab so clicking “Xmas” on your index tab takes you straight to the Xmas" tab and you can manipulate and refine there without ever disturbing your master copy.

Other useful functions to play with in this respect are “Sort” and “Group” - but when playing with words - the use of “” “” is often necessary in filter for example.

Try it out with just a few sentences or numbers or both on a new spreadsheet and see how magic it is - any specific probs drop me a pm :slightly_smiling_face:

AND By the Way - You can write perfectly good letters and reports etc in EXcel without the need ever to go to Word - if you;re more comfortable in Excel (As I am)

I sure wish I could type anywhere near as well as you two !

But I digress What’s with the numbers at the End of each line mate ?