My journey journal...from demo to live...and beyond

Good morning Journal.

What a week it’s been.
We need to make sense of what’s been happening.
And that’ll be my aim here.

What is going on in the market?

Well, I’ll always believe this. What happens in a week, gives the best context. We have a starting point and an ending point. And if there’s any analysis that goes on in the forex world, it’ll be at this time, during the pause in the action. So, here goes my take.

2021-04-10_05-23-32
Here’s the month of April. Each day’s individual results. You can see how they are all stacked up against each other. And underneath, is the weekly results. The Apr 2nd one, comprises of the last 3 days in Mar along with the first 2 days of Apr (there’s a reason why I want that in there).

Biggest points to be made.

  • The CHF dominated. First 3 days was the most bought currency. Also elevated the rest of the way. How much buying was there? Well, that’s why I inputted what the average weekly standing amount is, for this year so far. It was almost double the avg. for the top spot (gives some perspective).

  • The GBP. Goes from most bought last week to most sold this week. Was the most negative weekly result this year (the last time, and only other negative time was -8.18% Jan 8th).

  • The JPY. Goes from most sold last week to 3rd this week. They finally came off the bottom. This is only the second time they resulted in a positive weekly result (Jan 15th was 3.28%).

  • The EUR. Highest weekly % this year (last was 6.54% on Feb 26th). And it’s only because of the CHF.

So. What can we say about this past week?
Well, to start off the new quarter, we’ve gone completely opposite of whatever has been going on previously. We can call this counter trending.

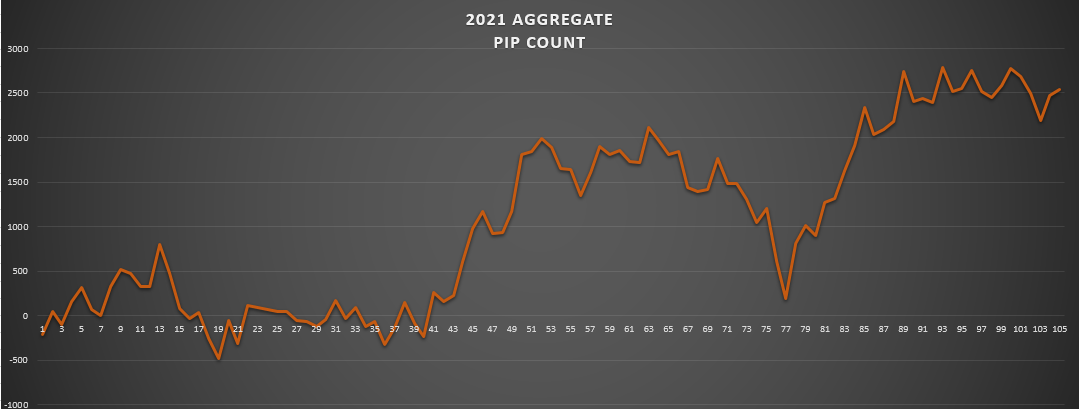
Here’s a shot of the yearly running, along with the way this quarter is shaping up.
2021-04-10_05-56-23
Now can you see how much opposite action is taking place?
The GBP, on top this year, but not so this quarter, so far.
The CHF, second to last this year, and now top dog this quarter.
The CAD, second to first this year, but has slipped up this month.
The AUD, been quite bought up this year, to about break even now.
The USD, been quite bought up also, but definitely negative now.

Now, look at the EUR. They are not counter trending. Probably the only one.

Is this now becoming more clearer to us?
Yeah, I think so. The new quarter is coming in with some changes. Right?

Let’s zoom in a little more. I’ll take them one by one, and look at their respective trends.

The CHF.
— Are they really going somewhere?
— Do we think their trend will change?
— Or is this just some profit taking…Taking advantage of this opportunity?


Look at the end of Feb going into Mar. Now that’s profit taking. And then continuing on in the trend (down trend). Right?

Well, if you ask me, what’s happening now, is not the same thing. There’s been much consolidating going on lately. And now, taking advantage of the situation, is heading north.

Remember what I always say.
The best time for any trend changes happen around the turn of a month. Surely it’s not a rule. But, for as long as I’ve been keeping track of these currencies, I see it. It’s just something that likely can happen. That’s all. And NFP Friday helps along with that also.

Well, as far as my trading them is concerned, I jumped (took them out of my basket of trades) whenever this chart went above the most recent high. That broke the down trend / consolidation.

The only other thing I keep in mind, with these guys, is how much the SNB will try to keep them from moving higher. You always have to remember that fact. They don’t like it going high! Even recently, during their interest rate decision and meeting (I read it) they, once again, think the currency is too high and will strongly intervene to depress it. This is stuff we got to know.

Moving on.
Who’s next?

Well, while we’re at it. Let’s look at the EUR.


What can we say? All year, they’ve had a mean revision all around break even (0). Until lately. Going into the end of Mar they broke out. That made a new high for the year. Then retraced some. Was supported right there at the end of that month. Then comes April. They’re going up.

You have to see, also, that we’re not talking about a whole lot of pip movements. For the entire complete currency here, it was only about 500 pips worth, for their new high point. That’s not a lot, trust me. But, they’ve overtaken 1k amount of pips now. My point here is that they have room to run, if they wanted to.

And concerning my trading, I entered them in on my basket of trades (for north of course). Actually, this was the first time I’ve traded them this year so far. As soon as they popped up over the recent high this week, that’s when I started traded them. But look back. How many times have they made a new high? Mar 1st broke up over. That’s one. Then, later on in Mar was the next time. That’s two. And now, in Apr, it’s the third time. This caught my attention. So, I’m in now. Proving good so far. We’ll have to see how it plays out. I’ll keep them in my basket as long as this chart stays above that level just over the 500 mark area.

Moving on. How about the USD. Their probably the next important, right?


Well Journal, you should remember how I got fooled with them at the start of Mar. I just thought that first 2 day drop was gonna take them down further along their down trend. But what happened? Nope. Up it goes. Made a couple new highs for the year. And now what? Well, it’s coming back down.

Enough to be considered breaking the up trend?
Well, look back at the last swing high. It’s just over the 1k area. Yeah well, that’s about where it’s at now. But look closely. At EOD Thursday. It ended below that point. So, what do you think I was thinking at this time?

I’ll tell ya.
Got to remember some of my rules. And one of them is this. If I’m at an inflection point, I got to see it through. One more time. So, I was gonna give it one more day. Also. What day of the week was it? Thurs. And because I play the week as a whole, that was another reason for me to say in for one more day. Sure, it was a losing week, as you can see there. But, I got to see it through. And what happened, on Friday? Well, it paid off. Got a bounce. Not all that much, but gained back some though.

But what am I gonna do now, moving forward?

Yeah man, I’m thinking this is a losing prospect. Well, more accurately, more losses just might come. I’ll have this as my game plan.

  • At the open, exit out of my USD trades. No USD in my basket.
  • If I see an EOD going up above that level, then I would resume them long.
  • If they do not move up (EOD), then stay out and see what happens.
  • I would only go with them short if I seen an EOD go very far south. Like, convincingly speaking.

Let’s move on.
How about the JPY. I popped in here this week about them. Remember? Let’s see what happened.


Well, if you look at the particular numbers above (very most top table up above), it’ll tell you that Friday was the only down day they had. So, when you take all things into perspective, that was a huge positive for them. And so, given that, I’m keeping them in my basket. My out point will be the lowest point there. That’s only 275 pips lower. Not much, huh? Well, if one day breaks lower, then out I am. That’s all.

And if you remember exactly who I traded them against, it was the AUD & NZD. Therefore, let’s look at them now.

The AUD.


Well, this year, their high came at the end of Feb, like 2 days before Mar started. What a drop, huh? Then retraced up about half way of that. But do you see where I put that dot? Boy, I remember, when that happened, my bias definitely changed. Since then, the AUD has been short in my basket. And so far it’s been true. I’m not gonna change anything concerning them.

The NZD.


It’s the same thing here. Where that dot is, I’m telling you, something changed. And their trend is nothing but down. Again, their in my basket of trades, going south.

How about the CAD…


Well, we can see that it all started Mar 1st. Since then, going up. Well, up until the end of Mar that is. From Apr 1st, they’ve been heading lower. But on Friday what a good boost back up. And I know why…They printed some very good employment numbers. I mean, fundamentally speaking, I think, there’s no reason why the CAD would be a sell. I don’t know…maybe the COVID situation is having an effect. We might even be having a broad market sentiment change across the board.

For whatever reason we can throw out there, it always comes down to where price goes. And we definitely have a consolidation happening right now.

Well, you can see where I entered them in my basket of trades. I will keep them in going north. But if I see an EOD print go below this last swing low, then I will jump.

One more currency.
The GBP.


Well, I’ve been in long with them since Mar 1st. It’s been a good ride. But what happened this week? Yeah, it hasn’t been good. You should know, when you trade the GBP, were talking pips. I mean, there’s a couple thousand lost recently here.
Well, I’m still in it. And, as far as my trading is concerned, they’re pretty much at the inflection point. I put a white dot where my exact spot is. I’m gonna give this one more day. If they break below this point, I’m jumping. It’ll tell me that this long bull trend will no longer be true.
But…I got to see it through. Who knows. Maybe it’s the air releasing that we need for this to continue on up. Nothing goes straight up.

Then again, talking about broad market stuff, you can’t forget, the Pound is considered a risk-on currency. I do know they like to travel very similar to the AUD, and the NZD. And I know what they’ve been up to lately. It hasn’t been good. So, we’ll see. Also, remember about my recently new rule.

I’m not factoring in the correlation of currencies. Their individual aggregate pip count chart is the most important factor.

So. I’m not afraid to keep the GBP for one more day. I need to see it through.
If you’re gonna trade, then trade.
If not, then don’t.
That’s all.

Alright Journal, I think that’s it. I covered them all.
Here’s what I’ll do at the open.

2021-04-10_08-49-26
It is embarrassing what happened this past week (in the daily pip results box’s). See? I told you. Well, you got to remember. I not only play the week, but I play the month also. And we have only just started the month out. There’s plenty of time to recoup some pips. I mean, what can I do, right? That’s trading for ya.

Well, I’m gonna be in with 8 pairs only. The line up is there under the Apr 12th column.

I only trade the currencies that are trending high, against the currencies that are trending low. All which consists of that will be in my trading basket.

That’s nice.

You know Journal.
I’ve been really curious, lately, how effective this is. My determination of exactly who get’s traded. Like, the particular pair I trade. I think in order to find out whether it’s all by chance or not I’m gonna have to do some leg work. Back testing. And compare the pairs I have chosen, to any other pair that outperforms these ones. Know what I mean? I’m gonna have to explore this. Definitely.

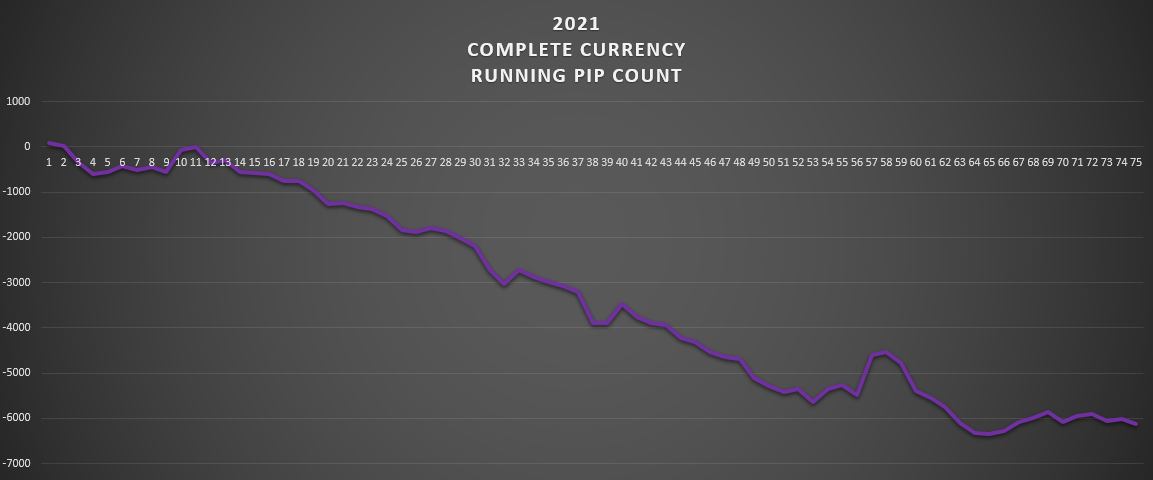
But, I have finished some back testing on my system. I’ll show you these results I have for the year 2020. You know, that unbelievable year.


All this is showing, is if I would have followed my plan, all last year (2020 only). This is the raw pip results.
Another way of saying this, is that if you would have followed the currency trends, as close as possible, this would have been the results.
Of course, this wouldn’t take into consideration things like adding position sizing. Or even making a rule of staying out at certain times (like after some serious profit).
Boy, I’m telling you. Staying out of the market can be a real factor. Let me show you what I’m talking about.


Top box is the individual daily basket of trades results. It’s what the day produced. Underneath that is the cumulative yearly running total (it’s actually what’s on the cart above). But my point is, just look at Mar 18th. Even the 19th. I’m up to 8k pips. That was a jump of double the day before. Ok. Let’s start out the week. The 16th was a Mon. 3,655 total. I’m up a lot from the week before. Feeling real good now. Tuesday comes, with more pips from the system (4,307). Then Wed. 8,501. What do you think I’m thinking at this time? Happy is not even the word. I’m rich. Ok. I stay with the program. Thurs EOD comes. Dropped some. 8,025. Still, on cloud nine. Stay in? Well, as you know, I play the week. So probably will just stay in till the end. Friday EOD results at 6,813 pips, for the year.

Now. What did I start out the month with? NEGATIVE amounts.
Well, you better believe I’m gonna probably take this and go home. Why chance it?
I mean, I really don’t know, like for sure, what I would do. But all I can hope for is to think I will take some profits and sit out for a while. To see what’s gonna happen. Right? Well, what did the month end up with? 4,412 pips. That’s much lower.

And all I’m saying here is this. There’s got to be some good rule about :

Knowing when to sit out.

That’s all I’m saying.
It’s like almost the same thing as making money.
Actually, saving money is really making money.

Anyway. These are just some of my thoughts.
And what I’m gonna be working on, now.

Alright Journal.
We’ll be in touch.
Thanks for listening.
Mike

1 Like

Knowing when to sit out.

that is the king of statements there Mike

Keep up the good work

1 Like

Good morning Journal.

Yeah sorry Journal, getting off to a late start this morning.
It’s not like I slept in or anything. That just doesn’t happen. I’ve been busy.
I wanted to finish this up to show you. I think it’s interesting.
Very.
Anyway.
This is where I’m coming from.

First off, I want to know if my strategy is working. Like, period.
But then, I would like to know how effective it is. More precisely, I would like to measure it up against what the market actually produces.

So…that’s where all this nonsense is coming from.
Would I need to make some changes? Should I?
This is what I’ve been up to lately.
And this is what I got. Check it out.

Let’s see, where do I begin?
Well, I need a way to see what the market produces in a day. And now that I’m getting more away from (surely but not totally) complete currency stats, I’m zooming in on the particular pairs. Cause those are what I am trading.

Yep. I trade a currency pair. How’s that grab ya?

(Talk about primitive)
(I’m sorry, but it is)

Well, more specifically, I trade a basket of pairs. Therefore I do need to be looking at the pairs. Therefore, I will need to somehow compare my pairs against all of what the market has going. So, I’ve come up with a way to do this very thing. I mean, how else would I know whether my strategy is working or not? Am I dead on? Am I way off? Do I have the same chance as a roll of the dice? Average? Do I think I have some kind of edge to exploit? These are the questions I would like answered.

Tell me what you think of this?
I guess I’ll start with the month of April.

2021-04-17_07-36-19
The left column, all of the 28 pairs. In order from the strongest to weakest. EOD results. I arranged the base currency (first one) and the quote currency (second one) according to the positive values, as opposed to their normal arrangement.

Middle column is their respective pip count for the day. Only positive values noted. And these values will correspond to whoever the base currency is. At the bottom is the sum of them all (795). That’ll be the absolute highest possible pip value for this day. It’s only there to show how much the entire market traveled. It’ll be a good indicator of volatility. The higher the number, the higher the volatility. So, this will need to be compared to the other ones. And remember, this is EOD values, not what they stretched out to during the day (which is always more).

Third column is what my trading results are. Green = positive ending value. Red = negative. These are the pairs in my basket of trades. I had 9 running this day. And at the bottom is the total. Under that, is the only way I know how to compare how good or bad I did, that day. And all it is, I divided that number to what the max number (to the left of it) is. First off, I would see whether I ended up positive or negative. Then would come how much positive or negative I did. This is nothing but a comparison number. Maybe sometime later on when I have enough data saved up I could look back and see what would be considered good and bad.

Remember all my questions, earlier? I should be making some headway with this bottom line number.

I need to bring another point to light here, also. Concerning all this.
See, if you don’t know it by now, I like to build my own data bases. And the more I thought about this, the more I liked the idea of going back and seeing how the market has moved, in this respects. So, you better believe, I’m gonna go back and build all this up. It will facilitate any kind of back testing I would want to do, concerning which pairs I would trade. Right?

Let’s move on with what April has been showing us.

2021-04-17_08-17-47
This is about what the market produced. In real trading terms. And what’s more important than the actual pip counts?
You can get some kind of sense of who was strong by looking at the first currency in the line up. You don’t need to be a genius to see that the NZD was the strongest currency this day. There’s only 7 of each currency. And all 7 NZD’s were found in the top 9 spots. So yeah, it was their day. And of course, I had them short in my basket. Therefore, my results were in the negative.

Well, I’m not gonna go through each individual day. I’ll zoom it out a little. Week at a time.


From a distance, you can see whether I had a good day or bad one. Notwithstanding the colored box’s, the standings are shown at the bottom also. And so, how about this for some context, huh? I think it’s a good system of tracking what’s been going on in the market. The context, though, is in the pip results. This has to do with trading results, only. My other data tables show a better picture of how each currency compared to one another. This is just to facilitate how well (or not so well, in this case) my trading went.

Although, I do see another context this can be used for. I mentioned it earlier.
The volatility of the market. It’s the middle column’s total (at the bottom). This is very telling to me. It gives me a sense of whether the market participants are moving or not. You can probably guess that Monday’s are not gonna produce as much as the other days, right? And then Tuesday and Wednesday’s will probably produce the greater amounts.

So, of what I’ve shown you so far, it’s looking like anything above 1k pips produced in a day would be much, right? Well, let’s see how that week went. Monday was the lightest day of the week. Then Tues. booms with the biggest day. Then each day afterwards it went down incrementally. 635. 1548. 1146. 987. 871.

There’s a reason why I’m showing you this.
Let’s look at what happened this past week.
Monday. Tuesday.
2021-04-17_08-49-34
What we’re looking at here is the middle columns. And it’s results. Volatility.
Monday comes in low. 680 total pips available. This is usual for the first day of the week. But then Tuesday comes. Results. Very light! Journal, at the EOD when I was running the numbers I remember thinking how very unusual this was. Something big was gonna happen. I’m telling you, I was very perplexed about this.

I mean, what was I gonna do anyway? Nothing. I’m not gonna change stuff until EOD comes and that pretty much tells me what I should do. So…as I’m setting this all up for you now… what do you think’s gonna happen come Wednesday?

Something. That’s for sure. The market was consolidating and ready for a break out to go somewhere big. And I knew it too. But there’s nothing for me to do about it.

This is the results.
Ready?

2021-04-17_09-00-28
Boy…I remember it. Journal. Man. I was dislodged.
All I knew, from any source I had, was that the NZD and the AUD were on a tear. And sure enough, look at the top 12 spots. There’s only 1 other pair that is not up there, and that’s the AUD/NZD one, of course. It was such a biased day, for them, and them only.

Well, I’ll tell you what happened, that day. I’m not gonna conceal the truth.
It was when I finished my morning long bus driving run. It was 11 something that morning. I get into my car, and after I log in my time (this is what we have to do instead of a time clock to punch out…an app on my phone) I check the market. This is just before I drive off for home.

I seen my account balance drop very far down. Talk about a shock. I mean, I’m stunned about this. So…I’m like…all I know is that I got to protect the account. Rules, or no rules. I’m out. I’m not gonna wait until the EOD. Nope. No way.

I simply exited out of all my positions. What can I do?
So when I get home, I eat, of course, and then go ahead and document all of what happened. Cause I already have things like my ending account balance. So, it was like I was compiling my EOD trading data. Cause I was done already. Right? Well, if you really want to know what I ended up with, it was -1029 pips. Sure. I’m sorry I kind of messed up. I was aware of that. But see, I don’t play with noted stop losses. When I think it’s dire, I’ll do it. I’ll jump like it’s hot. In hindsight though, if I would have stayed in till EOD, I would have been 59 pips better. What’s that. Surely that wouldn’t have made any kind of difference. I lost. Big time.

I mean hey, what can I do? It doesn’t feel good. Whatsoever. But I do find this very interesting, how the market was definitely winding up for something. It just didn’t go by way of what the trend was. But, I did find out why, later. I’m pretty sure it was the interest rate decision by one of the two currencies (AUD,NZD). Sure, it explains it. There was no other currency that was being bought! Every other currency was being sold against those two. And, I’m telling you, they (both) were not considered trending high before this event. You don’t want me to bring up their respective charts. Trust me, they were heading south.

So. What do I do now?
Well, I’m not gonna be moved about what the market is doing. We got 2 more days to go in the week. I play the week, remember? I’m sitting out now. And that’s the way it’s gonna stay, until I at least see what Thursday’s EOD shows. I had a bias of them short. Maybe this scenario will show up later on. Who knows?

Here’s the rest of the weeks results.


Well, now that my stupid colored squares are not in the way (cause I’m out of the market). Look at the volatility numbers. Thurs shows way low volatility (786). Looks like all the air got sucked out of the market. But look at the top. What’s it showing? Well, both the NZD and the AUD are still up there. It was continuing on from the day before. Just at a lower volume.

Well, what about Friday? What does this tell us? About those two?
They are on the other end of it.
Huh. How about that?
They were what was being sold. Ok. They retraced their gains from the week. And what about the volatility? Man, went above 1k. That’s noticeable. I think it’s a sizeable retracement. Let’s look at another context. I just want to know whether this is a new trend starting, or not?


Sure, on Friday, they both were getting sold off. And pretty much the only ones too. But, by how much? Only as much as the day before, that’s all. Look. Their weekly ending numbers are not all that much, though (bottom). You can see that they are pretty average. So, I’m not thinking they are really turning the trend, just yet. No.

Now. What I really think is interesting is this.
The JPY. Just pay attention to their showing. Remember, they’ve been on the incline this month. But have they demonstrated much selling? During this whole fiasco? No. No way. Who was the currency being the most sold off?

The CHF, on that Wed. Then next most sold was the USD. Those are not all that big of numbers though. In fact, compare those to the avg. numbers I got there. It’s much less. Even on Thursday. Hardly any kind of selling going on. All what was going on in those two days was just a buying frenzy of the AUD and the NZD. That’s all. It was all spread out over all of the other currencies.

What I’m saying here, is there’s no piling on of any currency for short. Absolutely not with the JPY. They are not being sold off. They are not the currency every one is selling. No way. Look. All year long they were. No doubt. That has changed now.

For a conclusion, this week. I would not say we had either a risk-on or a risk-off sentiment going on. Cause, if we would have, then the JPY would be in on it, no doubt. But they weren’t! I believe there’s a bias that the Yen is wanting to come on up. I believe they are trying to gain some traction. There was a focus on the antipodean currencies this week. That’s all.

Well, let’s look at their respective trends then.

The AUD.


Yep. According to what I consider breaking above and out of this downtrend, would be there at the 56 point (that’s the 56th trading day of the year). That drop right there. I believe above that point is back trending high. But no, it didn’t quite make it past it. Then Friday brings it all back on down.

How about the NZD?


Same thing here. At the 56th trading day. Ok. Sure. It went above that. But then what? Went back down on Friday.

All I know is, the more I’m typing here about these two, the more I’m convinced they’re not turning the trend. All things considered. Especially what I showed you about the JPY. In fact, let’s look at them also.


Yeah, you can’t tell me they’re not supported, from going lower. I mean, they have to shoot lower than that swing low they printed like a couple weeks ago.

Look. I realize that anything can happen in the market. These guys could easily be taking a break from being sold off any more. And even winding up for another leg down. Sure. But, being around the market for a while, I know that there’s a saying for the month of May.

“Sell in May, and go away.”

That simply means the month of May usually will bring a risk-off sentiment. And that means a buying up of the JPY. Maybe, just maybe, we could be heading for some of this soon. Right?

Well, I’m getting away from what I was originally trying to do. Make a point about the new data that I will be collecting. This has to do with my trading, not really about market sentiment. And since I started trading this new strategy in March, I have the back testing data since then. Take a look at my consolidated numbers.

2021-04-17_10-35-08
Each day (box) consists of this. Top left = total possible pips the market gave. Top right = what my trading basket of trades produced. Then bottom right is just the % of what I produced to what was possible (right side divided by the left side).

Well, I had a good month of March. Not a good month of April.
But look at Mar 23rd. Wow. Something happened that day. 3,094 pips. Talk about volatility. That’s like three times the average. Well, let’s look at that day.

2021-04-17_10-41-31
This day would be characterized by a pile on of the NZD. They were being sold off.
And the JPY was being bought up.
The AUD was being sold off.
Some strong USD.
Some strong CAD.

Look Journal. I’m only starting on this data collecting. I’m gonna build up this particular data base. And then…I need to go back and find those currencies that are trending and see whether it’ll be profitable, in the long run, whether the trending currencies have the edge. And, in my case, whether it’s profitable to be picking both the trending high currencies against the trending low currencies.

See, that’s what I need answered.
Is this an edge?

I know I need, also, to be asking whether it’s profitable to be trading a basket of trades to begin with.

God…I hope I don’t have to succumb to trading one pair, only.
Please…don’t let it be!!!

Alright Journal.
Ran out of time.

Thanks for listening.
Mike

Good morning Journal.

Let’s see, where do I begin?
I’ve been busy, Journal. That always seems to be the case. But, I’ll tell you where all this comes from. Actually, it was something I said (and this is probably the biggest reason why I write all this nonsense in the first place). But this is what’s been bugging me.

Yeah boy…I got to thinking about this. I don’t know why.
But I did say it.

See. The last thing I want to do, in this life, well, I should say, in my trading career, is to be main stream. Common. Standard.

I mean, I don’t even care if I become rich, if that’s the only way it comes. I refuse. I’m not gonna follow how other traders are gonna do it. Even if someone sat down with me, shown me the holy grail, a without fail system of trading, I wouldn’t do it. No way. Cause, you know what? I’m not in it for the money! I don’t care whatsoever about that. Like…where would my sense of accomplishment come from if I simply just copied someone else’s way of doing it?

I want to carve my own way.
I want to build something from the ground up. My own invention. My own method. A proprietary thing I’m trying to build.
My very own way of navigating the market for profit.

But see. I’m not beyond learning little nuggets here and there from what others are doing. Even taking a little something from this and from that, and putting it all together in your own way, sure, that’s technically proprietary. And I would accept that. No problem. But what I see others do, just seems to all be the same old thing.

In my mind, it doesn’t work. I don’t care if it’s price action. Support and resistance levels. Trend lines. Indicators. Anything on the chart that will seemingly tell you that if this happens, then this should happen next.

I’m not buying it. Because for every good answer you can come up with, I’ll give you two other answers of why it won’t probably work. Eventually, I believe, every trader will come to understand that anything can happen in the market. Every rule that you can come up with, will eventually get broken. Every pattern that you could count on to happen, will fail. The only thing that happens most consistently in the market is unpredictableness.

Sorry Journal, for all that nonsense.
Back to the point.

Been thinking of the main stream way of trading one single trading pair.
I know, crazy huh?
Yep. Pretty primitive if you ask me.
I’ve been down this road. The amount of years won’t accurately depict how much time I’ve actually spent on this. It’s the actual hours, and hours, and hours that I’ve spent my entire brain on. Cause someone’s years worth of time simply won’t compare to what my years worth of time will actually be. No comparison. I bet ya.

Well, my point here is this.

Can I make a trade and profit from it?

I mean, forget about trying to build up an account balance, for the time being. I need to set out to prove to myself that I can make a trade, and it become profitable.
And of course, you can see plainly, that this will entail trading one currency pair. Like, I’m talking, boiling all things down to it’s simplest parts. I don’t know, maybe I can’t trade. Maybe I can’t do this. I’m not gonna know for sure unless I see it for myself. And that’s where I’m coming from, with this.

That’s what I’ve been working on lately, Journal.
And this is what I got so far.
I’m calling this my Anchor Trade III.

Well. I don’t know how many times, in my trading career, I have to do this. But we’re gonna do this one more time. Start from the beginning. Simple as you can get.

Basically, I’m not gonna have rules. In the sense of having all these things I can do and cannot do. Guidelines. Parameters. Things like that. I’ve been doing that all along. And I’m starting to think that’s one of the big problems I’ve had. Sure, there were good reasons for them, at the time, but I got to do things differently now.

As you can see, I do have one major rule. Everything, and I mean everything, is gonna hinge on this.

Every trade must result in the positive.

Do you know where this came from?
Boy, do I remember.
Of all the things my mentor had taught me, “Exceptional Trader”. Of sooooo many things said, mentioned, both directly and indirectly it was this. It was the quickest, most subliminal piece of advise I’d ever received. Ever. And it wasn’t even for me! We were talking about something (I don’t even remember what it was) and he digressed for a second. He then spoke up and said this. And, believe it or not, at the time, I knew it was something that he had worked on with another of his students. He mentioned, as a suggestion, about having each trade result in the positive. I’m telling you. Journal. This came so fast. Went by quickly. Was gone. But it was something that stuck in my mind ever since. And I’m talking, no one would have caught this. No one! I truly believe this was a gold nugget. It meant so much to me, deep down inside, that I knew one of these days it would come in handy. In fact, I wrote it up on my wall, in my office. It has been up there for quite sometime now. I’m just glad I didn’t ever erase it.

I don’t spend any amount of time in my office anymore. But I do pop my head in every day though (cause that’s where the kitty’s litter box is at). We clean it daily. But, I still have things written on my walls. Honestly, mostly scripture. Now that’s what I want to see everyday.

Back to the point.
Can I do this?
Can I place a trade and it come out positive?
Every time?

Look. If I shoot for this, how close can I get?
I want to find out.

What if I :

  • Prepared every trade with the ground work laid already — analysis.
  • Will have waited for the right time for it to happen — waiting period.
  • Moved when the market is presently moving — seize the opportunity.
  • Remember my one and only rule, upon exiting.
  • Document and record every trade. For the purpose of proof.

Can you get any simpler?

Let me move on.

I’ll show you my first example.

I’m not all that happy with that, up there. Especially with the trade specifics. Cause now I see I’m getting into some regimental aspects. I don’t like it. But, I’ll go down this road with you, anyway. Check it out.

I start out with the currency that I had my eye on for sometime now. I’ve even been writing about this ever since the beginning of this month. And am still waiting.

The JPY.
My arguments.

  • Been sold off for a long time now.
  • They are no longer being sold. Supported. Since April 1st.
  • I (still) think that upward movement (around day 56 - 57) was an indication there’s money wanting to go north, eventually. I call it a clue.

Here’s what’s been going on in a much bigger picture. Zoomed way out.


Things just don’t go one way forever. And what’s been happening ever since the pandemic started, is unprecedented. I call this an opportunity waiting in the wings.

Like I said, ever since April 1st, this drop has stopped.
Look.


Top table is the monthly running %'s. Bottom table is individual daily results.
Sure, we can look at all of what’s happening. But I want to focus solely on the purple, JPY. They are being bought up more than the USD. For the month, JPY = +2.31%. USD = -17.03%. But you can see on the bottom table that they do have days where they travel together (which is the normal).

To me. There is no other currency that has more opportunity for something to happen, more than these guys.

And so. What about on the other side (since I’m forced to trade one currency pair)?
Who’s more biased to go down?

I pick the NZD.


We all know the NZD is one of two currencies most prone to take the other side of the risk-on/off trade. Against the JPY, that is. Right?

And, I still think that ever since day 56, that drop is telling (how many times do I have to be right about this). Well, it’s not climbing up above that level. And still holding true to a downward pressure on this currency. Last week came close, but didn’t do it. And when I compare this one to the AUD, I believe the fall will be harder with these guys than with big brother. That’s if it goes that way, of course.

Well, there you have it. My one pair that I have on hold.
Now, let’s look at their specific chart.


Boy Journal, I spent much time on this. Actually, it’s what ever trader probably goes through. Then I got very, very frustrated. Cause I know what’s gonna happen.
Let me walk you through it.

Bias is down. We got a daily support level right at the 76.90 area. Then the bigger one below that at 75.70 area.

  • Been on a long uptrend since the year started.
  • Made a nice, defined, retracement down to the 75.70 area.
  • Having consolidated up from there ever since. Not making any higher highs. Not making any lower lows.
  • Looks like a bull flag? Or a bear flag? Some kind of flag.
  • That big drop is the same thing their complete currency depicts at day 56. And is not really being broken up above it, still making my case of a dropping currency.
  • Next major support level is 76.90 area. That’s nice, to know. I guess.
  • Let’s see, what else is of importance?

I can probably come up with a hundred other things. No kidding.

And so what!!!

I don’t think it really matters. Whatsoever.

Journal, this just brings back so many memories of what I used to do. Chart reading. I mean, the market is gonna do what it’s gonna do. It’ll take off when it wants to. It’ll consolidate where it wants to. However long or short it wants to.

And guess what? The chances are pretty good that I’m gonna be wrong if I make any kind of guess of where it should do something. I can guarantee that!

Yep. This is just a smiggin of how I felt going through all this chart nonsense.
And I’m not gonna go through this again.

It’s vanity of vanities!!!

This is my conclusion to the matter.

Ready for this?

  • When I see a strong JPY.
  • When I see a weak NZD.
  • Aggregately across the board. With the other currencies following suit.

Then I will place a short NZD/JPY trade.
Simple as that.

With the idea of looking for a 10% increase in profit. Now, this is just some kind of idea I have. I can be flexible with this. I just need some starting point, that’s all.

And I’m not gonna be able to tell you anything else. Like:

  • What kind of time frame will I stay in this trade? At the end of a session? At the end of a day? A certain time of the week? Or even ride the week out?
  • How much profit will I accept? A little? Something worth it? Just as long as it’s in the positive?
  • What will I do if I’m totally wrong? Stay in? Let it ride out longer? Realize I’m totally wrong and cut my losses short? Break my rule for the sake of my account?

These are just some things I’m not gonna be able to answer. Sorry. This is probably where I’ve been going wrong all along. Who knows?

But, what I’m talking about here is downright consistency.
I would love to see the proof. Proof, that if I wait it out, I can make positive trades one after another. And start building on top of that premise.

I guess this does fall in line with what I’ve been learning lately.

Ok.
So.
What do we got now?
Another strategy in the works.
I’ll keep you posted on any updates on this, Journal. Like, if I decide to enter the market with this pair.

In the meantime, my other strategy is still running, of course. It’s the Basket trend one. I’m not having such a good month, though. What can I do? We’ll have to see what the entire month produces.

Well, that’s what I’ve been up to lately, Journal.
Thanks for listening.
Mike

2 Likes

Good afternoon Journal.

Ok. Well, here we go. I said I’d inform you when I move.
And I’m moving.

Well, right now, it’s 12:30pm Thursday afternoon. I’m on my afternoon break before I got back to work. I always have a couple hours this time of day. But, earlier today, I seen what I’ve been waiting for. So I pulled the trigger. Just now.

Just to be clear, again, what I’m doing here. This is my new strategy. It’s the Anchor Trade III one. I’m not gonna go into it again, cause I wrote it all up last time. But this is gonna be the very first trade. I’ll show you what made me do it (I just took some pics now).


We’re talking mid day now. This is the JPY pairs. And you know what I’ve been waiting for, with them. To get strong. Well, finally, I think the time came. And that would be right now.

And on the other side of it, is the NZD. I told you that it was that pair I’m watching. Bottom middle one there. Well, I have a feeling that this will be the start of a nice drop. First off, that’s a nice high wick up, and coming back on down now. Secondly, tomorrow is Friday. And I think we’ll see the retracement continue on down, during that time. Basically, I think we’re gonna retrace most (well, a lot anyway) of the gains made this week. Which has been a lot. Like, straight up.

Well, my patience is over and done with now. And that’s why I’m in. Look.


That’s all the proof you need.
Fresh new account balance (10k).
First trade.
I even put on a take profit, believe it or not. It’s for 40 pips. It’s the green line they put up there. 78.28
So yeah, I know I put a lot of money on it, but I went with what I had planned on previously. I’m looking for a 10% profit. Simple as that. And I didn’t put on any stop loss. I do have an idea of where I won’t let it go beyond. That already printed top it did earlier today. Right? I mean, nothing else makes more sense. But, I surely am not gonna show that to my broker. He doesn’t need to know.

So. Let’s look around at some other data I can show you, about what’s going on today.

2021-04-29_12-57-52
Whenever I want to see the intraday numbers, I go here. This is from Barchart. A service they provide. It’s the live numbers. Actually, it’s exactly what Babypips has going. Their Market Milk. Same exact thing. But this is on my excel chart. It’s constantly being updated. Every second. Anyway. We can see who’s doing what today. In the middle there. Every complete currency’s total. It’s just adding up every currency against every one else, except the CNY. I excluded them on this. And on the right is my basket trades that are running. I can see these numbers in an instant. It’s awesome. But, the reason why those middle numbers are not there is because that was where the JPY pairs were (you have to count them a little differently than the other ones). But, I had to jump out of those JPY long pairs that I had. That was at EOD Tuesday.

Anyway. You can see how the NZD, and the AUD are losing today. Well, I should say up to this point. See, this is intraday, as opposed to EOD. Things twist and turn as the day goes on. It’s very hard to know what’s been happening if you haven’t been paying attention. We’ve been through 2 other sessions already. We’re in the last one (USA) now. But, in my case, I have a feeling the JPY was wayyyyyy negative earlier today. And the NZD was wayyyyy in the positive earlier.

Boy, would I like to see the JPY turn positive before the day ends.

But mostly, I just would like to see that pair (NZD/JPY) make up some more ground going south, that’s all.

Let’s see. What else would I be looking at?
How about how this week has been rolling out…concerning the NZD.


That was my last entry, on Wed. And so, I was telling myself, that I have one more day to go (which is today). I call this day the inflection day. It’s when I give it the very last day, in which I will be in it. I’m talking about how my other trades are doing. In which the NZD is short, in my basket of trades. They are short as long as that latest line won’t go up and above the most recent high (that’ll be at the 74 point). You can see that Wed’s EOD point is about there. I have to see this through.

Well, I should be able to relax today, for the EOD results, right? Cause I know that they are faultering. I showed you their intraday numbers up above. Well, I just hope they continue to go negative, into the EOD. And then also, for tomorrow (I just think so). But, of course as always, we have to see what happens.

Alright Journal, I’ve talked enough.
Running out of time here.
I’ll keep you in the loop of my trade.

Mike

What a great start! I hope you do well in the forex trading.

Good morning Journal.

Well, where do I begin?
Got lots of things I would like to talk about. But, I think the biggest thing is that we just finished the month of April. And you know what that means…
Time to give a reckoning of what happened.
2021-05-01_09-16-35
And I did, Journal. I spent all morning going over the most important things I went through this past month. And well, I put it in the April Journal mind map that you see up there. Also I fill out the April Trading results mind map. (These are on my desk top)

I’m not happy about the results, this month. No way. But what can I do?
Therefore, I don’t feel like talking about it. Anymore, that is. Cause I already went through it. I digested it. I mourned about it. And already picked myself up off the ground. Don’t feel like getting down there again. That’s all.

Just read it, if you feel like.
Otherwise, we’re moving on.


That’s nice.

Anyway.
My new trading strategy trade went well. I completed my first trade. Here’s the summary of it.


Remember where I’m coming from, concerning this strategy.
2021-05-01_12-49-27
This is the main objective for this strategy.
I don’t care about:

  • how many pips to attain
  • how much % of account to attain
  • where I should be getting in at
  • where I should be getting out at
  • how long the trade should be in the market

One thing only.

— Every trade must result in the positive —

I’m a perfectionist. And we’re gonna find out how many trades in a row I can accomplish this task. So, you better believe I will be:

  • Exercising much patience before I engage in this trade
  • Have spent much effort preparing, in advance, the context of a pair
  • Taking full advantage of an opportunity that the market might produce

Yeah Journal, I’ll tell you one thing I really liked that I did with this first trade. It was waiting out the week. And then accurately calling how the last day will turn out. Look. I know I could have been simply lucky. No doubt. And I can’t possibly think I have an edge this way. But, I got to tell you. I do remember, quite some time ago (few years for sure), that I pondered this trading edge. This is something I’m gonna have to remember, and address at some point down the road.

This is the edge.
Watch what happens on Monday…Tuesday…Wednesday. Even Thursday. Then, given all this set up, and run up, enter in with the flow that is to take place at the weeks end. And Journal, that’s exactly what I did with that trade. It was mid day on Thurs. that I got into it. And this is exactly what I’m talking about when I say to get in the flow, for the end of the week. See. The NZD and the JPY both made it quite easy for me. They both had such a run up, like one way movement, that come end of week it really can only go the other way. Well, the probabilities are quite high for that anyway. Check this out.


Well, first off, you have to remember that before this week even took place, I had such a bearish bias for this pair. And so, what happens? The week takes off, and so does this pair. Of course I’m in disbelief. But know that I am wrong. And am very happy I’m waiting, also. Right? But there it goes, straight up. Every day. And then on Thursday, mid day, I see that the NZD, as a complete currency, started to turn negative. But also, I seen that the JPY also, started to turn positive for the first time in the week. But it’s those things that made me convinced of getting into this trade.

  • The initial bearish sentiment, that I previously put a lot of work into.
  • A high probability of a retracement before the week ends.
  • Needed enough of a drop down. It went 149 pips straight up since the week started. And I only wanted around 40 pips worth of a sell.

Boy…I got to remember this. I feel this can be exploited, as an edge. It’s like playing the week, as I’ve mentioned that I would like to do.

But, if I were to ask why this trade of mine worked? What would the answer(s) be? And I’m just wondering if this aspect of waiting and seeing what happens in a week pays off at the end of it? Well, probably so. But coupled also with the other aspects that I have built into it. You know?

That’s nice.
I know.

Well, I got to cut this Journal.
Will be back tomorrow morning. I do have much a want to get down in here.
Lot’s going on.
Thanks for listening, Journal.
Mike

Good morning Journal.

Can I show you something interesting?
You have to see this. I’ve been noticing it all week. But then yesterday morning, it all came together, and I took these pictures to make the point. I find this very interesting!
Let’s see. What would I say the point of this is?

How the aggregate is much more important than the individual parts.

And I believe that this gives me an edge.

Let me set this up. All last week (and you should know) I was watching the NZD/JPY pair. Well, honestly, only when the EOD came. You know. Cause, for one thing, I was in disbelief of how it can continually be moving up. And on the other hand, you should know that I believe in the aggregate pip count chart, for a particular currency, is more telling for the direction than anything else. The aggregate is simply the sum of all it’s parts. Right? And that’s why I’m not a fan of looking at one currency pair chart.

Now that’s my point, if anything.

Check this out.
The NZD. It’s aggregate pip count chart.


We have one of it’s parts (NZD/JPY) matched up to that, since the years start.
But what gives me the edge here is what is happening in the aggregate (above). Not in the particular chart. This is how I was reading them.
Ever since that precipitous drop (on the top is at day 56) I felt that if it rose up above that point, I believe the down trend would change (go ahead and match it up with what’s happening on the bottom). So then day 74 comes and that point get’s rejected. Now if you draw a line across the top of that big red down candle (Mar 22) then that would correlate to what’s going on with the top chart. Right? So then, I’m thinking that there must be a resistance line there. It gets rejected there like 3 times.

But then comes this week. Monday’s daily candle broke up and over that resistance line. Right? You can’t argue that. Ok. Well, some would say that you don’t go by one line, you go by an area, which is nothing more than a buffer space. Ok fine. I’ll give you that. So then Tuesday comes. Wait. Before we move on, let’s compare to what’s happening on the aggregate chart. Monday’s line goes up. It’s the 81 line. Remember now, my line in the sand is now at the 74 point. The 81 line does not go up above it.

I guess I have to give the picture again.


Now, Tuesday comes and prints a small daily green candle. Slightly higher. And on top it prints a down line. Remember what we’re doing here, comparing it’s aggregate to just one pair. But then comes Wednesday. It prints a big green candle. And it’s aggregate counterpart does what? Well, in my book, I call that the inflection point. It’s the apex point. And from experience, this tells me that I have one more shot at it. I used to jump out at this time, but after getting burned soooo many times I’ve changed my rules to make me stay in for one more day…see it through.

Thursday comes. Apparently during the Asian session, boy, it’s climbing. And then through the London session and into the US session it’s making an about face. Coming down. And look. You know the story how I came in here and wrote up that I’m getting into this trade at that time. I’m gonna take the opportunity (for the fall).

But the point here is that Thursday’s print on the aggregate chart is a down line. The inflection point turned back around. That told me that the prevailing low trend was still intact. And on the other chart, it prints a doji candle. Indecision time. Looking like a top forming. Right?

Look. I’ll make the point. I was just wondering how it could continue on up (on the bottom chart) but not technically breaking up and above on the top chart. What would I want to trust more? The aggregate chart or the particular chart?

It’s a no brainer. The aggregate is what you would want to rely on. As this week was unraveling, all I kept thinking was how much easier it is to trust in the aggregate.

When I keep looking at that NZD/JPY chart, I guess someone could say what would clear it all up would be to take into consideration the two tops that were printed earlier. And that would give you the area resistance to be mindful than an actual resistance line. Ok. Fine. I’ll buy that. But, a line is easier to manage than an area.

Well, I’ll tell you what’s more interesting than that. Ready for this?
Let’s keep with the NZD.
There’s other parts involved though, right? Well, let’s look at them. Let’s compare this whole set up in the same way. What kind of conclusions can we make with these other ones?
NZD/CAD.


Well, if I were concentrating on this pair, only, I would have been getting fooled. Cause I would be thinking that when it rose up above (around the 19th) the resistance level, I would be like this is a break up above and a retest kind of situation. Like the beginning of a new trend. Up. But nope. No way. Someone would say that this is a fake out. And all I got to say is that I didn’t get faked out on the aggregate chart.

The GBP/NZD.


What to say about this one? shrug
Well, on the aggregate chart, the NZD has been on the decline since day 39 or so. You really can’t say that with this chart. I would have to say that the NZD has been on the decline almost the entire time. Except in April. It has gotten stronger and is resting on some resistance level now. This is a bad chart (pair). It just doesn’t tell us much. The match up is a tough one, for sure.

The NZD/CHF pair.


Yeah, you can plainly see the top matches up. Then it comes down. It makes lower swing lows. But it is quite clear on this pair that the down trend is more evident. And then look at the latest consolidation period. Now that looks like a bear flag, huh? But if you look back, it’s all stepped down, whether the landings or the swings. This pair would not throw you much in the way of a curve ball. Right?

The EUR/NZD pair.


Well, if you can do the inverse thing in your mind, you should be able to see that there’s more of a bias for the upside, which will mean a weaker NZD. I don’t know, it’s a tough pair. I think. Maybe it just hasn’t broken out of this magnetic sort of line, area, yet. shrug

How about the NZD/USD pair.


Yeah, kind of reminds me of the CAD pair. It looks like a faking out, or a breaking upward off of the resistance line. Or area. I don’t know. But now it’s dead on that resistance level that the big red huge down candle printed back around Mar 22nd.
I mean, is this a break above and a retest? Therefore that would tell me that the NZD can very possibly go bullish again. Right? Unlike what the aggregate is showing. This is interesting to me. Now. Who do we trust?

You should know my answer by now.

Actually, this is quite similar to the JPY pair. Let me put it up, take a look.


Interesting. You can probably read these two and conclude that it very well could be a break and retest. And we won’t know the outcome yet, until more days come. Now on the aggregate chart, the conclusion is made already. Back on down.

Again. This is interesting to me. I guess we need the rest of the story.

If the NZD continues on down, then it’ll solidify my notion that the aggregate chart is more correct. My beliefs will stay intact. But if there’s a change coming, and the NZD starts moving north, and then it’s trend change, well then I’ll have to reconsider my beliefs.

Actually I’ll have to see what the aggregate chart shows. Cause you never know, maybe we can get fooled on the aggregate, just as we can on the particular ones.

Well, sorry Journal, for all that nonsense.
Yeah, I did want to throw all this up there.
But I do want to start thinking about what I’m gonna do next. Remember, it’s important to lay the ground work for whatever trading is next.

Ok then. I’ll cut this short and come right back. I plan on working through the process with you. And we’ll have to see what kind of conclusions I come up with.

See you shortly Journal.
Mike

Journal.

The question for me is, what pair(s) will I consider trading?
This is just the process that I do on my Anchor Trade III strategy.

Well, the only thing that makes sense, is to come back to where I last left off at. I had success with the NZD/JPY trade. Maybe there’s more to come with this. Right? I mean, I’ve already laid a lot of ground work with it.
Which is:


My bias for the NZD is for down. Who knows…Surely it could hit some resistance and bounce right back on up. We could be seeing a higher swing low if it’s the case of a bullish trend trying to form. Right? But that’s always the case. The market can do anything it wants. You can make a case for just about anything to happen. Honestly. It depends on whatever context you want to put it in.

But what I’ve learned is that you have to go with what it’s telling you right now. And then be prepared to change course if that change occurs. But what I’m seeing right now, up there on that chart, is it’s on a down trend ever since day 38 - 39. No one can argue that point with me. That is what’s correct. And since we are in the business of trying to figure out where things are gonna go next, well then, I believe you have to pick what the current situation is saying. Not what it could be saying.

That’s nice.

The JPY.


Well, I’m not gonna lie. I definitely thought that out of all that consolidation we would be seeing a move up. But nope. Down it goes. Even more (can you believe it). Well, my view on them is this. I need to see something quite big. This last leg down has told me that there’s money that still wants to go short the JPY. Therefore, I absolutely will not jump in any Yen trade…yes…including this pair NZD/JPY…until I see some fireworks. I mean, I’m not gonna risk a cent unless they convince me it’s going quite far up.

Look. We’ve just entered into May. That’s the month to Sell and go away.
What I would want to see is the JPY be on top of the entire stack. Being the most bought currency, convincingly. And I’m not talking about a little bit either. Maybe I will even wait until I see some EOD prints go up and above that resistance level (-6k on the chart). It’s just too risky to try to call a bottom with these guys. Honestly.

I’m gonna move on. But, those are my sentiments concerning this NZD/JPY pair.

Anything else?

Well, while we’re close to the risk-off sentiment, let’s take a look at the CHF. This chart should help.


Now. Keeping with the risk-off theme, you should be able to see that when the JPY came up and leveled out there (that’s in April btw) that the CHF also rose up. I’m talking not just a little either. Way much more than the JPY. And then was supported from falling back down. So yeah, I would say that the CHF was the more bought up currency for the safe haven pick. But see, the risk-off sentiment really didn’t materialize all that much. But at least it was somewhat evident.

Well, the only other currency that might depict a risk-off scenario would be the USD. Let’s look at them.


April was straight down. Selling for the USD. But…you have to see that we really didn’t know that when it was happening. What we did see, as it was unraveling, was that it was retracing some of those gains. See that little zig zag around the 1000 pip line? It easily could have bounced back up from there. We didn’t know what was gonna happen around that time. Remember, we just got done doing a lot of Dollar buying. And this would have been a real good time to buy the dip, and go get some more. But no. Down it goes.

Remember, selling of the USD pretty much means buying a lot of the other currencies. More like risk-on. Well…there’s so much other things going on, you just can’t bottle up what the exact market sentiment was so simply. Between the US fundamentals, risk-on/off, technical reasons, treasury yield differentials, global trade flow reasons…geeeez, the reasons can be many. It doesn’t matter. All we really care about is if there’s a trend or not. Right?

My point with them is, that’s there’s no correlation to what they were doing and what the other 2 safe haven currencies were doing. Now, I don’t know what to make of that last huge bounce at the end of the month was for. Was it simply profit taking? Could be. Or maybe it could be a sign of things to come, for this new month were heading into. We never know. But we do know that change likes to happen around the turn of a month. And for an example of this I would say just look at the beginning of April. A double top occurred all around this change of month.

I would say that my bias would be for a long USD. Just like with the JPY, I would have to see something convincingly. Not just a little elevated either. And I would say that there would have to be some correlations with the other 2 safe haven currencies. I would need to see them rise up for the occasion also.

Let’s look at the AUD. Any similarities with the NZD?


This is a little different. Seems like we have a cliff here. Boy would I like to see it’s aggregate EOD count drop below the floor it’s pretty much sitting on now. Right? That surely would spell a lower AUD. Cause we do have lower swing highs. And a fall off this cliff would make me risk my money. So…I guess this is quite simple. I’m gonna let that be my trigger, or I should say my confirmation factor. A green light.
And that would be for a short trade. I would have to pick the long trade currency, in order for a pair.

Either one of the safe haven currencies, or even the USD, if the market goes that way.

What about the EUR?


They are on an uptrend. No doubt. Clearly since April. Now this just might be one of the currencies I could depend upon for long. Right? There’s no secret here. The consensus has been a buy. This is technically speaking. I’m quite not sure what will happen if we go by way of, safe haven, risk-off buying. Compared to the USD, their a risk-on currency. But compared to the AUD & NZD ones, they could be more safe haven than not. I don’t know.

For these guys, I would only consider them if I start seeing some EOD prints above the resistance line there, 2k line. That would tell me that money would want to continue to buy the EUR. Therefore, my bias for them is for long. Above that line though. Only. You never know, they could be topping out around here. shrug

Let me start spelling this out. So I can see clearly.
Currencies, with my bias, with the conditions that must happen.

JPY — For long

  • Must head convincingly high first
  • Must be correlating with other safe havens moving high

USD — For long

  • Must see broad risk-off sentiment occurring
  • Must see an EOD print above 220 on their chart

CHF — For long

  • Must break up above the -1500 level (2 swing highs ago)
  • EUR must be moving up also

EUR — For long

  • Must rise and stay above their resistance line, 2k line

The GBP.

  • My bias is for long
  • I don’t have anything for them now. I think their consolidating between the highest swing high there and that 4k line.
  • They would really have to move in order for me to consider trading them.

The CAD.

  • My bias is for long
  • As long as they stay up above the 2000 line, I would trade them

The NZD.

  • My bias is for short (already shown above)
  • As long as they stay below the 0 line

The AUD.

  • My bias is for short
  • Waiting for the fall off the cliff (a definite prerequisite)

More simplification.

Possible pairs that are on the table. In a somewhat order of preference.

  • NZD/JPY — Short
  • EUR/NZD — Long
  • EUR/AUD — Long
  • AUD/CAD — Short
  • NZD/CAD — Short
  • AUD/JPY — Short
  • NZD/USD — Short
  • AUD/USD — Short
  • AUD/CHF — Short
  • NZD/CHF — Short

I don’t know. I’ve realized this for some time now (and especially because of my basket trend strategy) that we’re only talking about an AUD, and NZD currencies for short. Everyone else looks poised for long. And it seriously drops down the possible pairs to be able to trade. I know the market doesn’t care about that, one bit.

I don’t want to trade the USD for short. Either the JPY for short also. I guess that would explain the unbalance.

We have a new month ahead of us. It’s the second month of the second quarter. What does that mean? Uhhh…I don’t know. I guess we should be aware that we’re heading into the summer months. Things can change. But then again, the world thinks we’re all in risk-on mode. And that it won’t really change. Look at all of the worlds index’s. Their all at all time highs (well, most of them anyway). And look at a lot of the commodities. Their going through the roof. Will all of this exuberance continue?

It surely could! There’s so much money floating around it ain’t even funny. Those who have the control and means in which to affect the market surely have the ability to do it. The risk-on currencies could very well take on another round of buying. Remember, they’ve been on a break lately. They only need a couple days worth of buying to turn the tables. It can happen in a weeks worth of time. I think.

Yeah, this is something I need to remember. If they turn long, well then, I’m gonna be sitting out. That’s all.

But…I got to tell ya, I am wondering if the “Sell in May, then go away” notion will hold true this time. I just don’t know. No one does, really. We just have to see it through.

BTW…I never did look at any of those single pairs up there. Their particular charts. And I’m not going to either. It just doesn’t make sense to me. I’ve mentioned this before, that I could make the case for each one to be both bullish or bearish. So what’s the point? I was surprised on what happened with the NZD/JPY last week. But seen an opportunity, and went for it. And it paid off.

But, I do have to realize that another factor helped out a lot. I talked about this. It’s waiting and seeing how the week is unraveling. And when it gets close to the end, seeing a little change in the trend taking place, surely helps for the opportunity. And I guess that’s what it’s all about. Right? Making the profit.

Not as much as trying to guess what the market will do.
This can be deadly.

It is better to follow, than speculate.

Alright Journal, sorry for such nonsense.
I’ll be in touch (if something goes down, and I move).
Thanks for listening.
Mike

Good afternoon Journal.

Well, here we go again.
I’m moving.
It’s Thursday afternoon, just at 1pm now. I only have about a half hour to tell.

But, I’ve been keeping my eye on the NZD/JPY pair again. And I just pulled the trigger. Here’s the details.

I kind of think we’re gonna see some things fly around here soon. Like, maybe surrounding the 'ol NFP time. We’ll have to see though.

Here’s what’s been going on with these guys. Look.


You probably remember my previous research concerning this. Well, it’s all written up. But anyway, I marked my last trade. It was last week. Mid day Thurs through Fri afternoon, just before EOD. And then you can see how this week has unraveled so far. I marked when this week started, with the line going down. And yeah boy, I do remember on Tuesday that drop. I was like getting that FOMO feeling. You know how that goes, right? Seeing those 1hr candles just keep adding up, red. Cause you know that I’m bearish this pair.

So yeah, it goes bearish again. But I don’t buy into it. Nope. I’m gonna wait it out. And what do you know, here comes Wed. Roaring right on back. See all those green candles moving up?

That’s nice. But just look at that one big huge red candle (like around 16 hours ago). That, is a monster. I think it’s telling. And it ain’t bullish, in my opinion. And it didn’t swing an higher since then. Actually, it kind of reminds me of the choppiness that occurred last week at this time. See it there? Right around the time I got in that first trade.

So yeah, that’s all good and nice, I know.
Well, tomorrow is NFP Friday. Man…I’ve just been thinking that things are gonna go somewhere. Look. I don’t know where. But this just might be the occasion that kicks it off. Then again…who knows? This market isn’t predictable at all.
Anything can happen.

But, I do have to tell ya Journal. I’ve been looking around for any other potential pairs. Trust me, I’m not a fan of doing this.
I’d rather be called the macro man. Surely not the micro man.
Anyway. I’ve been mentioning about a possible falling of the cliff scenario concerning the AUD. And if it happens to be that they start getting sold off, boy, I have found a couple of pairs that I’m watching closely. Check these out.

AUD/CAD
Daily chart.


I think there’s some serious opportunity with this one. Strong CAD. Weak AUD. And I think we’re presently sitting on a cliff right now. Should spell some money.

And the AUD/CHF.


Kind of the same thing here. But, with this one, I would have to see some serious safe haven play going on. Risk-off sentiment. Cause the SNB don’t like to see it go down. But when everyone hops on board, and it’s sliding… you can’t stop that train.

Alright Journal.
Ran out of time.
See ya on the other side of things.
Mike

Good morning Journal.

Well, it’s Sunday morning now. Yeah, yesterday morning I was quite busy. Oh…you know, just trying to figure out stuff. I’m still bothered about a lot of particulars, that have to do with my strategy (what else is new, right?).

But, I’ll have to share with what it led me to do yesterday, during the day time. This was fun. I spent a lot of time doing this research. I broke out the pencil and paper and got to writing a whole lot of stuff down. And guess what was the source of my research?

Yep. Right in here. Babypips.
Probably (no…absolutely is the most correct word for it) the most influential B.P.'s thread that has ever affected my trading. I went back through it. From the beginning to the end. I wrote down the most important things about it. Yeah boy, I filled up some sheets of paper alright. I needed to compare exactly what I do against this fundamental methodological way of trading. Kind of like getting back to the roots of something.

The Forex Portfolio - How to Gain Consistent Profits by Staying in the Market 24/7 - Trading Systems - BabyPips.com Forex Trading Forum

Note…If I were you, I wouldn’t go through it now, cause I’m about to give a highlighted summary of the main points. Now…afterwards…yeah, I believe everyone should read it, and see how it grabs you. It’ll be for some, but surely not for all.

And that’s the thing here, this is not a particular way of trading. It doesn’t tell you when to get in a trade, or when to get out of a trade. The best word for it is methodology. It’s a different type of style of trading. It’s consists of how one should view the market. It is a different way of navigating the market. But anyway, I needed to go back and get the full gist of it, again. And then compare that to what I’ve been doing. Well, comparing it to how I view and navigate the market.

And btw…all this is being compared to my basket trend strategy that I have.

I know I’m missing some things. It’s the tweaks and adjustments I feel I need to fine tune how I go about my trading style. That’s all. I wanted to go back and try to completely understand why this methodology worked for him. Actually I kept thinking, all while reading it, I should compare what the market was doing during this time. It started in Jan 2013. It was in full bloom during the first half of that year. And I have a feeling that the market was probably going through some serious trending stages. Well, without knowing for sure, wasn’t that the time when Japan went through the beginning stages of devaluing their currency? Hmmmm…I kind of think so. And what a time it would have been to be on board with a methodology like this. In fact, any kind of trend strategy would have worked out nicely.

Anyway.
It is a factor and something to keep in mind, for sure. But, there is things to be learned here. Especially when Clint enters the scene. Man…he made me write some serious stuff down. It’s like, when he talks, you better listen. He’s smart. But the thing was, he got quite excited about this way of trading. He got all kind of into it. So it was nice to see how he progressed through it. His thoughts. His suggestions. Boy…it’s almost like gospel to me, of what he thinks. But the thing was, he kept to MG’s script. That’s one thing he didn’t do, alter any part of how to trade this way. He mentioned that several times. He said he would start out trading it in the exact way. And then maybe later on would or could change some stuff about it. Cause remember, this is not telling you when you should get in…when you should get out. There’s no signals to follow. It’s all about guidelines.

Anyway.

I need to get to some points.

What did I get out of this?

This is gonna take some time. To digest.
To find out exactly what I should do about my trading, in response.

Well, how about I start here. I’m gonna throw out to you, Journal, some of the things I wrote down. This is the stuff that I am pondering. This is what grabs me. But I’m not too sure what to do about it. We’ll see how this progresses.

The thread is long. Kind of. So, what I did was consolidate all the important page numbers. This will be like a cheat sheet. Quick table of reference. And what jumped out to me.

Page # 24 — Almost always have a portion of each currency.If one is performing better, I’m generally adding to it.If one is not doing so hot, I generally pull back a bit on it.

Page # 84 — Risking 1 unit for each dollar in available equity (not account balance)No initial setting a profit targetNo initial setting a stop loss“As a result, I’m able to capture all of the trends.”“If you ever see a lengthy trend in the market, I was in it.”“That’s what I hold out for. Large pip movements.”

Page # 120 — (Something good)

Page # 219 — I never add to the position or subtract from it. I do base my pip size off my equity and not my A.B. So in a way I’m benefitting when my open trades are doing well.

Page # 222 — I never add to my position. As my pip size is based on my equity, when my existing trades rise, it allows me to enter into new trades with a larger pip size.

Page # 278 — I’m not an Oracle or is my way the only way, But I’m more interested in the overall mindset and thought process. For I feel above all it’s how you view the market that will be the differentiating difference between success and failure.

Page # 907 — In reference to suggestions of adding or subtracting to positions, I’m not against the idea, But I think that would require more work for those that want to head down that road.I don’t like the idea of starting with half positions with the intention of adding to them.Now here’s where to me lies the importance of all this. Treat losers the same. If you are willing to add when things are good, then subtract when things are bad.

Page # 874 — Clint enters. From here on out, it’s all his advise.

Page # 928 — I now think that a long position should be closed after the bias on that pair turns to NEUTRAL.My rules — When a bias is judged to be long, and I’m not in any long position, then go long entry. If I’m in a long position, then HOLD. When a bias is judged to be short, and I’m not in any short position, then go short entry. If I’m in a short position, then HOLD. When bias is judged to be neutral, close any open pair. Stay on sidelines until a long or short bias is judged.

Page # 998 — (Something good)

Page # 1188 — Recap of the rules.

Page # 1197 — Calculating the exact risk involved in this portfolio methodology.

Page # 1203 — "I’m quite sure of one thing: the best way to make your trading more robust — is to improve your win-ratio.

Page # 1210 — "As I see the task for all of us who trade this methodology, there are 3 main parts to each trade, & we have to do a good job (at least, overall, on avg) with each one of them…

  • IDENTIFY A SUITABLE TREND EARLY
  • IDENTIFY AND GRAB A WORKABLE ENTRY PRICE
  • IDENTIFY A BREAKDOWN IN THE TREND EARLY - AND EXIT AT THAT POINT

Page # 1213 — In simplified terms, the methodology involves identifying & entering a valid trend and holding your position for as long as the trend remains valid. Obviously, this requires a solid understanding of trend trading, including successful strategies for — (1) IDENTIFYING A TREND(2) ENTERING IN THE DIRECTION OF THE TREND(3) IDENTIFYING THE END OF THE TREND. In which that #3 is the basic exit signal.

Page # 1270 — This thread presents a powerful methodology…which can supercharge the trading results of almost any swing trader who is ALREADY CONSISTENTLY PROFITABLE.

Page # 1321 — Prerequisite for successfully trading the MG99 Portfolio Methodology.Summary : In order to be successful trading a portfolio of swing trades, I believe you must first become successful trading individual swing trades, one at a time.So the take-away message is this : FIRST, develop your skill as a swing trader; then take your swing trading to the next level, by employing the portfolio methodology.

(And, in anyone is interested, I come on the scene at post # 1229. In Dec. 2013)

That’s nice, I know.

And here we are Journal. Me…you…my Lord & Savior…and that last take-away message.
Am I worthy?
To move on?
Honestly.

Yeah, I’ll be honest with you, alright. The first thing that comes to my mind is that I am in no way successful. Consistent. If I were, then why can’t I brag about an ever increasing account balance? Sure, I’m a perfectionist. I’ll never relax the reins. But the question is whether I have honestly satisfied the criteria laid out by Clint (page 1270).

Well, the only thing I have going for me is that I post just about anything and everything that I do, trading wise, in here. I got records. I’m not just a talker. Whatever I do in trading, I can (have) produced the proof. But have I? Have I produced the proof that I am a consistently profitable swing trader? Well, Journal, I guess you’re the one to answer that. You can go back and see that I have good months, and bad months. Well, and I guess that begs the question of what is actually considered consistent. It is a subjective question.

Ok. Well, that’s what I first think. I am not worthy. But then I have to really think about it. Reality. What is the real reality of my trading? I’ve been trading for some time now. I have experience. Probably more than most people, who have spent at least 8 years on the subject (cause you really need to add up all the hours actually spent).

All things considered, I’m gonna have to say that I am worthy. To move on, anyway.

Let me get to the real problem of my trading.

I need new rules for TAKING PROFIT.

Journal, this is what I’m presently working on.
Check this out. This was occupying my time yesterday morning. I took some pics.
This is the latest standings of my basket of trades running. Currently.


You can see my 9 trades that are currently running. At the top is the 3 USD trades. Middle is the 3 AUD trades. Bottom is the 3 NZD trades. Also you can see exactly when I got in them (little arrow on them all is when). On the daily charts.

And why did I pick these pairs? Cause I believe :

  • USD is trending low
  • AUD is trending low
  • NZD is trending low
  • EUR is trending high
  • GBP is trending high
  • CAD is trending high

Remember, TAKE PROFIT is the issue I need changing.
I trade a basket of trades. Initially, I’ve treated these as one trade. All for one, and one for all. I look at these as one basket. How much increase or decrease to the a.b. that they all are doing, as one entity. Not as individuals.

This needs to change.

It’s a shame to see those 3 CAD trades (right side 3) just continue on without taking any kind of profit. That’s all I’m saying.
Here’s a different view of those 9 trades. Look at the right side, pips.

There you have it, Journal. That’s what I’m working on. I have nothing else to say about it. Cause I’m not quite sure what the answers are yet. I’m even questioning if the process of how I come up with determining these pairs to trade, to begin with, is right.

Then I go to MG’s methodology. Can I compare what I do to what he does?

His method

  • Scan across all 28 pairs
  • Looking for trends - on each of those pairs
  • Objective - to be a part of a long trend - and on as many as possible
  • Treating each pair separately - entering and exiting per specific situation
  • Adding additional sizes as the trend continues (simply by opening new positions)
  • Eliminating any pairs that turn non-trending

My method

  • Determine if a complete currency is trending via aggregate calculation
  • List the trending high currencies & the trending low currencies
  • Tradable pairs are matched up - high trending against low trending
  • As long as both currencies are respectively trending, their running in the market, in a basket, treated as a whole, not separately.
  • Mostly interested in what the account balance is producing, as opposed to what the individual trades are doing.
  • Entry & exit of trades are directly correlated to EOD aggregate trend determination only. Therefore, the pairs are not individually analyzed.

Again. Can I compare these?
It’s almost like comparing me to the rest of the world. Right?
What he’s doing is simply looking around at any possible trends. Actually, is all based off of price action. I’m not coming from that viewpoint. My premise is making a determination off of the aggregate, and then going by that. It’s the one chart that tells what that one currency is doing. Trending high. Trending low. Or not really trending.

2021-05-09_10-40-55

Look. I can accept this. It’s not mainstream. I don’t even know if anyone has even done this. But…this is who I am. This is how I see the market. And I happen to think it’s an edge.

Now. How I come up with exactly who to trade…this is a different story. It’s just one way. Sure, I picked this way. I kind of thought it was the simplest. But I’m definitely rethinking this now. I might be realizing that I might be putting on too much conditions on which pair is in, and which is out. I know the market doesn’t care about that. In fact, I know the market probably doesn’t even care about who’s trending and who’s not. Well, at times, anyway.

What would another way be for me to this by? How about the criteria being as long as one currency being technically trending, as opposed to both being trending. That would open up a little more possibilities. I don’t know…I’ll have to explore this.

But my main problem, which I have to settle, is the taking profit part. Actually, I had a thought of solving this by using MG’s method. What if I just start using his precise numbers of sizing units (which is different than what I’ve been doing…which is double that amount). And then if trends continue I can add more positions, as opposed to more sizing. Just completely another position. With the one to one unit to a.b. amount. Know what I mean?

So. I can make it that as long as it’s trending, I have at least a stake in it. The longer it trends, the more positions I should have in it. And the more diminished it goes in a trend, the less positions I should have in it. Maybe that will take care of the take profit part. See? It’ll force me to either scale in or scale out. Seems better than the all or nothing scenario that I’m doing now. Actually, I don’t really have a predetermined take profit action in place. I’m just hoping that down the road something will trend long enough to generate increased profits to the account balance. See?

I’m gonna need some defined times for me to take profit. Simple as that.

Alright Journal, I think I talked enough.
This does give me some things to go on. Well, follow up with the ideas presented. Know what I mean?

Thanks for listening.
Mike

P.S. — Concerning my NZD/JPY trade.
It’s still running. Presently, in the negative. It’s ok though. I’m not fazed about it. I’m not gonna touch it until, at least, I’m in profit (don’t you worry about that). Remember my goal with that particular strategy?
You know it.
But I’ll keep you posted on any moves with it. In the meantime, it’s gonna run. Looks like it needs the time for it to.
And if there’s anything for me to learn about it, also, I’ll share as well.

Good afternoon Journal.

Well, I told you, if I were to move you’ll be the first to know.
I moved.

I’m talking about my single trading strategy. I came in here and showed you exactly when I placed it. It was back at post #590. Sorry. I’ve just been reading that post. I need to put it on here, cause something else happened that’s also interesting.

Well, it took some time, but my NZD/JPY trade finally went my way. See? Now, how hard is it to just hang in there and hold out until you hit pay dirt. Well, that time was today, for me. Take a look.


I jumped earlier this morning, when I had a break at work. The triangles are where I got in at and where I got out at. But I took the opportunity. Actually, during this time that I jumped out, I was looking at another pair. And so, after I jumped out of this one, I immediately got in on the other one. All I cared about here (NZD/JPY) was the being in the positive.

Oh, I remember. I jumped out at 8:30 am (cause I have until 8:32 until I resume my bus route). Man…the market was moving, at that time! I’m sure it was some economic indicator. For the US and/or the CAD (cause that’s the normal time it occurs for them). Well, here are some of the details on that trade.

  • +25 pip gain
  • +5.84 % to the account
  • duration = 6 days it ran
  • had 275,000 units on (2.75 lots)

Hey, I was happy about a positive trade. Remember my one and only rule?
Every trade must result in the positive.
Well, so far so good.

And you’re probably wondering what was the other pair I was looking at, right?
Take a guess?

Yep.
The AUD/CAD (short).
And that’s the reason why I cutted and pasted that much of that previous post. Cause I did have my eye on that one.
Well, guess what? I believe it was time for the falling off of the cliff.
So, what I did was, after exiting the NZD/JPY trade, I entered the AUD/CAD trade. No kidding. I did it in a matter of 2 minutes, no lie (cause my younger kids are waiting for me at their bus stops).


And then, when I’m all done with my morning time runs, and work, I have a couple hours before I go back (as is the case right now). Well then, I’m like, wow. I don’t need any more pips on this one! Looks good to me! I’m in, and I’m out. Just like that. Here’s the details I have on this one.

  • 270,000 units on (2.7 lots)
  • +45 pips gained
  • +8.67% to the account
  • duration 1 day (about 3 hours or so)

That’s nice.

And that’s 3 successful trades so far.
And now I’m out. Nothing running. Anything else would be too risky.

All this is on my Anchor Trade III strategy. The one-pair-at-a-time trading.
Boring. I know.

For my excitement trading, boy, are they running great today! Man…I must have every currency running their trend in a great way today. Look.
2021-05-12_13-32-07
Now, up on the right, that’s the total going for my basket of trades running. I have 16 pairs running. +768 pips for 12 of my pairs. And my 4 JPY pairs are at +206 pips. Then add them up for a total of 974 pips on the day for my basket of trades. Being up for a total of 8.02% today. Good day today, boy.

I guess if you wanted to see exactly who I got in my basket, this is what it looks like.
2021-05-12_13-38-28
You’ll see that pretty much everyone is trending according to what the market is doing today…all except the USD. Their very positive today. It’s ok though. I’m making it up with the other currencies.

Alright Journal. Got to run.
See ya next time.
Thanks for listening.
Mike

Good morning Journal.
Yes, I know, it is late in the morning, sorry.
But…I know, I know, you’ve been busy, right?

Yes Journal.
Very.

I’ll sum this up with a favorite line, from a movie. This is my absolute favorite quote.
Tony Stark (Iron Man) said this on the last Avengers movie, “The End Game.”

"I figured it out."

And his wife says, "You figured out what, Tony?"
“Time travel.” As he is staring out in amazement.
And she responds with, “That’s amazing…and terrifying, at the same time.”

Well Journal, that’s how I feel about now.
But look. I know I probably thought this many times in the past, but now, I’m just gonna say it again. That’s all.

I had help though. My brother Bob, who is an absolute genius (an engineer, with an extreme intellectual mind) helped me find the correct formula, in excel, in order to run the back testing data, that I’ve been fervently wanting to see.

But…it’s my strategy. This is proof to me that I’m on the right track, anyway.

Let’s see. Where do I begin?

You know that I have a few strategies floating around. But this one concerns my “MW methodology” one. It’s the latest one that I’ve been posting in here. You know the origins of it, because of MG’s portfolio methodology post. All that is written up only in the last couple of posts.

Well, after some tweaks in the last week, I’m down to the very last details of it. Honestly, I’m not completely finished with it, but surely enough to be trading it and getting some kind of results. But, I was able to do the back testing for it. And what I got so far is this years (2021) results. And, of course, it’ll continue on from here.
Boy I can’t wait to do last years back test. Cause what a year we had, right?

Let me unravel the strategy.

Wait. This should catch you up on most of it. Remember how I said this?

The heart and soul of my strategy will hinge on this big factor. It’s the starting point. It’s my edge. I truly believe if you find the correct aggregate currency trend, it’ll filter out the losing trades.

And now, I’m gonna go through this. All this will be what’s currently going on in the market today. And at the end of it, you will be able to see what I’m trading. And why I’m trading it.

This will be my step # 1.
What’s the aggregate trend, per currency?

Each currency will have a trend. Either trending high, or trending low.
No more non trending states. I must have a bias for up or down (there’s good reason for this). And well, whatever technical trending state it is in, that’s my bias. So, if ever you hear me talk about my bias, I get it from this trending state.
Let’s start from the top.
The USD.


FYI…there’s roughly 20 trading days in a month, just in case you’ve wanted to match this up to a month. And in this case, you can see that it was pretty much ever since the beginning of April (20-20-20) that this ‘trending low’ state really started.

So. The point here is, the USD is trending low.
And a quick explanation of exactly what that chart is, is the aggregate (sum total) of the daily pip count of the USD against the 7 other currencies. Basically, this gives you the macro sentiment of what the USD has done compared to all of the other currencies. Remember, I don’t care what one particular currency pair is doing. That doesn’t give me enough information, whatsoever. I need all of them, summed up in one chart. This one.

Let’s continue on with step #1 of the other currencies.
The EUR.


Trending high.
Ever since around April first.

The GBP.


Trending high.
In fact, last week it broke up and out of the consolidation period it has been going through for some time. See? We’re talking about technically speaking here. It very well could have broke down and changed trends last week, but it didn’t. It continued on with the high trend that it’s been doing all year long.

The CHF.


Trending high.
Ever since around day 65 it has been trending high. This was a complete change in trends since the year started. Cause it was a down trend up to that point.

The JPY.


Trending low.
And let us (me) remember some lessons with this one. Until it changes trends, stay with the technical trend. It could go on forever!

The AUD.


Trending low.
Ever since day 39 - 40. That drop turned it, cause it broke below the support area (between the 500 - 1000 gridlines). No more higher highs since. The floor has been sinking lower and lower. And btw…do you remember me telling you, recently, that I think the AUD is gonna fall off the cliff? Well, I think the beginning’s of it started to happen this past week. See it there? (day 93)

The NZD.


Trending low.
Ever since day 56. Do you see how it could never break up and out of that place where it dropped out at? Oh, though, it did come on up to the inflection point like 4 times. Just couldn’t do it. It reverted back to the low trend state.

The CAD.


Trending high.
At the beginning of March (day 40) it started the climb. It trended high. But then that trend broke down (in the 70’s days). As soon as it broke up and over the 2000 gridline did it technically start trending high again. Which brings us to the present time.

That’s step #1. Here’s a summary. Of all that.
2021-05-16_13-19-21

Step #2.
Pair up the trends, since we trade 2 currency’s to a trade. Right?
2021-05-16_13-23-01
The table underneath there is the specific asset being traded. If it’s green then it’s traded long. If it’s red then it’s traded short.

We have 16 pairs here. This is what’s running in my portfolio basket of trades.

All that satisfies the :

  • What currency pairs I trade
  • When traded (constantly running in the market)
  • Why I picked these

Now. There’s other aspects of a trading strategy.

  • Taking profit
  • Scaling in and out of positions

That’s, in order to minimize the amount of risk.
I’m working on those specifics.
I did take a lot of profit off the table last week. But re entered with larger sizes. We’ll have to see what happens, moving forward.

So.
Want to see some back testing data?
This exact way of trading, I have results. For this year, so far.
Remember, each currency has a specific technical trend. And each day of the year has either 16 pairs running, or it’ll be 15 pairs (4 x’s 4 = 16, or 3 x’s 5 = 15). Trending high against trending low states.

Let me show you an example of how I come up with the results. This’ll be last weeks results (since it’s pretty fresh in our minds).


In excel here, I got my cursor on the sample formula, in which all of the other results are pretty much the same. See the solution? It’s that which I needed to figure out. Anyway. What do we have here? Each days results. Pip results. Every single pairs’ results (28 pairs). From biggest to smallest. And the order in which they are stated in, is for a reason (it’s not what you’d see in the market). The first position is who was positive. The second position is who was negative. Those results are in the middle column. And my trading results (all who’s in my basket of trades) are on the right column. It’ll either be 16 of them, or 15. And then, on the bottom, is the totals. Don’t be concerned about the % under that (it’s just a measure of the total, which is on the left).

But, the middle column’s bottom total result will show you how much absolute total combined amount of pips the market produced that day. The only real use this figure can show us would be what kind of volatility the day produced. Comparatively. Like…if the market really moved a lot, it would be a large number, compared to other days.

I combined the monthly results. Here’s what this month is showing so far.
2021-05-16_15-34-52

I just started this. One week into it, on an account.

How about a look at the entire year.
Now. If I would have traded this way since the years start, then these are the amount of pips I would have accumulated, to a trading account. Notwithstanding scaling in and out of positions. Profit taking along the way. Etc…
It’s just pip accumulation. Plain and simple.


Weekly results on the right. Total results bottom corner.

So. I’ll tell you what I see. For this system.

  • Do have some losing weeks
  • No losing months (yet)
  • Healthy amount of pips on a good month

I’ll tell you what this means.
It is profitable to follow the trend.

Not every day is a trending day.
And not every week is a net trending week.
But, so far, every month is ending in the positive.

I cannot wait to run the numbers from last year (2020). We all know that we had some real doozy months. It should be interesting to see. Plus, it’ll all go towards what I can expect from the system. Cause, after all, that’s the purpose of back testing. You want to see how much draw down is possible. What would be average. Even, over the longer term, you want to know if it’s better than a 50/50 chance. Random. Right? And if it is, then it’ll be considered having an edge.

I’m gunning to answer these questions.
— How much faith can I have in this system?
— What are the potential extreme’s I could see?
— Maybe even get a sense of when the trending days will be in contrast with the counter trending days — that dynamic

Alright Journal.
Sorry I spent all day on here.
Much breaks throughout this entire post. Sorry.

Well, I am so looking forward to the end of the school season. I got 3 weeks and 3 days left. Then I’ll have the summer off.

Then, I’ll be kicking it into high gear with my business.
All I know is that I’ll be having early mornings, and much time throughout the day to be working on stuff. Boy I can’t wait.

Thanks for listening Journal.
Mike

Hey Journal.
Happy Friday.

Well, I moved.
So, I’ll give you the details of my trade.
This is on my one shot strategy.
I never did tell you when I got in with this one. So. Sorry about that. But it’s over now.
It wasn’t all that big of a deal. I guess if there’s a lesson in here, I guess it would be to just wait it out. That’s all.

The AUD/CAD.
Short.
Why? Cause my bias for the AUD is for short. And my bias for the CAD is for long. On the daily time frame horizon.


Trust me, this is not what makes me arrive at my bias’. But, for those who look at daily charts and stuff like that, well, this is what that particular pair looked like.
Yeah. That’s nice.
Anyway.

So. I got in May 13. About 6 am.
This is what I was looking at, on my phone.
2021-05-21_13-09-54
This was last Thursday. I kind of was hoping this would be a quick buck…
But it didn’t happen that way. Friday came, and went. Still nothing.

So. All I’m gonna do is wait it out. Simple as that. However long it takes, so be it.


See where I entered? On the left side? Hourly time frame here.
So…it’s a waiting game. Lower swing highs, so at least I can see the light at the end of the tunnel. But then it got me into some profit, but I missed whenever that occurred (I’m not a fan of watching the dog-gone market).

Well, well, well. Today something happened. I got to see the light, finally, on that last green candle. Looks like the damage was done already. And so, it’s time to exit.

Again. I don’t have any rules on this strategy of mine. Only one.
It must result in the positive. You don’t get any simpler than that.

So. That’s all good and nice. I know.
Here’s some of the details on it.

  • 270,000 units on it
  • +18.1 pips gained
  • +3.23% profit
  • held for 6 days

And no. I didn’t set any take profits. Stop losses. No risk reward nonsense. I just don’t believe in that stuff (that’s so overrated). I’ll be the last person standing, to box in what the market should do and don’t do. Sorry.

Anyway. Looks like this weekend I need to look around and see any other potential set ups (for as much as I hate looking at the particular pairs…I guess I have to, eventually…in regards to this strategy of mine).

I also took a lot of profit off the table, this Friday afternoon, in regards to my other strategy, MW portfolio one. I should do some explaining on that one, cause I think that’s wayyyyy more interesting, than for whatever a single pair trade could do.

Alright Journal. Thanks for listening.
I’ll be coming in here in the morning time.
It’s the weekend!!! Yay!!!

Mike

Good to see Mike take a shot a short term - and nice to see the exit.

Will be interesting to see if the algos force price back up half way - anyways tell Mike his posts are brilliant.

1 Like

Good morning Journal.

I got to tell you though, Journal, this portfolio strategy I have is working out very, very nicely. Let’s just say that the more I think about it, and see these results (whether during the current trading time or as I do more and more back testing), the more excited I am getting. I mean, this is it. Everything that I have ever worked on, thought about, tried to figure out, all are found in this way that I trade. It’s like home. You know, that place where you’re most comfortable. Safe. The thing you trust the most. And it all has to do with who I am & how I think.

Let’s look at how this week went. I got a shot that about explains everything. Mind you, this is only my second week on it. Sure, I was trading very similar strategies like this all along. But I definitely believe this is the final version.


I guess someone could dispute whether my currency determination stated trend is accurate or not. I guess it all depends on in what context you want to see it in. Sure. I could be wrong. Off. But…I don’t think so. If you don’t know by now how I come up with the particular currency’s determination, then you’ll never know. Let’s just say, it’s accurate (and I would go so far to say it’s undisputable).

So then, look up there at the top. That’s how the market resulted every currency, for a complete day, correlated to one another (compared to, related to). In %'s. And so. What we have in between what the currency’s trend is and how the market resulted — is an aggregate view of whether the market went with the trend or not, and by how much. Green means a trended day. Red means a counter trended day. And all I did was simply added them up, accordingly.

Now, why would this be important? Well, I’ll tell you why (cause I was often confronted with these questions). See. First off, you want to know how effective your trading is. And by answering these questions, you can actually get quite close.

  • Did you follow your plan?
  • Is your strategy dependent upon the trend, or not?
  • How closely aligned is your currency bias with what the reality is?
  • Do you know when the currency’s trend is changing?
  • Is the duration of your trades accurate?

My point here is this.

— You have to know what the market is doing. Trending or not.
— You have to know what has been the currency’s trend.
— You have to know when a currency’s trend is changing, or not.
— Your trades need to run according to the correct time span.
— You need to know if your strategy is matched up with what the market does.

I believe I can answer these questions by the way I monitor the market. And also by the way I monitor my trades. Needless to say, when those two things match up, it should spell profit. Pips.

That’s nice.

Talking about pips. That reminds me of how I’m currently taking some profit out of the market lately. Look. I haven’t totally figured it all out, like a drawn up plan. But I’ve been working through it though. I’ll share what I got so far.

I am taking profit.

I kept thinking to myself. It just doesn’t make sense to add on more positions. When, at the same time, I can just take out the profit that I have accumulated. And just continue doing what I do. Which is to have my trades run in the market, according to their respective trends.

So. Like I said, it’s been 2 weeks now, with this system. And at each week, I was confronted with taking some profit. This is a shot of when the first time I did it.

Well, my thought process was…Take the profit! I mean, it’s there. See it over there on the right? I arranged it by highest to lowest. Also, you can see that on every pair I have 10,000 units on it. And that’s because I started out with 10,000 of an account balance. The rule is 1:1. That’s 1 unit of a size to 1 dollar of available account balance. Your gonna want to remember this, moving forward.

Well, all I did was simply exit out of all of those pairs, from the top all the way down to the EUR/JPY one. That left me with 4 pairs still running below water. And then what? Well, I get back in with them. Why? Because nothing has changed according to what their bias is. I am not seeing any changes. Therefore, I’m gonna continue on with them. But with a different position size. Take a look at my available account balance. It’s under the Net Asset Value. That’ll be the value that I go with, for the 1:1 size.

Well, let’s move along the timeline. Here’s the next shot.


This is 9 days later (yesterday). But, I must of missed when I took some profit on some of the USD pairs. You can see under the UNITS column those ones that are sitting at 11,700 units on them. See, whatever the available balance is at the time is, is what I go in with.

So, it was at this time that I took some more profit. I mean, doesn’t it make sense to scrape it up? I think so. And look what I’m gonna go back in with. Net Asset Value = 12,100. And that’s what I did. Well, for the ones that are in the white (in the positive).

So what really happens here? Well, my actual account balance is moving up. I guess it’s like I’m padding the bottom line. My account.

This is what it looked like as soon as I did it.

All of the pairs in my portfolio have not changed. Therefore, you can say that, so far, I haven’t had a losing position yet. The proof is in the units column. Plus, being up over 20% in two weeks is quite impressive, if you ask me.

I can’t expect this to continue.
But, as long as the market continues to trend, maybe these results will continue.
We’ll see.

Well Journal, the only other thing that I’ve been up to, is the back testing.
Remember, how I really want to see what last years results were? Well, I’m getting there. This week I only was able to get the first 2 months done. I share the results.
But I do have to say, I was super surprised to see how the month of Feb turned out. I’ll have to explain why. But take a look.


The top 2 are Jan. Left one is the total amount of pips the market produced.
The top right is what my trading results, in pips, will amount to. The totals are in blue, for the month. But, I got to show you why I am soooo very amazed, that for Feb, I should have been so much in the negative. But I wasn’t. That’s about break even.

It had to do with the EUR. Their trend tracking that month.
But first off, I have to tell you about a rule I keep. This is a fundamental guideline I have to keep. This is the rule.

The trend will not change until the week is ended.
Therefore, the trends will be weekly determined. No back and forth within a week. Cause I believe that’s how the market actually works. To determine a correct trend, you have to give it the full week, to play out. This has proved extremely helpful. Except for this month. With the EUR. Take a look.


This was taken at the last day of Jan. 2019. All up until this time, I had the EUR trending low. You should be able to see why. So. All of Jan. was trending low. But, what happened in the last few days here made me switch it to trending high. My reasoning was the 2500 gridline. That was the last support/resistance area. But it broke up and over it. So, I am calling this trending high. Therefore, the EUR will be entering in the month of Feb going high (that move from very low to high is way too much…and I consider that changing trends).

And now, since I won’t change trends until the week is up, let’s see some of this progression.


One week into Feb (5 days) and this is the result. It came back down to the S/R line. So, I’m calling it still trending high. If that last day or two would have turned down, then I would have called it the other way. But no. So, their trend determination is high still.
Now we have to go one day at a time. You’ll see why.
This is EOD Monday results.


It broke down. Below support.
Well, the week is still young. Can’t make any changes till the end. See. This is the only way to really tell what the market is doing.
Then comes EOD Tuesday.

Well, just step back and see what this looks like. And it surely ain’t an uptrend. But, we got rules for a reason. Still trending high.

Then comes EOD Wednesday.


No that hurts. It broke down and kept on going.
All I’m doing is praying, at this time (and it’s only Wed.!)

Then comes EOD Thursday.


More low.

EOD Friday.


Ok. Well. I am right, that the market will tell you what it wants to tell you by the end of the week. Right?
But, to keep the integrity of how I do things, I kept to the plan. In my portfolio, I kept the EUR long this entire week. I needed to see the results.

Well, If you haven’t guessed by now, I changed their long trend to short now.
There’s 4 weeks in Feb, '20. That was the second week. But, let’s see what my actual trading results were for that week.


All results are under the shaded column, cause those are all my pairs that are in the portfolio that day. Not bad. I can’t believe it. I guess I need to remember, that I have a lot of other currency’s on the line also. Well, let’s move on.

I switch the EUR currency to trending low, now, going into the third week of that month.

Here’s the full weeks results. 5 days.


Yeah, it figures. Comes back on up. And this whole time I surely cannot change their stated trend to bull, right? Technically…no way. It’s all a down trend. Actually, ever since months ago. So therefore, going into the last week of that month, I have to keep with their trending low state. Have to.

This is the results of that week.


I still can’t believe it. Every day I was in the positive, except a slight negative on Monday (-80). I’m sorry, but this is all honest stuff. How can I be making pips, aggregately, when I’m so off on one particular currency’s trend?

shrug ---- But, I’ll take it.
And I’m starting to trust my system much more.

Let’s move onto the last week of Feb. I’m sorry, but I’m still determining that the EUR is on a down trend.

Here we go. One day at a time. Again.


Monday. EOD. Up it’s going.
Not good for the home team.


Tuesday EOD results.
Still moving up.
Sure, technically, it is still on a down trend. Cause all it has to do is turn back down.
Any day now.

Wednesday EOD results.


Well now, we’re talking we’re at the very end of the month. You should know by now that all trend plays should not be considered. It’s profit taking time.
Nothing I can do about it now. Got to see it through.

Thursday EOD results.


Talk about getting a hurting. Whoever is short the EUR is quite stupid by now.
Well, that’ll be me. It’s been straight up. Like…straight…up!

Friday EOD results.


And just when you think it absolutely cannot go any higher. It does.
Let’s see what kind of beating I took in the trades department.


Now that’s more like it. Losing on any of those days would only make sense to me. Tuesday was the only positive pip ending day (343 pips).
I’ll show you that break down of my Feb trades, again.

2021-05-22_13-21-25

But look. I don’t want to throw out my rule about keeping the trend for the entire week. Cause I can show you way more instances of where it kept me in the trend and avoided changing when I shouldn’t have. I’m telling you, it’s true. But in this instance, I’m thinking that there should be some kind of exception. Of some sort. Honestly. But I don’t know yet. But, this is as far as I’ve gotten (so I can’t show you what March has done yet). I’m gonna get it soon.

Or should I… change anything about this rule?
After all, I didn’t really lose much on the account.
I will continue doing the back testing accordingly. Cause remember, I do believe the market will show you precisely the direction in which it wants to take something, by the end of the week.

Well, all I know is that in the following month, March, things really flew. In the market. So, this will be very interesting on how it turns out.
Look Journal, you don’t have to worry about me, about being objective in stating what the trend is. That’s why I’ve chosen to stick with what’s technically true about a trend. Surely not what I think will happen. But what’s really happening. And come to think about it, I think I prove that very thing time and time again. Finding what the correct trend is.

And that’s what I’m about to do now.
I’ll prove it by going through, again, what the current trends are, on each of the currency’s. These can’t be argued. And if it can be, I’ll be debating that to myself, anyway.

Here’s where they all lie.

And I’ll show you why that is.
From the top.
The USD.


They’ve been trending low since April 1st.

The EUR.


Started to wobble a bit, a couple weeks ago. But nope. Back up on it.

The GBP.


Same thing here. But some real sideways action going on there. But in the last couple weeks, made it quite clear. Back to the very long high trend this year.

The CHF.


Is keeping with the upward bias, since that definitive move on upwards. Higher highs. No real swing lows. It’s taking awhile, but the bulls have the bias.

The JPY.


I don’t have to say a word about these guys. A five year old can tell me what the trend is.

The AUD.


Journal, you know that I’ve been telling you how this has the downward bias. Its started with that very large drop, just left of middle. And then I remember the next noticeable drop, around 56 - 57 day area. I felt it. And then I said to watch falling off the cliff. And sure enough it happened, at around the 92 - 93 day area. Well, to date, it’s continuing. The bears have the upper hand. We’ll have to see how long this will last.

The NZD.


Same with these guys. They just could not over take the 0 line, after the fall. Again, the bears are in control.

The CAD.


Well, it’s wavering a bit now. But, as it stands, it’s trending high. And that’s what we go with, whatever the market is saying right now.

Everything can’t be that easy, right?
We need some kind of challenge around here.
At least we have the CAD will keep us on our toes.

I don’t know how any trader can not want to know this stuff. I think it’s imperative to know what the sentiment of a currency is. Knowing, and seeing where the money is going is essential in our field. If we do not become experts on knowing what has already happened in the market, concerning any particular currency, then we are setting ourselves up for failure. There’s no excuse. Cause all we have is past data. Nothing else. And well, we are fortunate that there are trends taking place all the time. Cause if there were none, we’d all be in real trouble. Know what I mean?

Now. When these trends start to change (and they will eventually), then we got to be careful. We do things like ---- minimize our risk, by either trading smaller lot sizes, or even waiting things out on the sidelines. The market is not always this clear. Trust me.

And then when things really fly, like they did last March, we need to be prepared for that also. Volatility. How do we adjust for that?

Well, that brings me to the end. Cause I plan on running March 2020 back testing data. This definitely will show me what I can expect to see regarding my strategy.

You have to admit, I didn’t get hurt that bad during Feb’s results, even due to the EUR’s massive fake out.

So anyway. If I encounter some interesting stuff, I’ll surely show it to you. Maybe by tomorrow morning. We’ll see what happens.

Alright Journal, thanks for listening.
I’m on it.
Mike

2 Likes

Good morning Journal.

Ok. Here we go.
I’m not gonna talk.
(OK…maybe afterwards)

But, I got the results. My back testing data. From last year. I got caught up through April. Therefore, I can show you '20 up to April.


So. On the right side, going down, is what my strategy would have produced.
And I am very impressed.
Take a look at the month of Mar. Boy…if I was a professional trader…you know what I should have done? The first 3 weeks of the month go by. Trading the way I’m supposed to. Following the plan. Staying the course. And then see that after 3 weeks of turmoil, what would my results be, at that time?
+12,565 pips.
I would see that we are getting close to the end of the month. A little over a week left. Now. Wouldn’t you think I should just sit out till the end?
Sure. In hindsight, we see everything. And I really don’t know that, pretty much, for the rest of the month that it will be downhill from there. We just don’t know this.

On the one hand, we usually know that approaching the end of the month spells a mean reversion of what the trend has been. Right?

But look. I can’t be making strategy decisions based on what happened in one month, of history. It’s just interesting, that’s all. But I can remember this scenario, for the future. If we encounter an extremely volatile month again, and we’re getting close to the end of the month. And we are up like 3 times the amount of pips we’re supposed to be…well then…maybe we can consider sitting out for the rest of the month. And then to resume the plan at the onset of the next month. But…do you see all what would have to happen? So many things to be lined up. Very improbable. And that’s why we should just remember the scenario. Cause you never know. Right? And also this is why we run back testing. To see the possibilities, that have ever occurred. Cause you never know, right?

I wanted to make note also, of the left side data.
Those are the complete possible number of pips that can be had in a day. If you added up all of the 28 pairs and got every single one correct, that would be the result. Which is impossible. Like, far from possible. No one on this planet gets that. Or has ever gotten that. But, the reason for that number, is just to know what Mr. Market was willing to give out. It’s to know what the volatility was for that day. Some traders want to have an idea of what’s the average daily range for a specific pair, or even currency. Yeah, that data is out there. It is good to know. Well, this would fall in line with that also. What does the market normally output?

Well, I know (you actually think I don’t keep track of these things?).
This year so far. 2021.
2021-05-23_06-44-15

You got the averages for each day of the week. And then if you wanted to know per any day. A little over 1k.

Look. This is macro stuff. And that’s all what I’m about. Not only do I know what a complete currency is doing, I know what the market, as a whole, is doing. But to look back at that month of Mar '20. That was 3 times the average, for the entire month. A little over 20k per month is around average. So, it was something we haven’t seen in a while. Boy would I like to know when the last time that happened. Well, this is the reason why I’m continually adding onto & building up my very own historical database. Cause I want to know. Plus…I seriously doubt anybody else does this very thing. This is all proprietary. In fact, I believe everything I do is proprietary (I don’t follow anybody).

That’s nice.

Let’s see. What else can I show you?
Well, while I’m on this thread, I’ll just throw out there what this year has produced.

2021-05-23_07-02-36
2021-05-23_07-09-20

Now these results are awesome. I mean, in all of the 9 months of data collected (shown above), there hasn’t been one losing month. I find that very interesting. But I’m sure it’s out there alright. Sooner or later I’ll find it. Remember, I’m in the business of building up data bases.

In any case, at least this is telling me that the strategy should be profitable. Right? We’re talking minimum. And that’s all we want. Over time, I would like to see my account balance climb. And I’m talking about over a period of months and months. Alright, how about in the course of a year? Can I expect an account balance to increase?

I’m gonna have to say, so far so good, with this strat.

See Journal why I’m very excited?
Remember this?

Alright Journal.
I’m gonna get back to it. Cause this is probably the only thing I’m gonna be occupying myself with, moving forward. It’s building up of my data base. Or should I say to continue on with my back testing compiling. Same thing.

Thanks for listening.
Mike

3 Likes

Good morning Journal.
It’s the weekend! Yay!
Not only that, but it’s a 3 day weekend. I’m happy.
And not only that…but I only have 7 more working days till the summer break. Boy…me and the kids (the young ones on my bus) are counting down the days. I just can’t wait.
That’s nice.

Anyway. I just got done with one more month of back testing. I’ve been working on 2020 (last year). I’m caught up through Aug, now. And I’m continually getting surprised. Well, let’s see. Take a look for yourself.

2021-05-29_05-33-09
2021-05-29_05-33-50
2021-05-29_05-34-21

Left side going down is what the market produced, for a total amount of pips that can possibly be had, of all 28 pairs totaled. Right side going down is what my strategy produced. Daily totals. Weekly totals. And in blue, the monthly totals.

Sure I’m happy. I haven’t had a losing month yet. That goes for this year, to date, also. It just seems like I’m waiting for the other shoe to fall. Know what I mean? But…in the meantime…I’ll continue on with it.

Well, I do have to tell you what happened this past week.
I made a move.
I don’t know…I’m not totally upset. But we’ll just say that I’ve learned some things. Predominantly about my strategy.
I need to trust it more.
Let me explain.

This is how the month is rolling out, to begin with.
2021-05-29_05-58-53
What do we have? Well, we have a great month going, so far. Right? See on the right side? The weekly totals are adding up. And now we’re basically going into the last week of the month. And to be honest with you, you know what I’m thinking? That we absolutely must have some retracement to happen to the trend, before the month ends. I’m sorry, but this is floating around in my head.

So, we have a couple days go by.
Results are —
2021-05-29_06-03-12
Ok. So, a couple EOD’s come and go. Nothing I’m really concerned about. But see, this is why I keep track of that left side data. It shows me volatility. Look. Monday and Tuesday are showing what…very low numbers. Boy…no kidding Journal…I was like…something definitely is gonna fly on Wednesday. That’s how the market does it. It’s a winding up, for an unraveling. Which way is it gonna go…who knows?

Don’t forget, we’re at months end.

And I’m like, thinking, that if we have a counter trend move, it’s gonna probably be pretty bad. And that would spell the AUD, and the NZD to go high (cause they’ve been trending low lately). Well, I woke up on that Wed morning. And my first look at the market stunned me. I knew it was gonna happen. That’s it, I’m out.

This is a pic, from my phone, for EOD Tuesday (for comparison sake).
2021-05-29_06-23-18
I keep track of every EOD account balance (just for progress sake). But remember, I started out at 10k, on May 10th. So, I’m up pretty good for the month at this point. Then, my very next look at the account was this…
2021-05-29_06-23-46
Yeah, well, it didn’t take long for me to call it quits.
That’s when I unloaded everything.
2021-05-29_06-24-12

So this all went down about an hour after the London session got under way. I just kept thinking…“I need to protect the account. I’m not gonna let all that hard work go out the door. Let’s keep a good month, a good month.” I figured the rest of the day is gonna go that way. And usually it does.

Anyway. I am happy.
Let’s see how the day ended up.

2021-05-29_05-54-11
Left column is the list of pairs, with their results (middle), in order from largest to smallest. And the order of them is important, cause whoever is first is the currency that had the increase (likewise, whoever is placed second is the losing currency).

My trading results are on the third column (right most one). Well, that’s not totally accurate, cause I jumped mid day, remember? I did find out the difference of pips from when I jumped. I did 99 pips better than that result (-699).

In any case, you should be able to see how the NZD really had their way these last 3 days. But not really with the AUD though. And how about the volatility? Basically it doubled those last 2 days on that day (1340).

Ok. That’s the market for ya. Right? It happens. Usually it’ll be either Wed or Tues for the turn around. But all I know is that I’m out. My account is safe. And all I have in mind is that I’m gonna stay out till the month is over. Look. Being up 11.54% is awesome. I’m not complaining at all.

Let’s take a look at how the rest of the week went. Shall we?


Hmm.
What do you see…
Well, the market produced even more volatility than the day before. It goes from 1340 to 1386 (more pips available). And then my strategy goes ahead and produces a lot. Basically it makes up for what happened in the day before, and then some! 867 pips. And even Friday goes the same way as the trend also. Yep. Tack on even more why don’t ya.

So.
What do you think I’m thinking right about now?

Well, all I can do is shake my head.

What ever happened to end of month flows, counter trending? Right?

Not this month. Apparently.
It went back with the trend.
Oh well.

At least my account is safe.

2021-05-29_05-55-22

Ok. So. What’s my lessons here?
Well, it’s another example of why I can trust my system, right?

Look. I can show you examples of it going the other way (the way I thought it would). Look up above. In the back testing of last year. Look at Mar 2020. That last week fell apart. Actually, this is what was going through my mind. Maybe a repeat of that. But nope. Man…even the Feb prior to that. Same thing.

Oh well. I’ll just chalk it up as a system I can trust. That’s all.
And maybe I should just stick with it, like, no mater what.
Well, at least I didn’t fall trap to the FOMO mistake. I’d rather err on this side of it. It’s better to have a safe account, secured, and in fine shape. Than getting whipped up by the market. It could have happened.

I have a good system (strategy). And what it’s telling me is that the market does trend more than counter trend. Cause all I’m doing is following the trend. But I do believe I’ve found the most accurate depiction of what each currency’s trend is. Sure, everything in the market is subjective, but you can’t argue with the numbers. It’s all in how their arranged.

Well, let’s go through 'em, then.
We need to look at the NZD first. Let’s see the progression they had this week. I’ll show you how you can get fooled, real easy.

The NZD. How they look coming into the week.


Yeah. Downtrend.

Then EOD Monday. Results.


Comes back up. Retracement. No biggie. Normal. It’s still within the trend.

Tuesday EOD. Results.


Still within the trend confines.

Wednesday EOD. Results.


This is that big day. Now how’s it look?
Still within the confines of trending?
Changing trends?

Well, I’m gonna do exactly what I do when I back test. I have a rule.
I will not change the stated trend until the week ends. The reason is that I play the week. I absolutely need to see how the week turns out. So…whether it technically changes or not, it doesn’t matter. I will be short the NZD at least till the end of the week. But, I do have in mind a place where the trend would change it’s state. The resistance level, I’m thinking, would be at that latest swing high at around day 95. And we’re pretty much there now. Let’s see how it plays out though.

Thursday EOD. Results.


As it stands, I’m thinking they still might have a chance to change the trend. Possibly. But again. I need to see the week through.

Friday EOD. Results.


And now it’s clear.
This tells me that I will, absolutely not, change it’s stated trend.
Look. It came back down under that resistance level I deem important. I mean, you can even probably go as far as to say that the resistance level could go up as far as the 0 area (where it previously toggled a whole lot). And still be technically trending low. Right? But I don’t have to worry about that now. I believe if they wanted to change trends, this would have been their opportunity. But no. The bears had their way. Not the bulls. It’s not time. Yet, anyway.

See how you can get fooled? All that rising up during the first 3 days of the week, I’m sure, got the bulls pretty excited. In fact, it’s because they had a hawkish interest rate decision day at the beginning of that Wed. The market seen it coming. The lead up, to it, showed. Right? But the fall out afterwards didn’t follow through. The market is not convinced of a change in trend yet. That’s all.

Well, while we’re at it, let’s see how the AUD is doing. I’m just gonna show you the latest.


Remember the cliff?
I do.
It’s still falling off of it.
The downtrend continues.
And see? If you had their bias ever since way back there, at that precipitous fall, you would have had better luck trading the AUD short, than long, in any time frame, since.

Since we’re at it. You know what I find interesting? A lot of analysts are commenting on how the commodity market is flying sky high. Oil. Copper. Lumber. Trust me, many others. Their even talking we could be coming into a commodity super cycle. That’s simply an era of extremely overvalued prices. But how come the AUD and the NZD’s have not demonstrated an equal or similar trend? Their down. Not up.

I don’t know. In the past, I’ve always known that them two always showed very similar dynamics as the commodity market did. Right? You can’t really say that now, regarding them. Sure. China is a factor. But I’m not sure if they are what’s causing the depressed state of these guys. Maybe they are in some way, I just don’t know.

I think the world is much more complicated nowadays.

Isn’t it good that we don’t necessarily need to know why?
As long as we can see what the trend is, it should be enough.

Let’s move on. Sticking with the commodities…
How about the CAD?


Yeah, they get a bit tricky. I thought they would be joining the other 2, but look at what happened in the last 2 days of the week. They came back up to the support level. Now, if they fall somewhere below the 2,000 level gridline, then yeah, I’ll be calling them trending low. But no. The market’s bias for them is up, not down.

The USD.


Still trending low. Sure, not falling further anymore (lower lows), but as long as they are not making higher highs then I stick with the prevailing trend, which is down. Taking a breather now, that’s all.

The EUR.


Trend is up. Nice and long. Too easy.

The GBP.


The trend is up, after that consolidation period.
This year has been absolutely been awesome for the GBP. This is not rocket science.

The CHF.


Technically up. Inching it’s way ever so slowly. Smoothly. Not rustling any feathers. Shhhhhh. Don’t tell the SNB!

The JPY.


Anyone getting tired of making money off of these guys?
Well, that should be the case.
Too easy.

Alright Journal.
Gonna cut this.
I’ll be back this weekend. Got tons of stuff to go over.
Thanks for listening.
Mike

Good morning Journal.

Oh boy. This isn’t gonna be easy.
This was something I said the other day…

Well, the other shoe did drop.
Concerning my strategy.
I made a mistake. On the back testing.
On one hand, sure, I’m happy. Cause there ain’t nothing I want more than truth. At all costs. But, on the other hand, I cannot accept errors, in my numbers. I mean, I do not tolerate mistakes. That’s why this has taken me a day to get over it (kind of…and still working on it).

This is probably something you don’t know about me, Journal. I run a lot of numbers. Daily numbers. Back testing numbers. Data base building. Analysis. Etc. And when I do these, I know how easily it can be to make a mistake. Just one number can make a huge difference. The point is, for myself, I don’t want errors. Journal, I just cannot express to you the height and depth of exactly how much this means to me. I mean, that’s why I have things in place, as I execute, to mitigate making errors. Even double and triple checking is very common with me. And whether they’re simple typing errors, adding errors, omitting errors, or whatever. Simple mistakes just shouldn’t be. There’s no excuse. I don’t care.

Man…this reminds me of something that happened a couple years ago. When I got my taxes done. The woman from H & R block was doing this for me, as I’m sitting there at her desk. And that’s all it is, just numbers (something that I can relate to). So, I was watching her as she was transferring the numbers from my W-2 into her computer. And then there came a point when I said, “don’t you think you should check your work?” And of course she agreed. So she stopped at that point and went back to check them. Sure enough, and it didn’t take long either, when she found a mistake. Needless to say, I didn’t join in with her laughed-it-off response.

Anyway.
I made a mistake.
But look, it wasn’t one of those simple, inexcusable kind. It was one of those there’s a lot going on here with excel, which requires much detail paying attention to. Still. I was upset. And at the same time I was quite happy cause all I want is the truth. You know? No matter what. Well, I found this mistake when I was on the month of September ('20). And you know what that means…I got to redo that entire year. And then this year also!

And so, while I was correcting it all, man, was I being humbled. My strategy was turning out to be nothing so special. Was going through a lot of emotions. Angry. Disappointed. Deep sadness. And then, you know, I got to bring it to light in here, for you (and all) to see. Am very embarrassed, doing this now.

Well, I guess that’s where I belong. Down low. I don’t know…maybe no one is paying attention anyway (I’ll never know). But you know what…I’ll just pretend that this is between me and only me. Well, in that case, I can get over it. It just makes me dig a little deeper, that’s all. But I know one thing, I, absolutely, cannot let false numbers go by. And that’s precisely why I have to come on in here and correct it. I’m gonna set the record straight.

Here’s last year, up to Sep.
2021-05-31_10-05-06
2021-05-31_10-05-35
2021-05-31_10-06-06
2021-05-31_10-06-40

Let’s just pay attention to the right side numbers. That’s what my strategy produces.
So, I got some average results, per each day. Also one complete daily average.

That +35 daily pip average tells me that I have a positive daily expectancy. Over the long run. Also it’s better than random, which is 0. I would consider that an edge.

And then if you would add up every day, that total comes out to be 6,815 pips on the year. Not as good as I originally thought, but I have to accept it.

Oh, and yes, I will have losing months.

Ok. So. Here’s this year.

2021-05-31_10-07-17
2021-05-31_10-07-59

Well now, this makes all kind of sense. I knew April was a bad month.

This makes me want to dig deeper into finding out exactly why I would have good and bad months. The things I would be looking at is this:

  • How accurate are my stated trends?
  • How much does the market deviate from the trend?

See. One of those things I have some control over. And one thing I absolutely cannot have any control over. Well, that’s in regards to having a trend following strategy. But I think it would be beneficial to know this.

That does remind me of some numbers that I do follow. In fact, I don’t think I ever showed this to you. Well, now is the time for it. Check this out.


The question is, “Why the bad month of April?”
All of the answers are up there (yeah, even the CHF who absolutely crushed me in the first couple weeks).
In the top table, that is what the market produced. Daily results.
Then, in the bottom table, I have which trending state each currency demonstrates. The days being matched up.
And in the middle of those 2 tables, are the results of whether the market trended (green) or counter trended (red). Now, how do I come up with that particular #?
Let’s do April 1st together.

  • USD = stated trend high (green) but resulted that day being -1.82%. Since that doesn’t match we have -1.82%. Put that on the calculator.
  • EUR = stated trend high (green) & resulted as 1.90%. That matches. Therefore we add on the calculator 1.90%.
  • GBP = stated trend high (green) & resulted as 1.47%. That matches. Therefore we add on the calculator 1.47%.
  • CHF = stated trend low (red) & resulted as 0.24%. That don’t match. Therefore we - .24% to the calculator.
  • JPY = stated trend low (red) & resulted as -1.64%. That matches. Therefore we +1.64% to the calculator.
  • AUD = stated trend low (red) & resulted as 0.27%. That don’t match. Therefore we -.27% to the calculator.
  • NZD = stated trend low (red) & resulted as 2.91%. That don’t match. Therefore we -2.91% to the calculator.
  • CAD = stated trend high (green) & resulted as -.91%. That don’t match. Therefore we -.91% to the calculator.

— We only had one positive week, the third week.
— Of the 22 total trading days, 9 were trending and 13 were counter trending.
— A grand total of -32.90%.

Well, let’s compare this to this month of May (which is a very good one).


— That’s 4 positive weeks
— Of the 20 trading days, 15 were trending and 5 were counter trending.
— A grand total of +74.93%.

Now. Do you see what I’m talking about?
Big difference huh?

Can I do anything about this?
I don’t know.

Let’s remember…We’re looking at the aggregate currencies here. Right?
Well, my trading consists of these pairs coupled up against one another. Only the trending high against the trending low.

And you seen my results earlier.
But here it is again.
2021-05-31_12-13-44

Yeah, that’s nice. I know.

Well, looks like I better think about when I’m gonna get back in the market. Cause remember, I’m out still (remember that mistake?).

— Start fresh for the month of June?
— Wait for the week to unravel, then slide right in?
— Wait until after NFP Friday, for direction?
— Are we gonna have any trend changes around the turn of the month?

I don’t know, those are some of the things I’m thinking about.
I did start this whole exact strategy back on the 10th of May. So, maybe in hindsight this was a good thing. But look at what I missed. Up there at that table. 668 pips were gained in that first week. Hmmm…that’s not all that much.

Yeah…when I think about it, I’m not gonna be in such a rush. I got to see how this week unravels. I mean, I need something to see first. Cause we’ve been in an unchanging sentiment lately. I proved it for you all right there. The currency’s haven’t really changed their trajectory. The market went with the trend. And I’m just wondering if there will be changes coming soon. And if there are, then you know what that spells, right?

Bad news.
Minus pips.

I’ll let you know what I end up doing Journal.

Thanks for listening.
Mike

1 Like

Hi Mike,

There may be more peeps paying attention than you think. It takes a lot of guts to admit mistakes. I use Excel extensively, and in many cases it is for building investment cases for IT change in my day job. That could be a few thousand or a few million of savings, so like you I am paranoid about building mistakes into formulae. I have two ways of checking for mistakes. The first is that if there are two ways of adding rows or columns, I use both and end up with the answer twice. This ensures that all formulae that make up the intermediate calculations are without error. The other way is something I learnt from a Texan I was working with in the Southern North Sea about two decades ago. He called it a SWAG estimate. And I use it often. It stands for a “Sophisticated Wild A** Guess”, and I have failed fast often by applying this. If your SWAG shows you are going to make a million dollars in three months, it is extremely unlikely to be based on the right arithmetic. Best of luck with your continuing search for the truth.

As a way of encouragement to continue your pursuit, did you feel like Sheldon at 1 minute 20 seconds in this short clip?
Sheldon Meets Stephen Hawking - The Big Bang Theory

1 Like