Good morning Journal.
Let’s see. Where are we gonna go today?
How about we take a look at what’s going on in the market. Cause I’m still not in yet.
But after seeing yesterday’s numbers, I have an idea of what I’m gonna do. So, let me unravel all this and show you what I’m thinking.
Well, we have to start from what’s been happening already. The trends have not changed for quite some time now. Like, over a month now. Let me prove this to you.

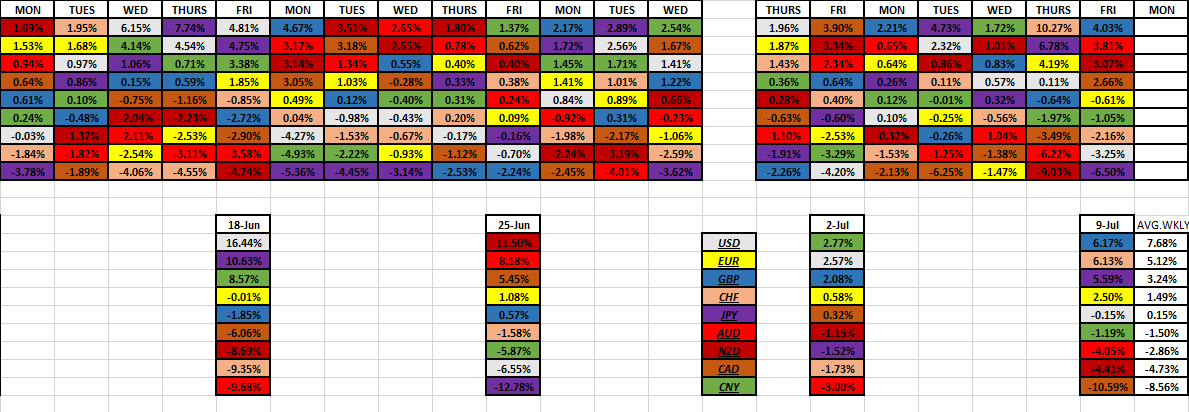
If this is true, then the monthly running % changes should just about be the same, right? If no trends have been changing then we should be able to look back at this month and should be seeing these 2 tables look pretty much alike. Let’s take a look.

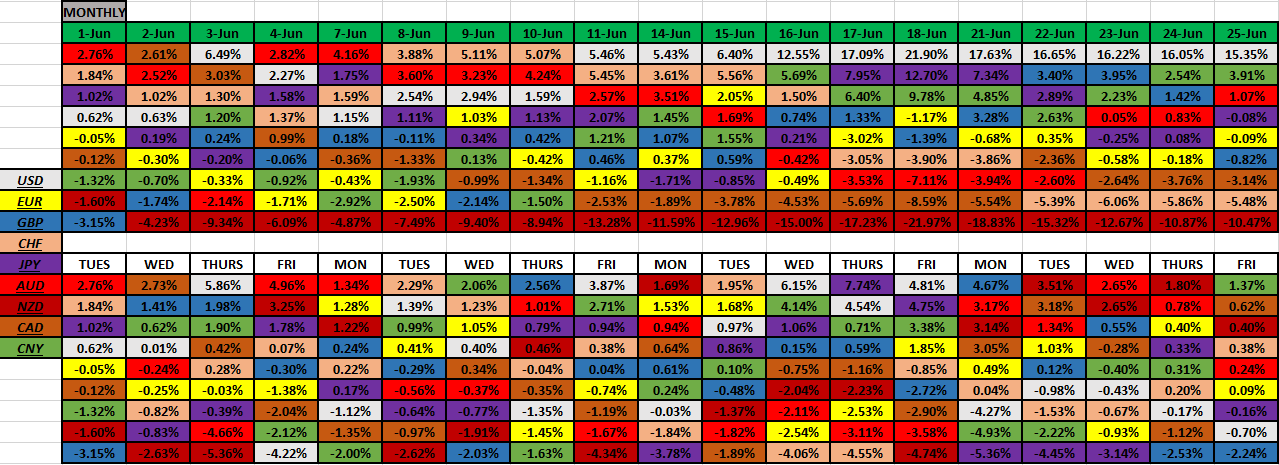
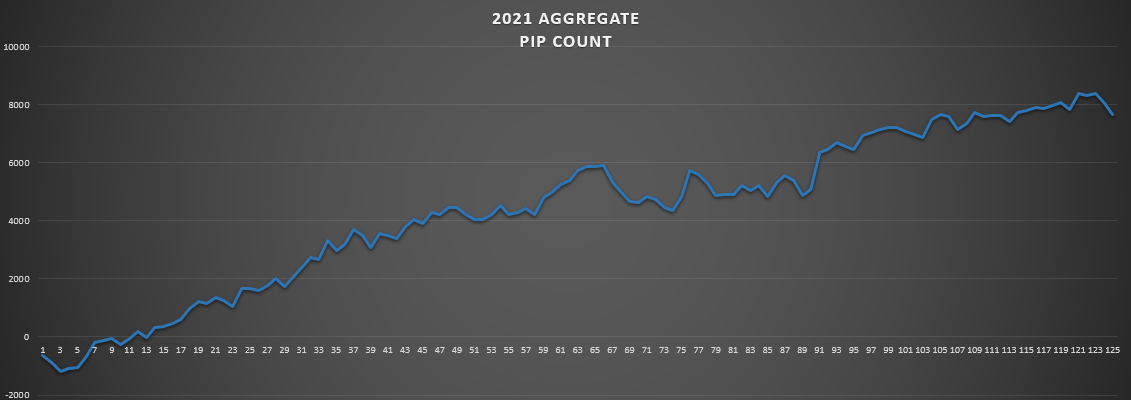
Remember, this is how the month progressed if you simply added each of their daily total % to the previous day. Aggregately speaking, of course. And so, what can we see by this? Well, it was the GBP that was the most bought currency for that month (+17.37%). And sure enough, just above, you can see that the GBP’s stated trend was trending high, the whole time. And then, we have the EUR. They were the next most bought currency that month (+12.69%), and also matched with their stated trend being trending high.
Next, is the CAD. You can’t see it, but May 3rd was the first time they started their trending high state (the last two weeks of April they were in a bear market, trending low). And so, it does match, their trend. They were more bought than sold. Also, they were bought more than the 5 other currencies below them. So…it matches.
Ok. So. The USD, and the JPY are a no brainer. Trending low states. They matched up. Then let’s look at the AUD. They ended up in negative territory (-6.33%) for the month. Since May 12th, technically, they ran a negative running %. The bias is down and it did match. And the NZD showed something a little similar. But more mixed than anything. Now with these 2, you should be able to see that at the beginning of the month they were wanting, and showing, some strength, comparatively. Remember, NFP Friday was on the 7th. Since then, it was all down hill from there. They both demonstrated a trending low state. Matched. And the CHF was pretty much in the middle, with more of a bias on the up side. Therefore they match their trend state (high).
I think I made the point. Right? No real trend changes. And well, that should spell some profits, as long as you traded along with the trend, that is. It was a good month.
But, another point that I always make is, that trend changes like, very much, to occur around the turn of a month. I’ve said it many, many times. How do I know this? Cause this is what I do best…keep track of the market. A lot of times it coincides with the end of the month profit taking. And all the way up through NFP Friday. So, we’ll just call it around a week prior to a week afterwards. But look up there, with the Comm brothers, in May. You can’t tell me the market was thinking about the idea of them taking over the buying. But it quickly fell apart.
Ok. That’s nice.
How about this month? Are we seeing any kind of trend changing occurring?
And this has been what I’ve been watching for, and waiting for, before I jump in with my trading. Let’s look at how it unraveled…all the way up through NFP time.

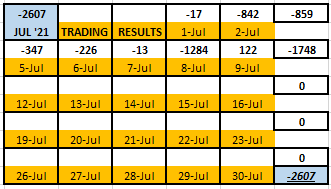
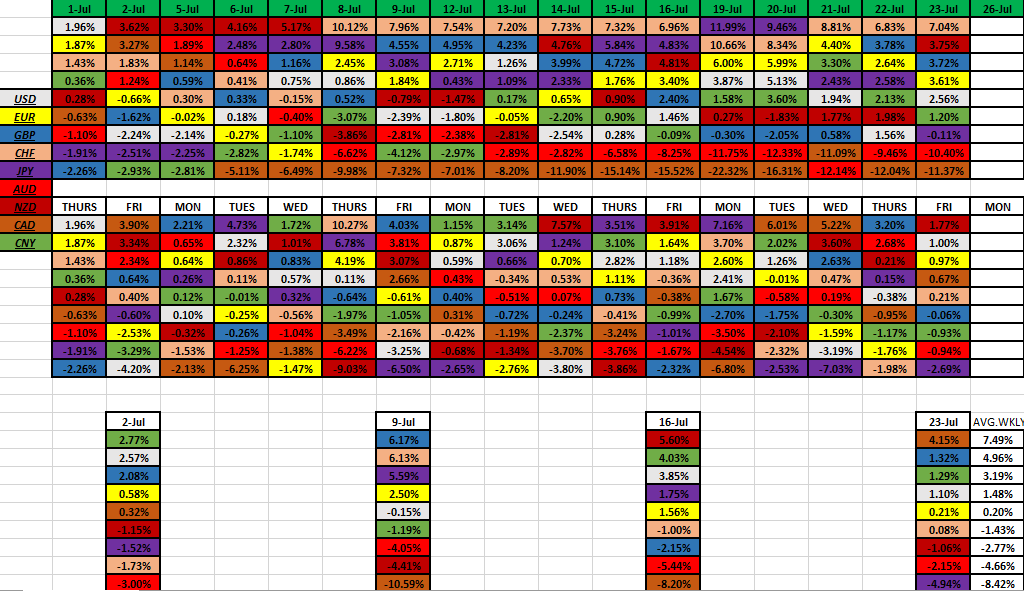
The top table is the month running. The bottom table is each days results, all by themselves. It’s the daily picture of what happened.
Well, Monday was the last day of the month. It was a holiday. And not a lot of movement occurred. Then comes Tuesday. Back to work. And how does things fly? Well, looks like the AUD has been bidding up. Actually, Mon and Tues. Comparatively speaking, they were (the bottom table will show you that). That’s the only mentionable thing I’m seeing so far. Again, the movements aren’t really going anywhere. The average for the most bought currency, for a day, will be between 3.7% - 4%. We’re nowhere near that.
Moving on.

Well, sticking with the AUD, what happened with them? They took a breather. That makes all kind of sense. And still, low volatility occurring. The CAD took the top spot. And the NZD took the bottom spot. Well, speaking of the NZD, they definitely were being sold off, more than anyone else these last 2 days. And then the GBP took a U-turn from a good sell off to some buying.
Remember, the market is getting ready for NFP Friday. Are we seeing any kind of lead up to it? Well, so far, I don’t think so. What’s the USD doing? Not much. Let’s see what Thursday brings us.

Oh yeah. Now we got some action (volatility). And who we talking about?
The USD. Look there, coming in with +5.86% that day. Yeah boy, that’s over and above the average top spot for a day. Well, we should know that NFP is centered around the USD. The market is calling for a good report. So. One one hand, it seems like the market is getting ready for some Dollar buying. That’s what the market does. It’s a forward thinking machine that gets priced in beforehand. Right?
On the other hand…it is true that market does this thing called buy the rumor, sell the news. Basically, the money is being made on the way up to the news. But then when it comes out, even if goes the way it’s supposed to, the market takes the profit, which means there will be a lot of selling. So…this is some of the stuff that I’m thinking beforehand. But, we have the USD going up. But also the AUD, and the NZD are being sold off. Really. That’s the only other thing mentionable.
Honestly, I really didn’t know what to think heading into NFP time. The closest thing I could make of it was more of a risk-off sentiment. The JPY and the CHF aren’t showing any kind of clues. And no one else is, either. So then, we just have see what happens. Trust me, I’m not gonna risk my money. It’s a crap shoot at this point.
Well, I still believe the most important piece of data comes down to what the EOD price is. But, I want to get a sense of what’s happening during this NFP time.
And so, the number came in. The data showed below analysts forecast. But not all too bad. Like, 650k predicted, and 599k it came in at (something like that). I mean, I don’t know, nothing real earth shattering. How’d the market react?
I had 2 minutes to view it, at that time. Basically, the market didn’t really move all that much. But the real picture comes later on afterwards. So, on my mid day break, I checked in with the market. And this is what I captured.
4 hours later.

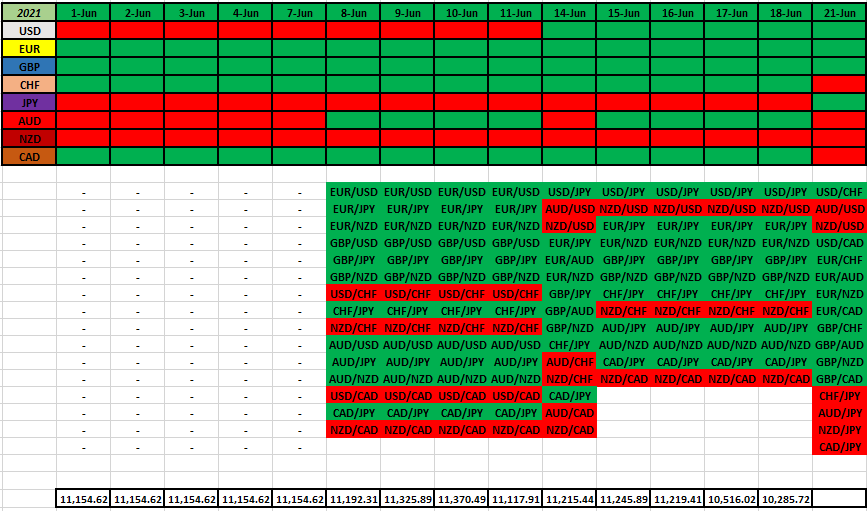
The USD was sitting at -3.96% down on the day. Total amount of pips was -384.
The EUR was sitting at -1.34% down on the day. Total amount of pips was -205.
The GBP, and CHF about break even.
The AUD up a lot. +4.61% on the day. With a total of +499 pips.
The NZD up a good bit. +1.75% on the day. Total of +187 pips.
The CAD down. -2.38% on the day. Sitting on -236 pips. They followed the USD.
The JPY was being bought, +1.96% on the day. +240 pips.
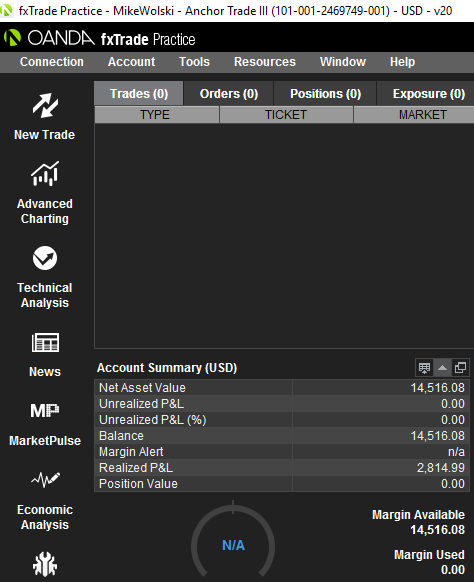
And if you want to know, those totals numbers on the top right, would be if I were still trading my portfolio. I would be down -542 pips, in my basket. And don’t forget, that tells you how the market trend is faring. The market is not going with the trend today. Right?
Well, what am I gonna do? I mean, I can’t do anything until around EOD anyway. I just wanted to get a feel about any trend changes that might be coming.
Seeing any?
The Comm brothers might be. That might be the only thing I think could be possible. Anyway. I took one more pic just before I had to go. Any changes to what we’re seeing?

Can’t really tell. You know how the market traverses back and forth.
Well, how about the very EOD pic. I took this just before I ran the numbers.
4 hours later.

Nope. All the same. This is where they end up.
Let’s put this in the proper perspective.
Daily.

Well, remember me saying about the buying the rumor, selling the news?
I’m thinking this is what happened. It’s a complete 180 from the day before.
I thought long and hard about this. I’ll tell you what I’m gonna do.
This is concerning my trading. And how I properly navigate my chart reading.
I’ll go down the list. From no changes, to changes.
The EUR.

They are trending high. There’s nothing to tell me a change from this. Therefore, their stated trend will not change.
The GBP.

Same thing here. Trending high. Bias still holds for being bought, than anything else.
The CHF.

Trending high. They are not dropping. The bias is to the upside. And nothing tells me otherwise. So no changes here.
The JPY.

Well, they leveled out. Not dropping. But…we’ve seen this before. Right? Therefore, until we see something major, for a turn upside, their trending status is LOW. And that’s the way it has to be.
Now we’re gonna get into the trickier ones. I’ll have to show the USD now.
I have a secret weapon I’m gonna have to administer.

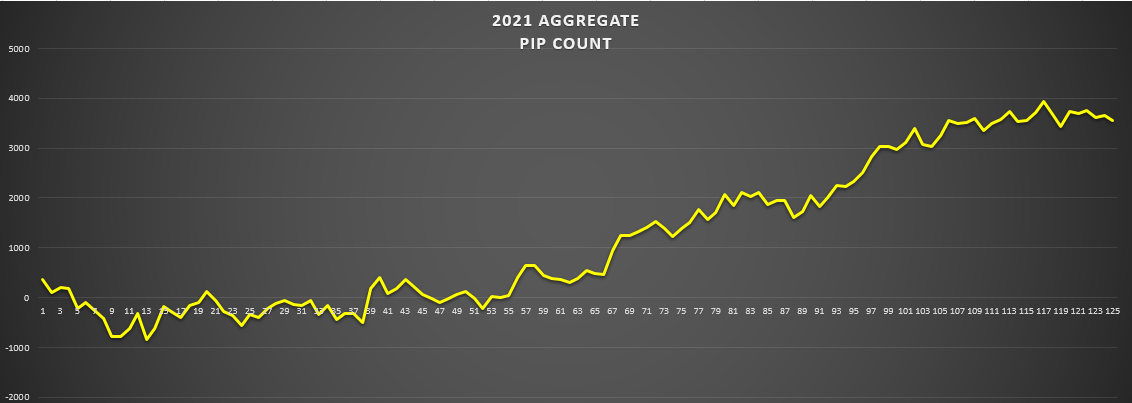
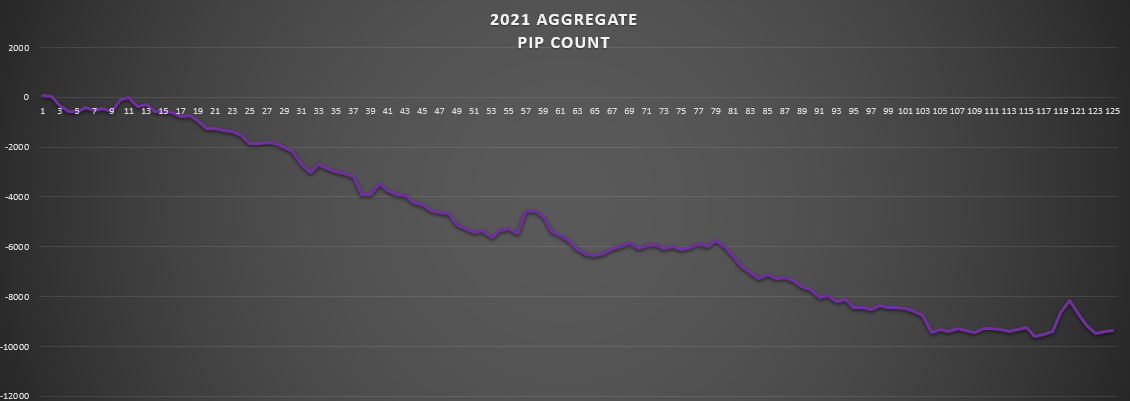
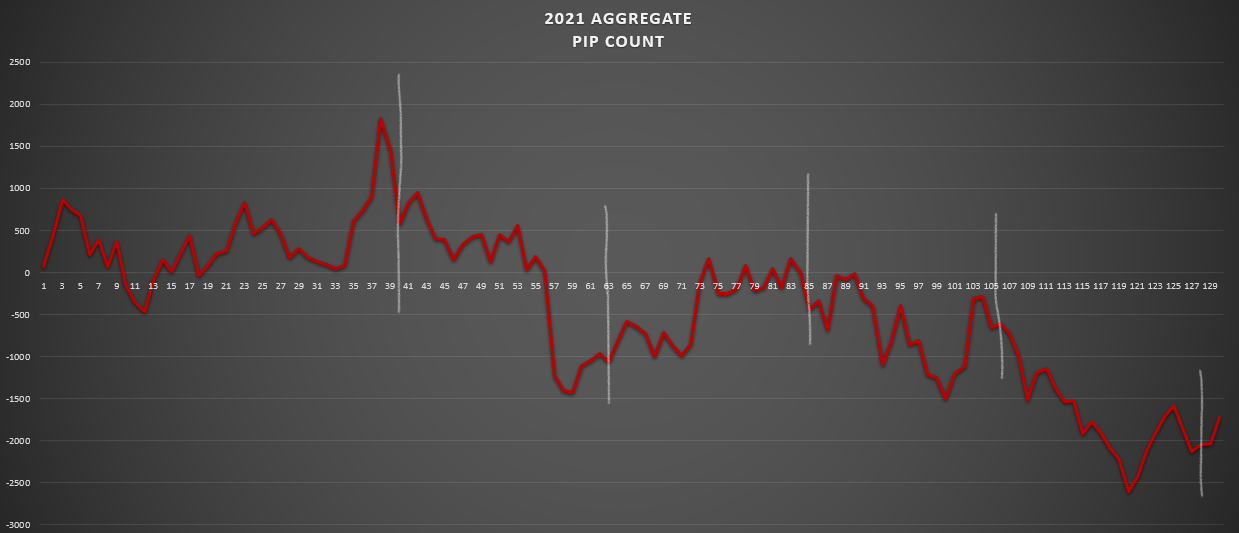
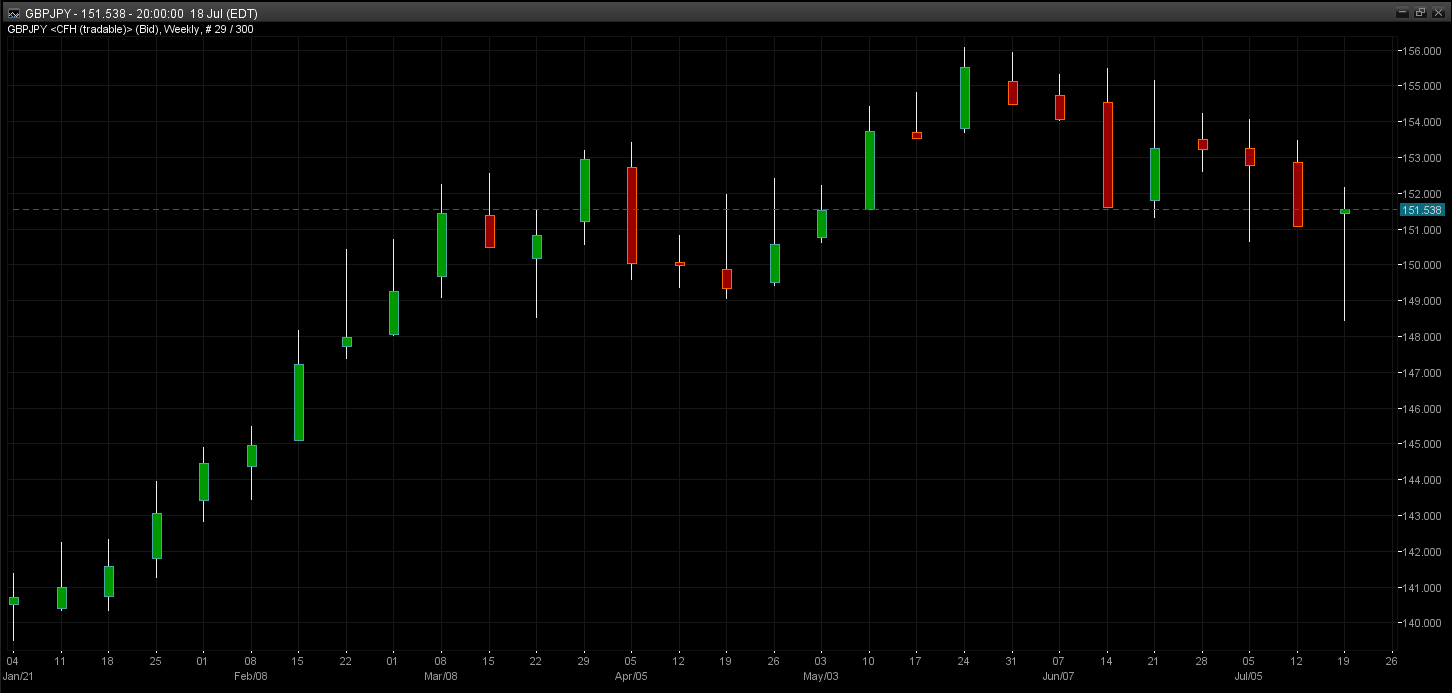
Look. As this week was unraveling I kept thinking (especially after Thurs run up)…this USD is trying to make a trend change, for higher. Just look at the last couple weeks. It carved out a floor. No more lower action. Even winding up (a shaking out of the sellers) time. Then comes Thursday. Broke up out of that higher. I thought for sure that NFP was gonna continue on up. But no. Continuing on with the trend.
But concerning my trading. And chart reading. This is my secret weapon. I’ve used this extensively with my back testing. It works.
Look at that -1000 gridline. I believe that is a resistance line. It got broken. And now has come on back down to it. It’s called a break & retest thing. Surely, for a trend change, this is possible. It would make sense. I mean, even look up above. This hasn’t happened this year yet. I’m talking about a consolidation, wind up, and then a trend change. And so, getting back to my secret weapon.
One more day will tell me.
This happens, more than not. And it’s saved me many times in the past. I believe in it. It’s the principle. I have to wait this out for one more day. And one more day only. I believe the market will tell me, at EOD Mon results, which way this wants to go. If it’s a continuation of the down trend, than it’ll move lower. Under that resistance line. And on the other hand, if the market wants to change trends, it’ll shoot up from there. Get it?
I will not be making a determination until EOD Monday. Therefore, until then, it’s still considered trending low. But…concerning my trading…I’m not gonna get into the market until EOD Monday. And then when that time comes, I will be, getting in.
There you have it.
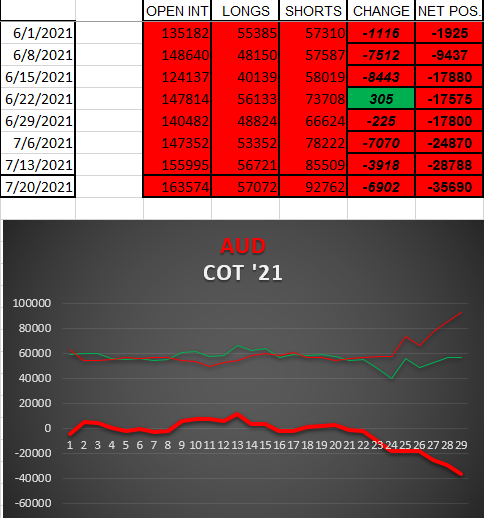
And while I’m here, this will also go for the AUD, and even the NZD.
Take a look.
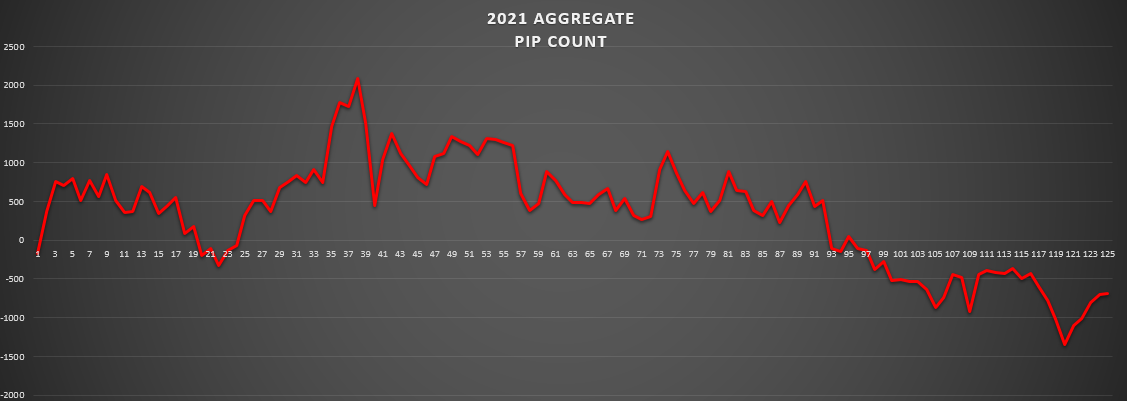
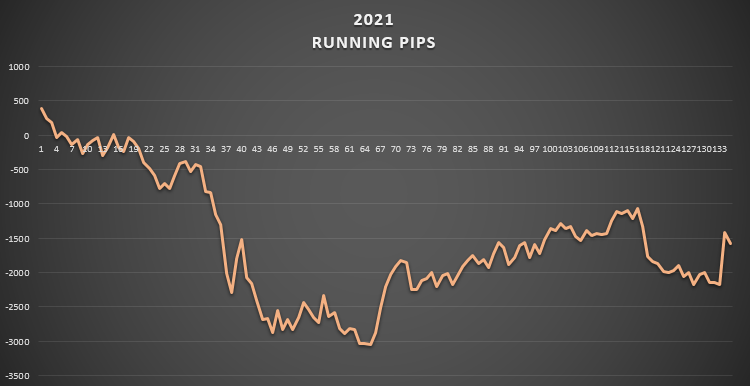
The AUD.

Same thing here. We have a resistance line at the -500 gridline area. Therefore, I believe if the market wants these guys to continue on down with the prevailing trend, then it’ll drop from here. If the market wants a change in trend, then up it’ll go.
This is what I believe. And I’m going with it.
If I’m wrong, then I will learn something from it. That’s all.
But moving forward from here, that’s how I will place my trades. According to what happens at EOD Monday. And then, I will have to keep this determination for them for the entire week. I cannot go back and forth. This is my rules. So, whatever happens at that EOD is what I will state for the rest of the week. I got to draw the line somewhere.
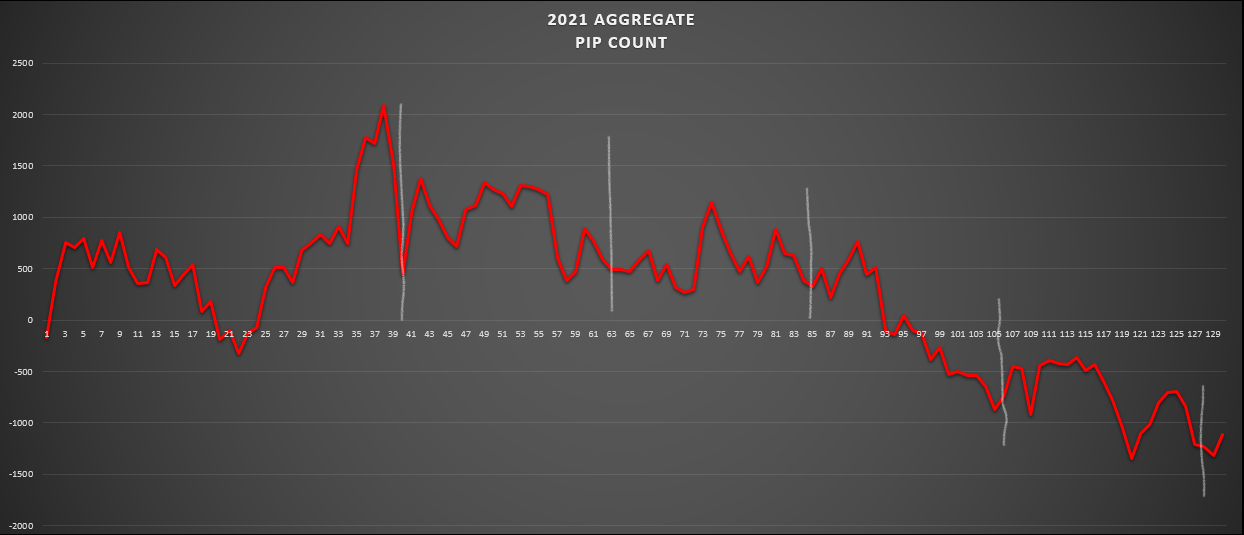
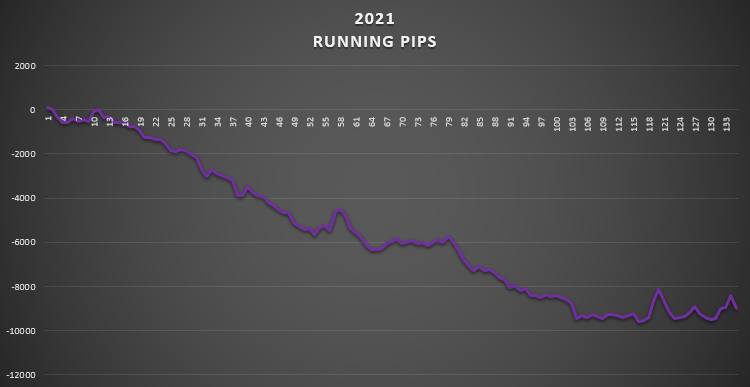
Here’s the NZD.

Boy, they like to make big moves. But as it stands, their trending low. And it’ll take quite a bit for them to change this trend. I would say it would have to go up and above that last swing high, for a trend change. That’s all.
And then the CAD.

Trending high. Nothing is telling me of anything different. Sure, you could call it sideways action, or even a ranging condition, but for me, it’s more of an upward bias than a downward bias. I’m not playing the middle ground. That’s nonsense. Things go either up or down.
Ok now.
Remember me saying this last week?
Well, I think I went through this whole process quite nicely. I correctly waited it out.
And because of this weeks data, I need one more day.
My money will go on the line, for the start of Tuesday. And I will be riding it out till at least the end of the week, without fail.
It’s my strategy. And I believe in it.
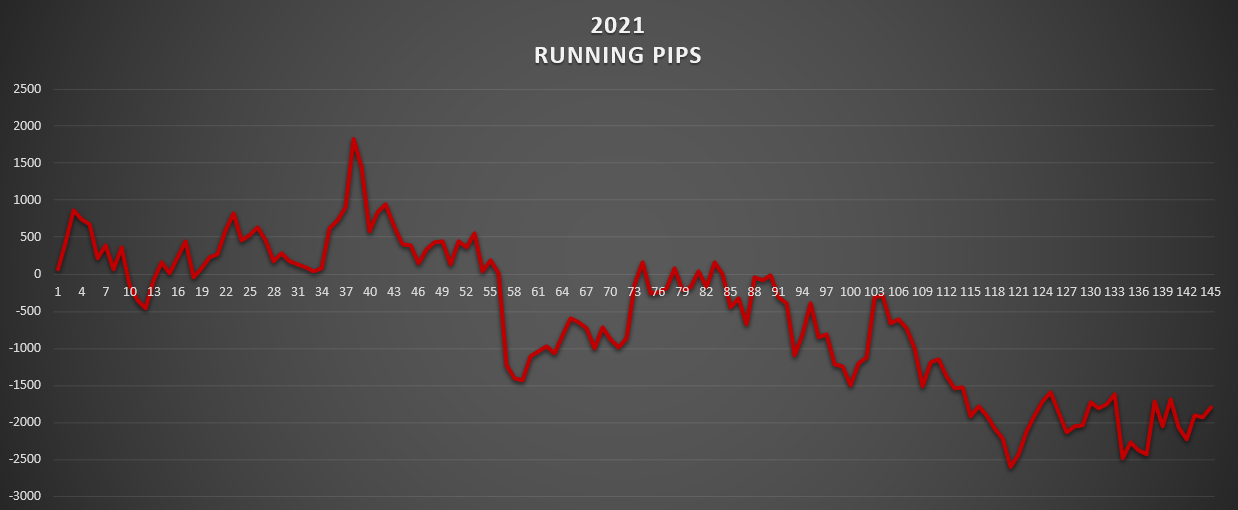
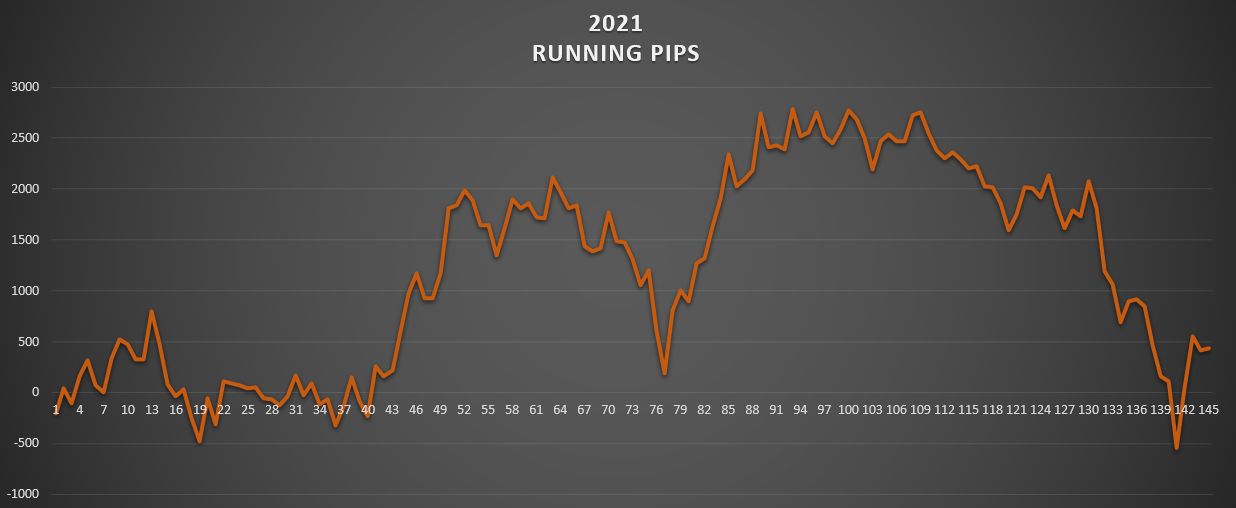
But what would have happened if I would have simply followed the strategy all along?
Here’s the results of that.
Well, if you count Monday through Friday, sure, I would’ve been positive.
I don’t know. By being out, I didn’t really miss out on a whole lot. Right?
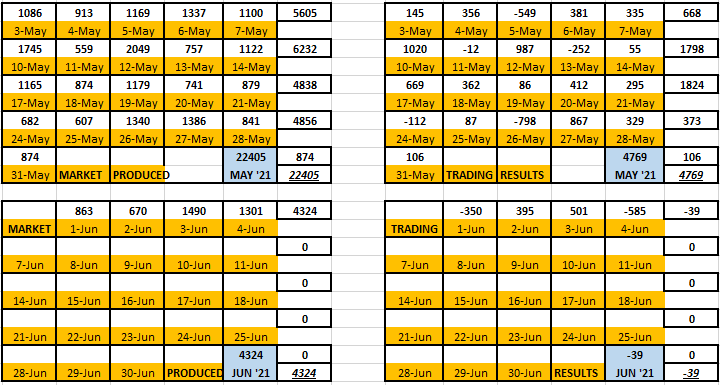
And I got to show you my latest data table. I absolutely love these numbers. Whether you want to see my trading results or not, it doesn’t matter. This is how the market sized up every pair.

How every pair turns out for the day is there in the first and second columns. And whichever currency is first is the one getting the profit (positive). My trading results are on the right column (if I was in the market). And I hope you can see how this way is absolutely the best way to go about finding back testing results. Right? And currently there are 16 pairs in my portfolio basket. 4 trending high against 4 trending low. 4 x 4 = 16. That’s why only 16 are being counted on the right column.
And look at that volatility tell. Left table, up above. See how the market works? It just drops and drops. Until that Thursday. Then bam! Off the market it runs. Boy…that was even more than what happened on NFP Friday. And if I might say…I have a feeling about Monday. I think the volatility will be high. Geeez. Look back at last months volatility. The Monday after NFP (May 10th). Yep. That’s a lot. 1745 pips the market had possible, at days end. So…we’ll see what happens.
Alright Journal, that’s what I got going on.
I’ll try to come in here tomorrow am. I always have stuff to talk about.
And again, thanks for listening, Journal.
Mike