EURUSD set a new higher high higher close on a daily time frame again.
The price has successfully violated the 1.091 - 1.093 horizontal resistance.
Now the price retraced.
I will expect the next bullish wave from a confluence zone based on the underlined horizontal structure
and a major rising trend line.
My Goals: 1.103 / 1.11
GBPUSD was consolidating on a key level within a horizontal trading range for some time.
Yesterday, its support was finally broken with a high momentum bearish candle.
I expect a further bearish continuation.
Goals: 1.213 / 1.202
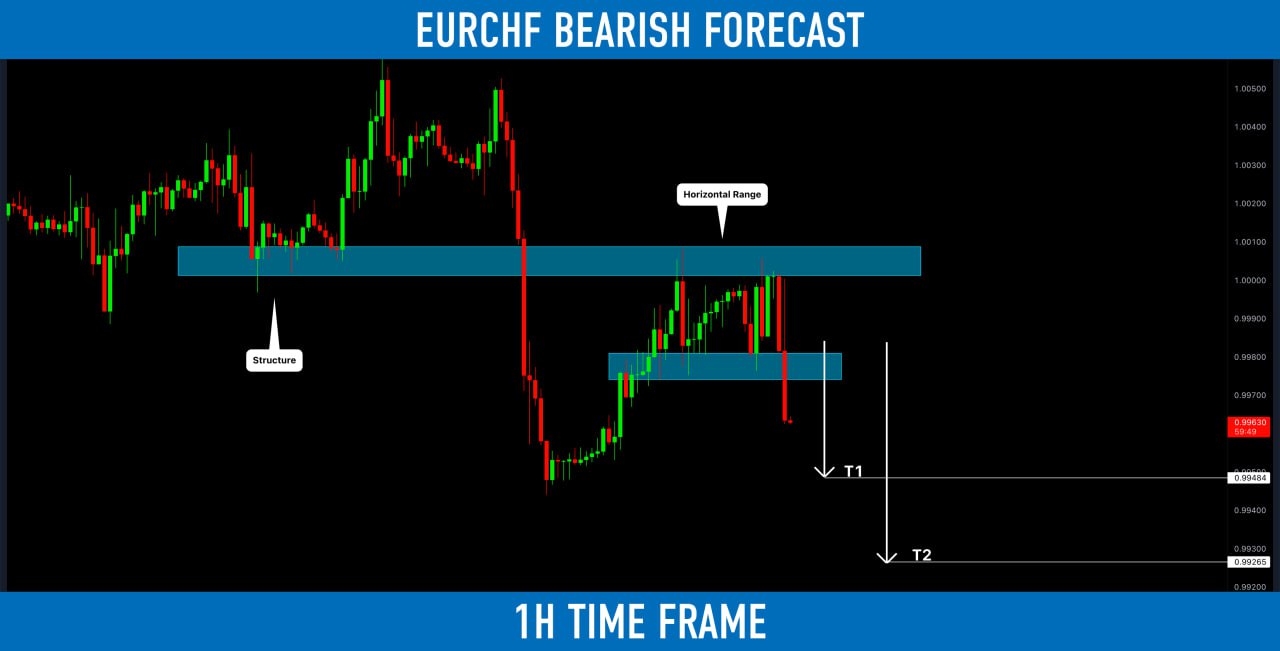
EURCHF reached a key supply area.
The price was coiling for some time on that forming a horizontal trading range.
Its support has been just broken.
I believe that it will push the pair lower.
Goals: 0.9948 / 0.9926
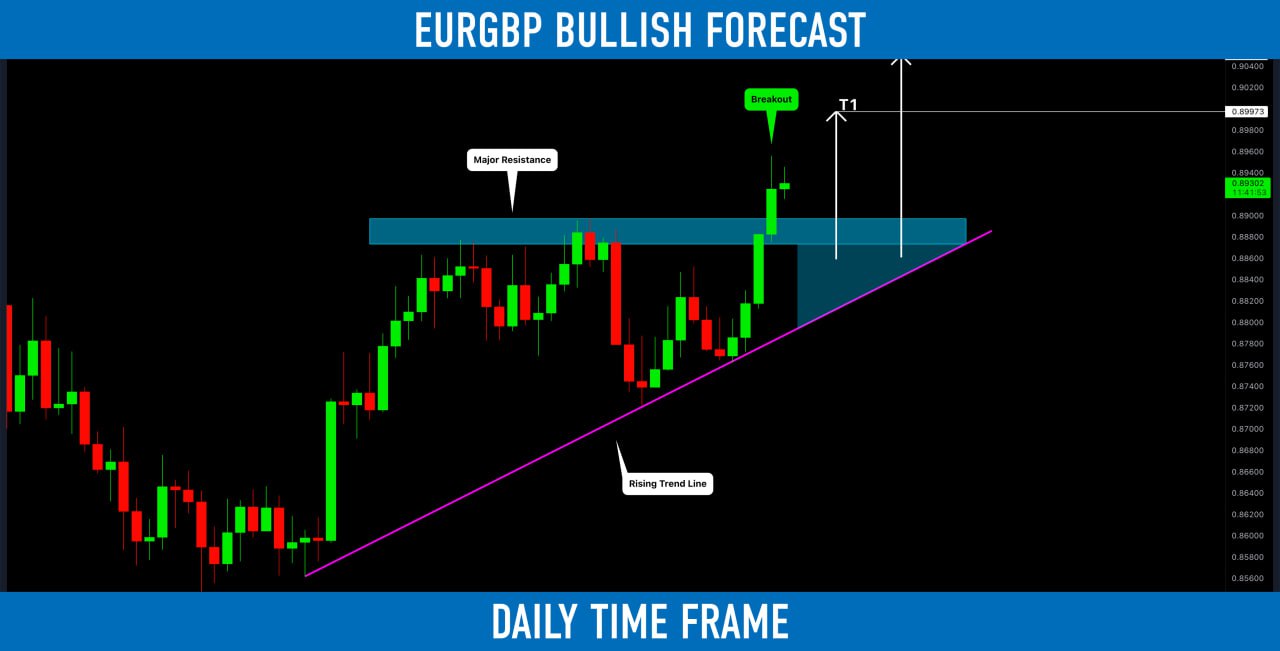
EURGBP formed a huge ascending triangle on a daily time frame.
The price was nicely respecting its horizontal neckline for some time.
It was finally broken yesterday with a strong bullish candle.
Now, the broken neckline of a triangle and its trend line compose a contacting demand area.
I suggest waiting for an occasional retest of that area, expecting a bullish continuation.
Goals: 0.9 / 0.95
1 Like
USDCHF reached a key daily structure resistance.
The pair looks too overbought now.
The price formed a double top pattern with a lower high on 1H time frame
and broke its neckline.
I expect a pullback to 0.92 / 0.917
NZDJPY is trading within a wide horizontal trading range on a daily.
The price was stuck on its upper boundary for 2 weeks.
A double top pattern was formed.
The price has successfully violated its horizontal neckline last week.
I believe that the pair may go lower.
Goals: 82.4 / 81.6
EURJPY dropped nicely from a key daily structure resistance.
I think that the pair can go even lower.
I expect a bearish move to 140.14
1 Like
I spotted a great example of a bullish reversal on

USDJPY.
The pair formed a double bottom formation on a daily time frame
and broke a resistance line of a falling parallel channel.
The underlined blue area is a buy zone based on a broken neckline and a trend line.
The pair will most likely keep growing to 134.4 / 137.63 levels.
The price has nicely respected a major rising trend line and the price successfully broke a neckline of an ascending triangle formation on 4H.
I will expect a bullish continuation now.
Targets: 1895 / 1908
CHFJPY has recently broken a key daily supply area.
The broken structure turned into a demand zone.
Approaching that, the price formed a double bottom formation and broke its neckline then.
I opened a long position early in the morning on a retest.
Now a bullish continuation is expected to 142.7 / 143.05
USDCAD reached a key supply zone on 4H.
The price formed a double top on that and broke its neckline at night.
I expect a bearish movement to 1.3349 / 1.3295
EURCAD was consolidating for 3 weeks in a wide horizontal trading range on a daily.
Its support was finally broken this week.
I believe that the pair may go lower now.
Next support - 1.428
USDJPY is testing a key horizontal demand zone on 4H.
The price formed a double bottom pattern on that and broke its neckline then.
I expect a bullish movement to 132.7
Here is my latest structure analysis for WTI Crude Oil.
Support 1: 72.3 - 73.2 area
Support 2: 70.0 - 71.4 area
Resistance 1: 81.7 - 85.2 wide supply area
Consider these structures for pullback/breakout trading.
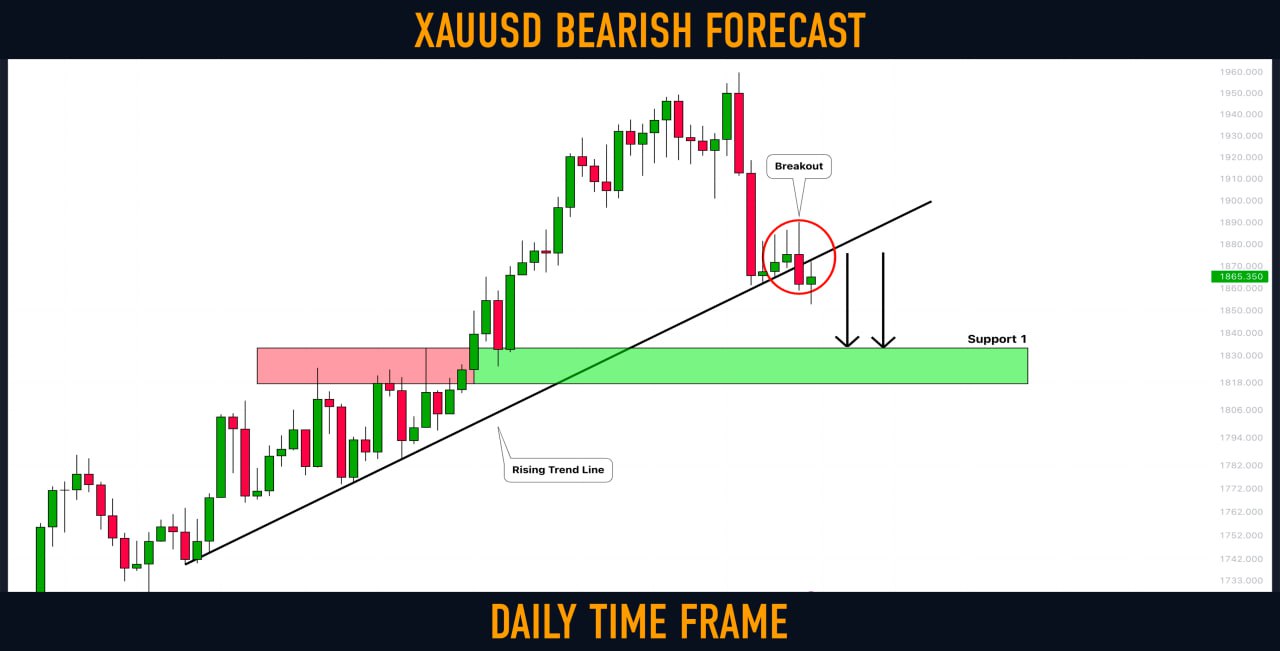
Gold (
#XAUUSD): That Was a Breakout

So it turned out that  Gold broke a major rising trend line yesterday.
The market has successfully closed below that on a daily engulfing the last 3 bullish candles.
That violation may push the price lower.
Next support: 1833
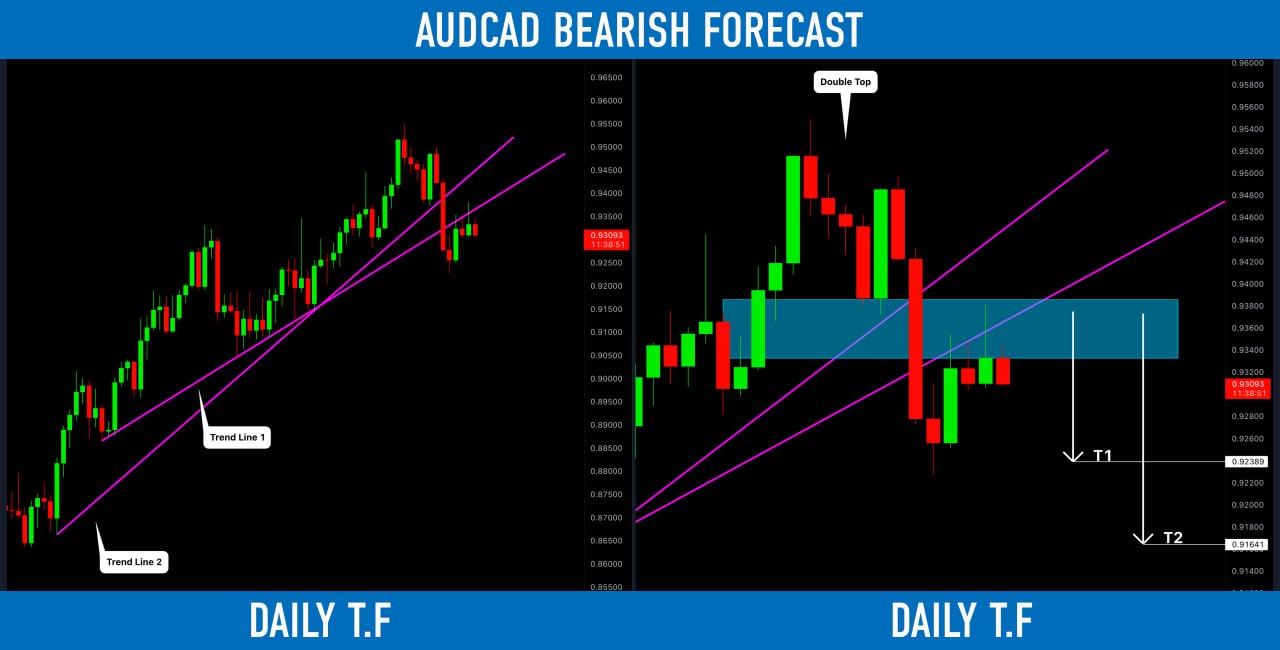
#AUDCAD: Bearish Outlook Explained
AUDCAD looks very bearish:
the price has broken 2 rising trend lines on a daily,
formed a double top and broke its neckline as well.
The price is retesting the confluence zone based on the broken structures.
Probabilities are high that the pair will drop soon.
Goals: 0.924 / 0.916
EURUSD is moving into a correction phase. The price rests against the conditional support at 1.065 and forms a bearish flag. This pattern shows us the potential to revive the fall further.
The price tests the support zone of 1.07116 in a bearish flag format. A breakdown of the support of the local range may lead to liquidating the buying liquidity and activating the momentum for a strong bearish impulse.
However, I expect in the near term an exit of the price from the range downwards, a breakdown of the support of 1.07116, and price movement towards 1.065, and then to 1.0430
Gold (
#XAUUSD): Bearish Outlook For This Week Explained
An important thing happened on Gold this week.
After a strong bearish movement, the price reached a major rising trend line.
The price was coiling on that since Monday.
On Thursday, it was broken, though.
The price closed below that, forming a bearish engulfing candle.
I believe that the market may keep falling next week.
Next support on focus is 1817 - 1833 area.
#GBPNZD: Bearish Move From Key Level
GBPNZD reached an important supply cluster last week.
The price formed a double top pattern on an hourly time frame approaching that.
I expect a bearish continuation to 1.903
USDCAD is trading within a wide horizontal trading range on a daily.
Approaching its resistance, the price formed a double-top pattern.
Its neckline was broken on Friday.
I expect a bearish move to 1.328 now.