Dow Jones Index (
#US30): Waiting For Breakout
Dow Jones Index is very bearish since 7th of March.
Currently, the price is stuck on a solid horizontal support, though.
For now, I am patiently waiting for its breakout.
Daily candle close below that area will confirm the violation.
A bearish wave will be expected then at least to 30900 support.
I will post an update once I spot a confirmed breakout.
#EURCAD: Top-Down Analysis & Trading Plan
EURCAD is approaching a peculiar horizontal demand zone.
The price formed a doji candle, testing that on a daily.
Analyzing a 4H, I spotted a double bottom with a higher low.
1.458 - 1.462 is its neckline.
If the price breaks and closes above that on 4H, I will expect a bullish movement.
Goals will be 1.469 / 1.473.
If the price sets a new low though, the setup will become invalid
For extra confirmation use german sniper indicator
#CADJPY: Bullish Outlook Explained
CADJPY formed a cute double bottom on a key horizontal support on 4H.
Its neckline was broken during the Asian session.
I believe that the pair will most likely bounce.
Target - 98.3
Bitcoin (
#BTCUSD) has just broken a new yearly high!
Bulls are pushing Bitcoin again.
The price have updated a new high and currently approaching 27000 level.
From a technical perspective, we see a breakout attempt of a major weekly resistance cluster.
The weekly candle closes in 2 days. Closing above the underlined area, Bitcoin will open a potential
for a further bullish continuation.
Gold (
#XAUUSD): Your Trading Plan For This Week
Gold is unstoppable.
The market closed, forming a high momentum bullish candle on a daily.
The price is currently approaching a solid resistance cluster.
To catch a bullish continuation, watch 1977 - 2000 area.
If the price breaks and closes above that, probabilities will be high,
that the market will go much higher.
Next goal for buyers will be 2050.
#EURCAD: Time to Grow!
Update for my Friday’s post on EURCAD.
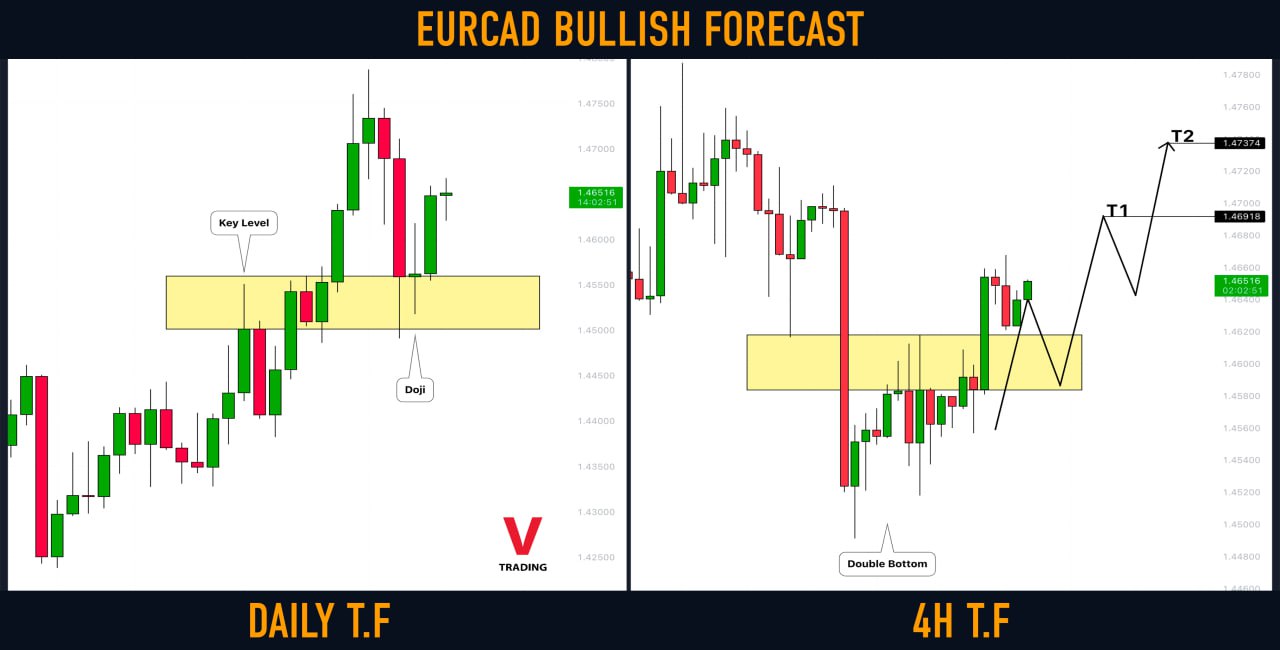
The price has perfectly respected a horizontal key level on a daily:
after a formation of a double bottom pattern on 4H, its neckline was successfully broken.
Now, a bullish continuation is expected.
Targets: 1.469 / 1.4735
For additional confirmation use: VWAP MT4 Indicator
#NZDUSD: Classic Top-Down Setup
NZDUSD is approaching a solid horizontal daily resistance.
We see a strong bearish reaction from that:
the price formed a rising wedge pattern and a head and shoulders pattern,
the support of the wedge and the neckline of h&s were successfully broken.
I believe that the pair may drop.
Goals: 0.6237 / 0.622
Dow Jones Index (
#US30): Key Levels to Watch This Week
Here is my latest structure analysis and key levels to watch this week on Dow Jones.
Support 1: 31420 - 31830 area
Support 2: 30690 - 30900 area
Support 3: 30070 - 30360 area
Resistance 1: 32250 - 32610 area
Resistance 2: 33430 - 33660 area
The market is currently stuck between Support 1 & Support 2.
The market participants are awaiting the interest rate decision on Wednesday.
It will most likely clarify the future direction of the market with a breakout.
Consider the underlined structures for pullback/breakout trading.
GBPCHF broke and closed above a major falling trend line on a daily.
The broken trend line turned into a key vertical support now.
Probabilities will be high, that a bullish movement will initiate from that.
Next goals for buyers: 1.1423 / 1.151
For Additional confirmation use: Leading Indicators
GOLD (
#XAUUSD): Detailed Structure Analysis
Here is my detailed structure analysis for Gold.
Resistance 1: 1998.0 - 2010.0 area
Resistance 2: 2050.0 - 2070.0 area
Support 1: 1949.0 - 1960.0 area
Support 2: 1875.0 - 1904.0 area
Support 3: 1854.0 - 1859.0 area
Support 4: 1804.0 - 1813.0 area
Consider these structures for pullback / breakout trading.
AUDNZD reached a solid horizontal structure resistance.
The price formed a doji candle on 4h and a double top pattern on 1H time frame.
The neckline of the double top has just been broken.
I expect a retracement to 1.0767 / 1.0744
For Additional confirmation use: Swing Trading Indicators
#GBPNZD: Classic Bullish Setup Explained
GBPNZD formed a huge ascending triangle formation on a daily time frame.
Its neckline was broken yesterday.
Probabilities are high that the price will grow now.
Goal - 1.998
For Additional confirmation use: Trend Indicators
#EURUSD: Important Breakout
Bulls push EURUSD heavily after yesterday’s Interest Rate Decision and FOMC.
The price has successfully broken and closed above a solid horizontal supply cluster.
The next solid resistance that I see is 1.099 - 1.103 area.
Probabilities will be high that it is the next goal for buyers.
For those, who missed entries, I strictly recommend waiting for a pullback first.
I will post an update later on.
For Additional confirmation use: Xmaster Formula MT4 Indicator
#GBPCAD: Pullback From Key Level
GBPCAD reached a major horizontal resistance.
The price has nicely reacted to that, forming a bearish engulfing candle on 4H time frame.
I expect a retracement from the underlined structure.
Goals: 1.68 / 1.677
Nasdaq-100 Index (
#US100) Waiting For Breakout
Nasdaq Index is stuck between 2 solid structures.
Depending on the reaction to the underlined areas, I see 2 potential scenarios.
1 - Bullish
If the price breaks and closes above 12700 - 12900 supply cluster on a daily,
I will expect a bullish movement at least to 13130
2 - Bearish
If the price drops and closes below 12300 - 12500 demand area on a daily,
I will expect a selloff to 11900
Wait for a breakout, it will show us the future direction of the market.
For Additional confirmation use: Breakout Indicator
#CHFJPY: Classic Bearish Setup
CHFJPY has nicely respected a confluence zone based on a horizontal 4H resistance and a 0.5 retracement of the last bearish impulse.
The price formed a double top pattern on that and broke its neckline.
Probabilities will be high that the pair will drop lower soon.
Goals: 141.172 / 140.363
Market Breakdown | WTI Oil, EURUSD, GBPNZD, EURAUD
Here are the updates & outlook for multiple instruments in my watchlist.
WTI Oil daily time frame
The market is trading in a long term bearish trend .
After the last sharp bearish movement, the market is steadily recovering.
Ahead, I see a major horizontal supply area.
Probabilities are high, that the next bearish wave will initiate from there.
EURUSD daily time frame
After a breakout of a solid daily resistance, the market is preparing for its retest.
Watch carefully the underlined zone and look for buying opportunities from there.
EURAUD weekly time frame
The pair is currently approaching a weekly horizontal resistance cluster.
Taking into consideration, that the pair is quite overbought, probabilities will be high to see a pullback from that
GBPNZD daily time frame
The pair is currently retesting a broken neckline of an ascending triangle . As we discussed earlier, the trend line of a triangle and its neckline compose a contracting buy zone now.
Chances will be high that the next bullish wave will initiate quite soon.
For Additional confirmation use: Divergence Indicators
Gold (
#XAUUSD): 2 Scenarios For This Week Explained
Gold closed this week, approaching a solid daily resistance.
Depending on the reaction of the price to that structure, I see 2 potential scenarios for next week.
Bullish Scenario
If the price breaks and closes above 2010 resistance on a daily,
a bullish continuation will be expected to 2060 level.
Bearish Scenario
The price may respect the underlined resistance.
1917 - 1940 is the closest strong support.
If the price drops and closes below that area,
a bearish continuation will be expected to 1891.
Wait for a breakout and then follow the market.
For Additional confirmation use: ROC Indicator
#USDJPY: Key Levels to Watch This Week
Here is my latest structure analysis for USDJPY.
Resistance 1: 132.46 - 133.25 area
Resistance 2: 135.0 - 135.8 area
Resistance 3: 137.36 - 137.9 area
Support 1: 129.64 - 130.7 area
Support 2: 128.09 - 128.7 area
Support 3: 127.2 - 127.8 area
Consider these structures for pullback/breakout trading.
#GBPNZD: Nice Bullish Clues
Update for GBPNZD.
It looks like the price has nicely respected a broken triangle.
The price formed a bullish engulfing candle on a daily.
Bullish bias on a pair remains.
Goal remains unchanged - 1.997