I hope this answers your question my whole Strategy is trading on the Directional Strength Combined of Daily/Weekly and Even Monthly Chart if they are all going in same direction.
Every pair is going to get oversold and change direction however just make sure you IF you take Your Pips and change direction do it at the right entry point,
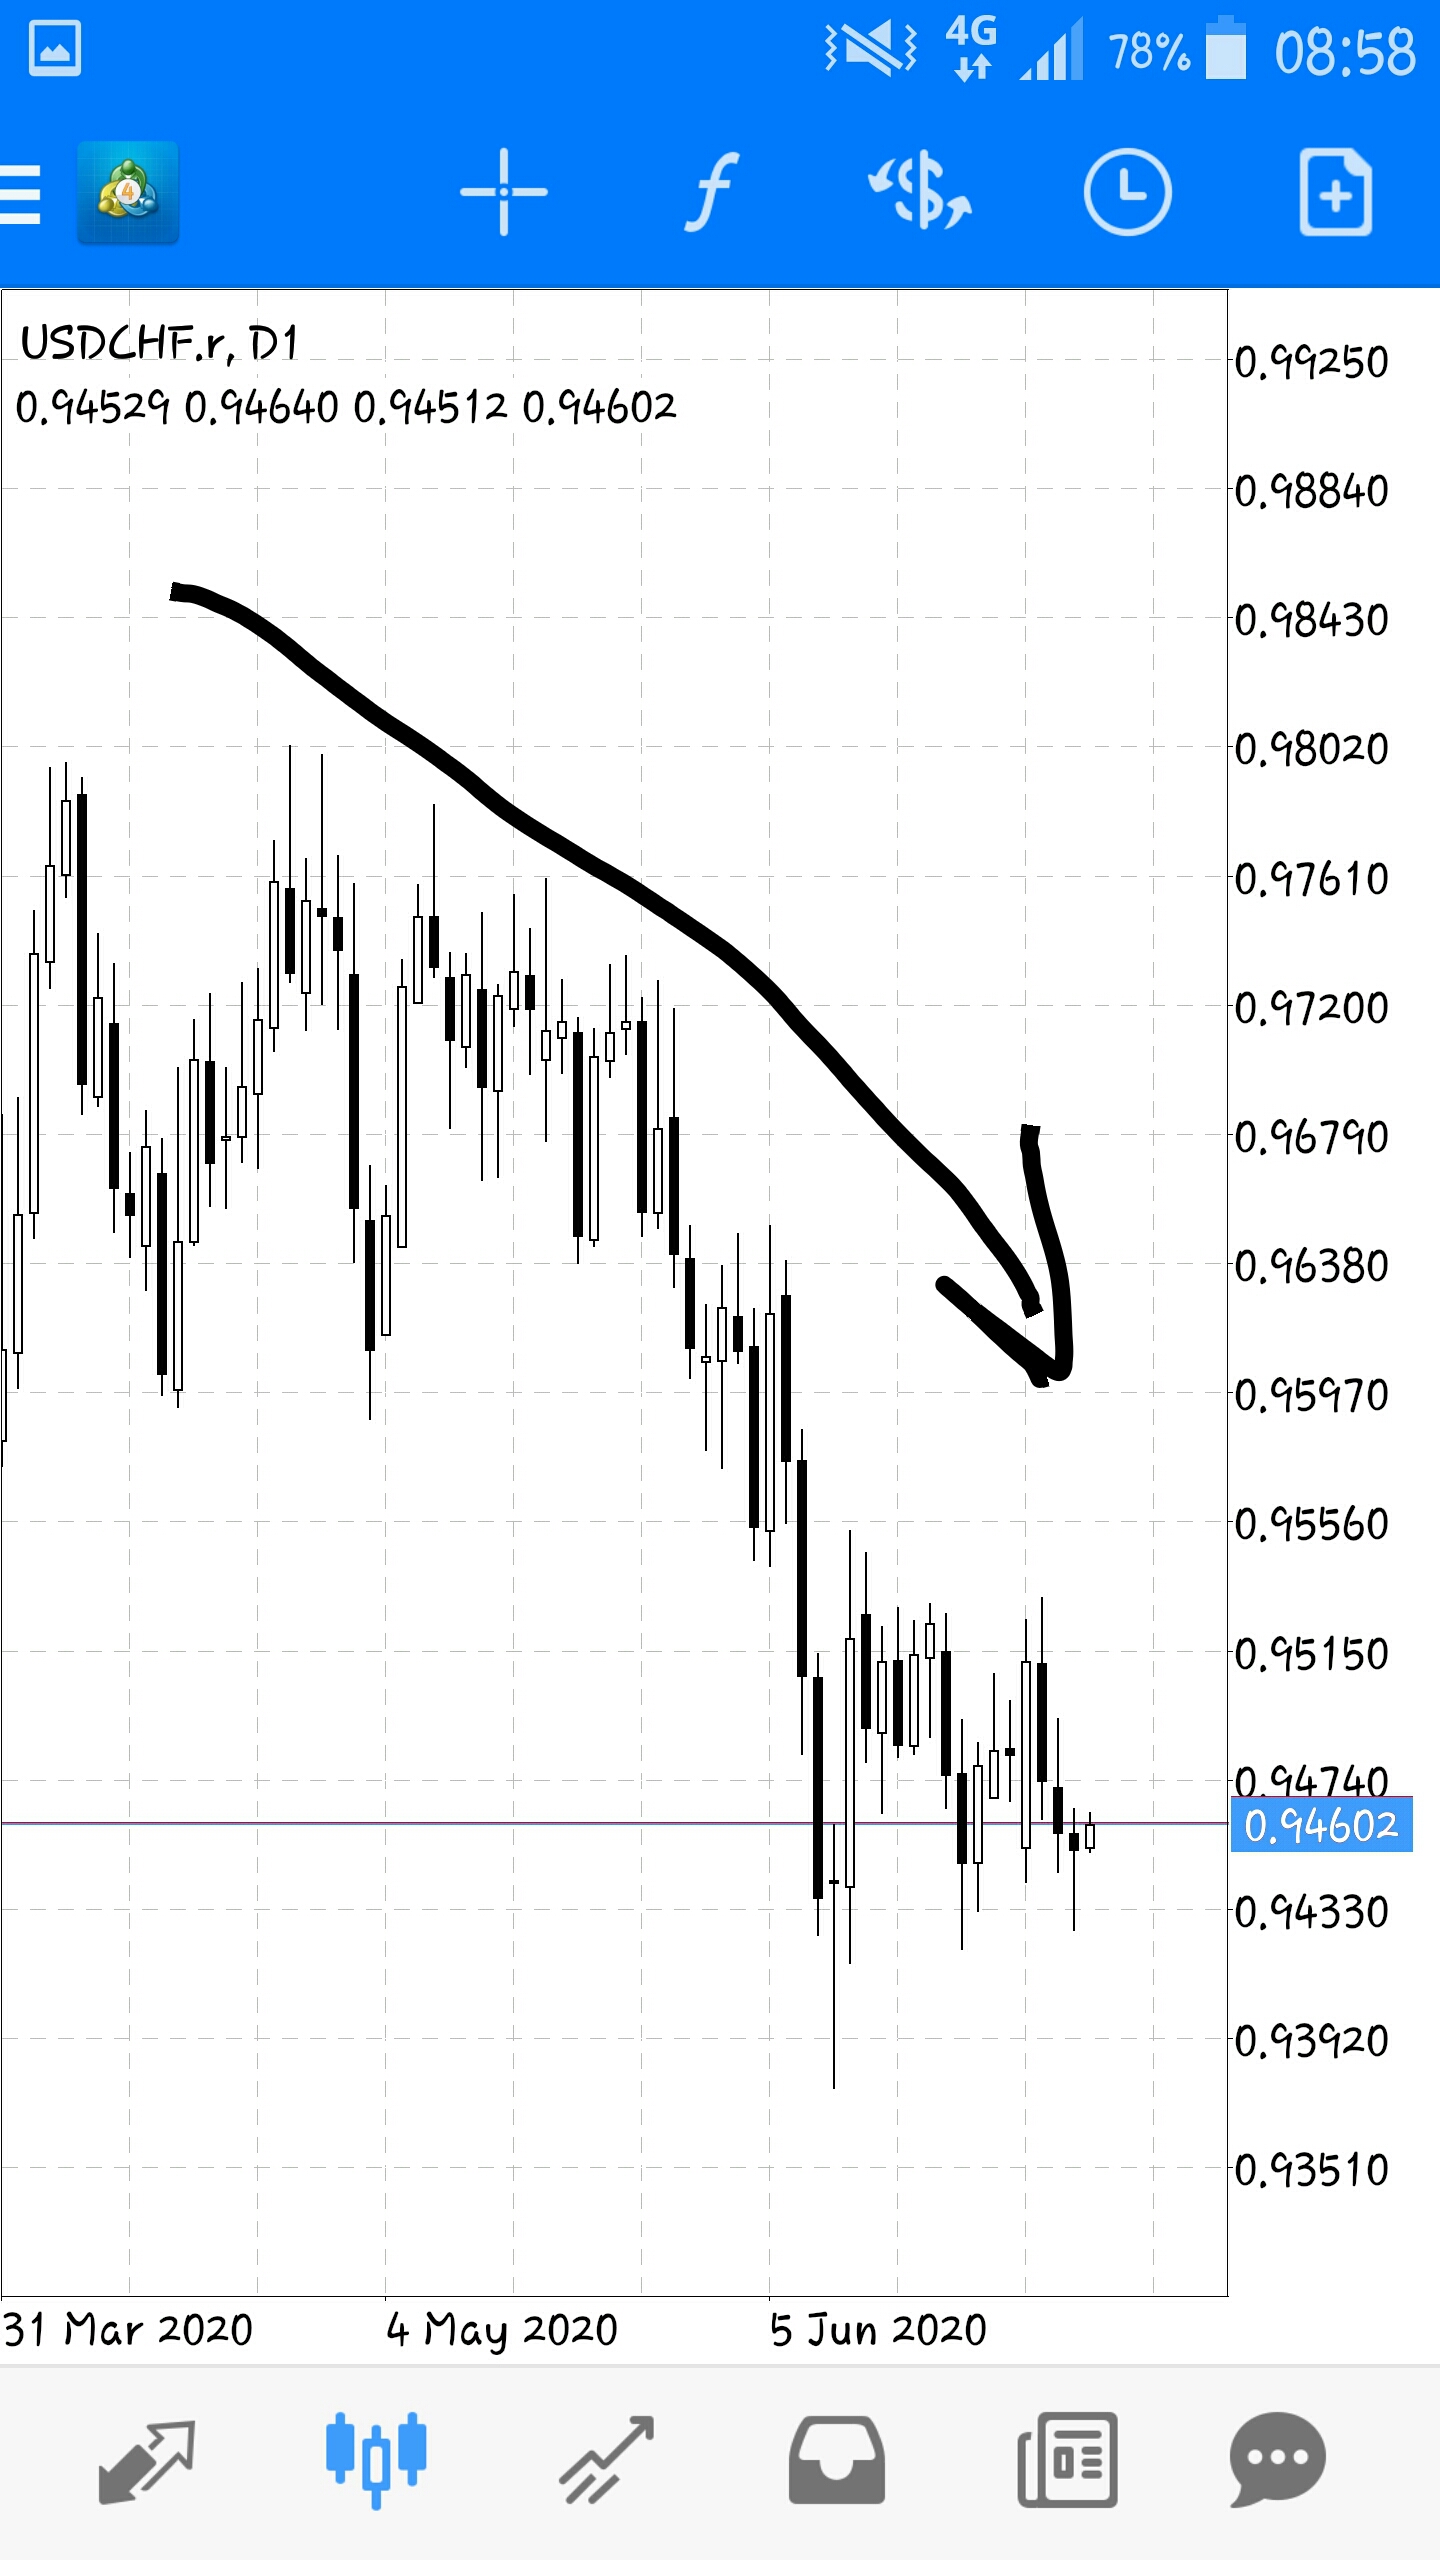
You mentioned USDCHF is LONG both on Weekly and Daily. Did you mean SHORT? I’m trying to understand what you see when you say a pair is trending up or down.
To Answer your Question there are better charts out there Color Coded that lets you know Change of Direction you can them Free on Metatrader 4 for free I believe Color Fibonacci Retracement . I paid version from a company that when I was new I paid $$$$$$$$$$$$$$$$$$$$$$$$$$$$$$$$$$$$$
which I did not know better at the time. Stupid . I did not know about Babypips and their Awesome education.
!
If you notice on the chart the DOT is called a (Color Fibonacci Retracement) change of Chart Direction. The Arrows on this particular Indicators lets say for example on Day Chart Trends UP then reversals down.
Its hard to tell on what you sent me but that is exactly what the Pair is doing just Hard to read.
10 trades for a beginner is a lot. I think 10 trades at a time is for experienced traders. Perhaps, for me it’s best to start with just two trades, get comfortable managing that, then slowly start increasing the # of trades.
Especially if you don’t have TP. For me, it would be a disaster.
This Chart has all three Indicators 14/7 red and Yellow MA entry 2nd candle below cross, 50 Blue MA which also puts it below the the 2nd candle and the Tipu MACD( free indicator on metatrader 4 platform has the Entry Arrow)
I can’t explain it better than that. As far as Exit.
Exit:
You can either Exit early and take your Pips and if you hit your daily or Weekly Goal or ride it down when it starts to reverse.
Now you know . All Three of those Entry points don’t happen all the time but at least follow the 14/7 rule and look for the others.
Look for my Demo Thread and you can follow those trades all month long these are what I am strictly following this month.
This is pretty much the opposite of what you stated in the original post. If we are following the trend, shouldn’t that be a sell trade ??
You also mentioned USDCHF in a previous example and everything on the chart points to a downward trend on the Weekly and Daily yet you stated Buy. Can you explain please.
Not going to lie I can’t really understand all those colors it hurts my eyes. I’m guessing the entry is given to you by the arrow.
It seems simple since it’s an MA but just like any other indicator it’ll never work 100% of the time. What do you do when a trade goes against you since you don’t use SL? That’s all fine and dandy until you run into a Brexit like situation where a pair drops 1,000. The good thing is you’re only going for 0.01 lot so even at that you’d be only losing $100. This strategy relies on the position size being small enough where it’ll generate pips over the month and if it goes against you it won’t be catastrophic as well. It’s a balancing act it seems.
As long as it works for you I can’t really say anything honestly.
@tabiuslee thank you so much for the reply I truly appreciate.
I now understand how the 7/14 cross works with the MACD.
Still not well clear with how the 50 MA contributed.
It’s just a extra indicator I use. You don’t need it. I just use all three to see where each are lining up. Some days the market is all screwy and I just want to see if everything is lining up in place. Does not have to perfect.
Have a Trading Plan, Be Patient, and Stick too to it.
I trade with confidence because I started out Live trading with $100 and have continued to do Demo’s for the Last 3 Year’s.
NOTE: on other 2 Accounts I did Close the Day with 163 Pips and Grow Forex Accounts Overall by 4%
I showed the one Account today because as a New Trader you can be so Impatient for Profit, so Upset because Account is in Drawdown , when trading the Trend and finding a Broker with decent leverage allows you Breathing Room and less stress.
TabiusLee
My Proof Profit Strategy
trading daily chart
I have 1 account I Hold and Day Trend and close out when Pips hit 400 to 1000 pips and my other Accounts I may take Pips on Reversals depending on the H1 and H4 .
What I do with my other 2 accunts is compare signals from different sources, and only choose what goes with my Trading System and Indicators I have shared here. If their is a Entry I may take multiple trades on 1 account with 1 pair and on another pair close them out when I hit Pip Goal.
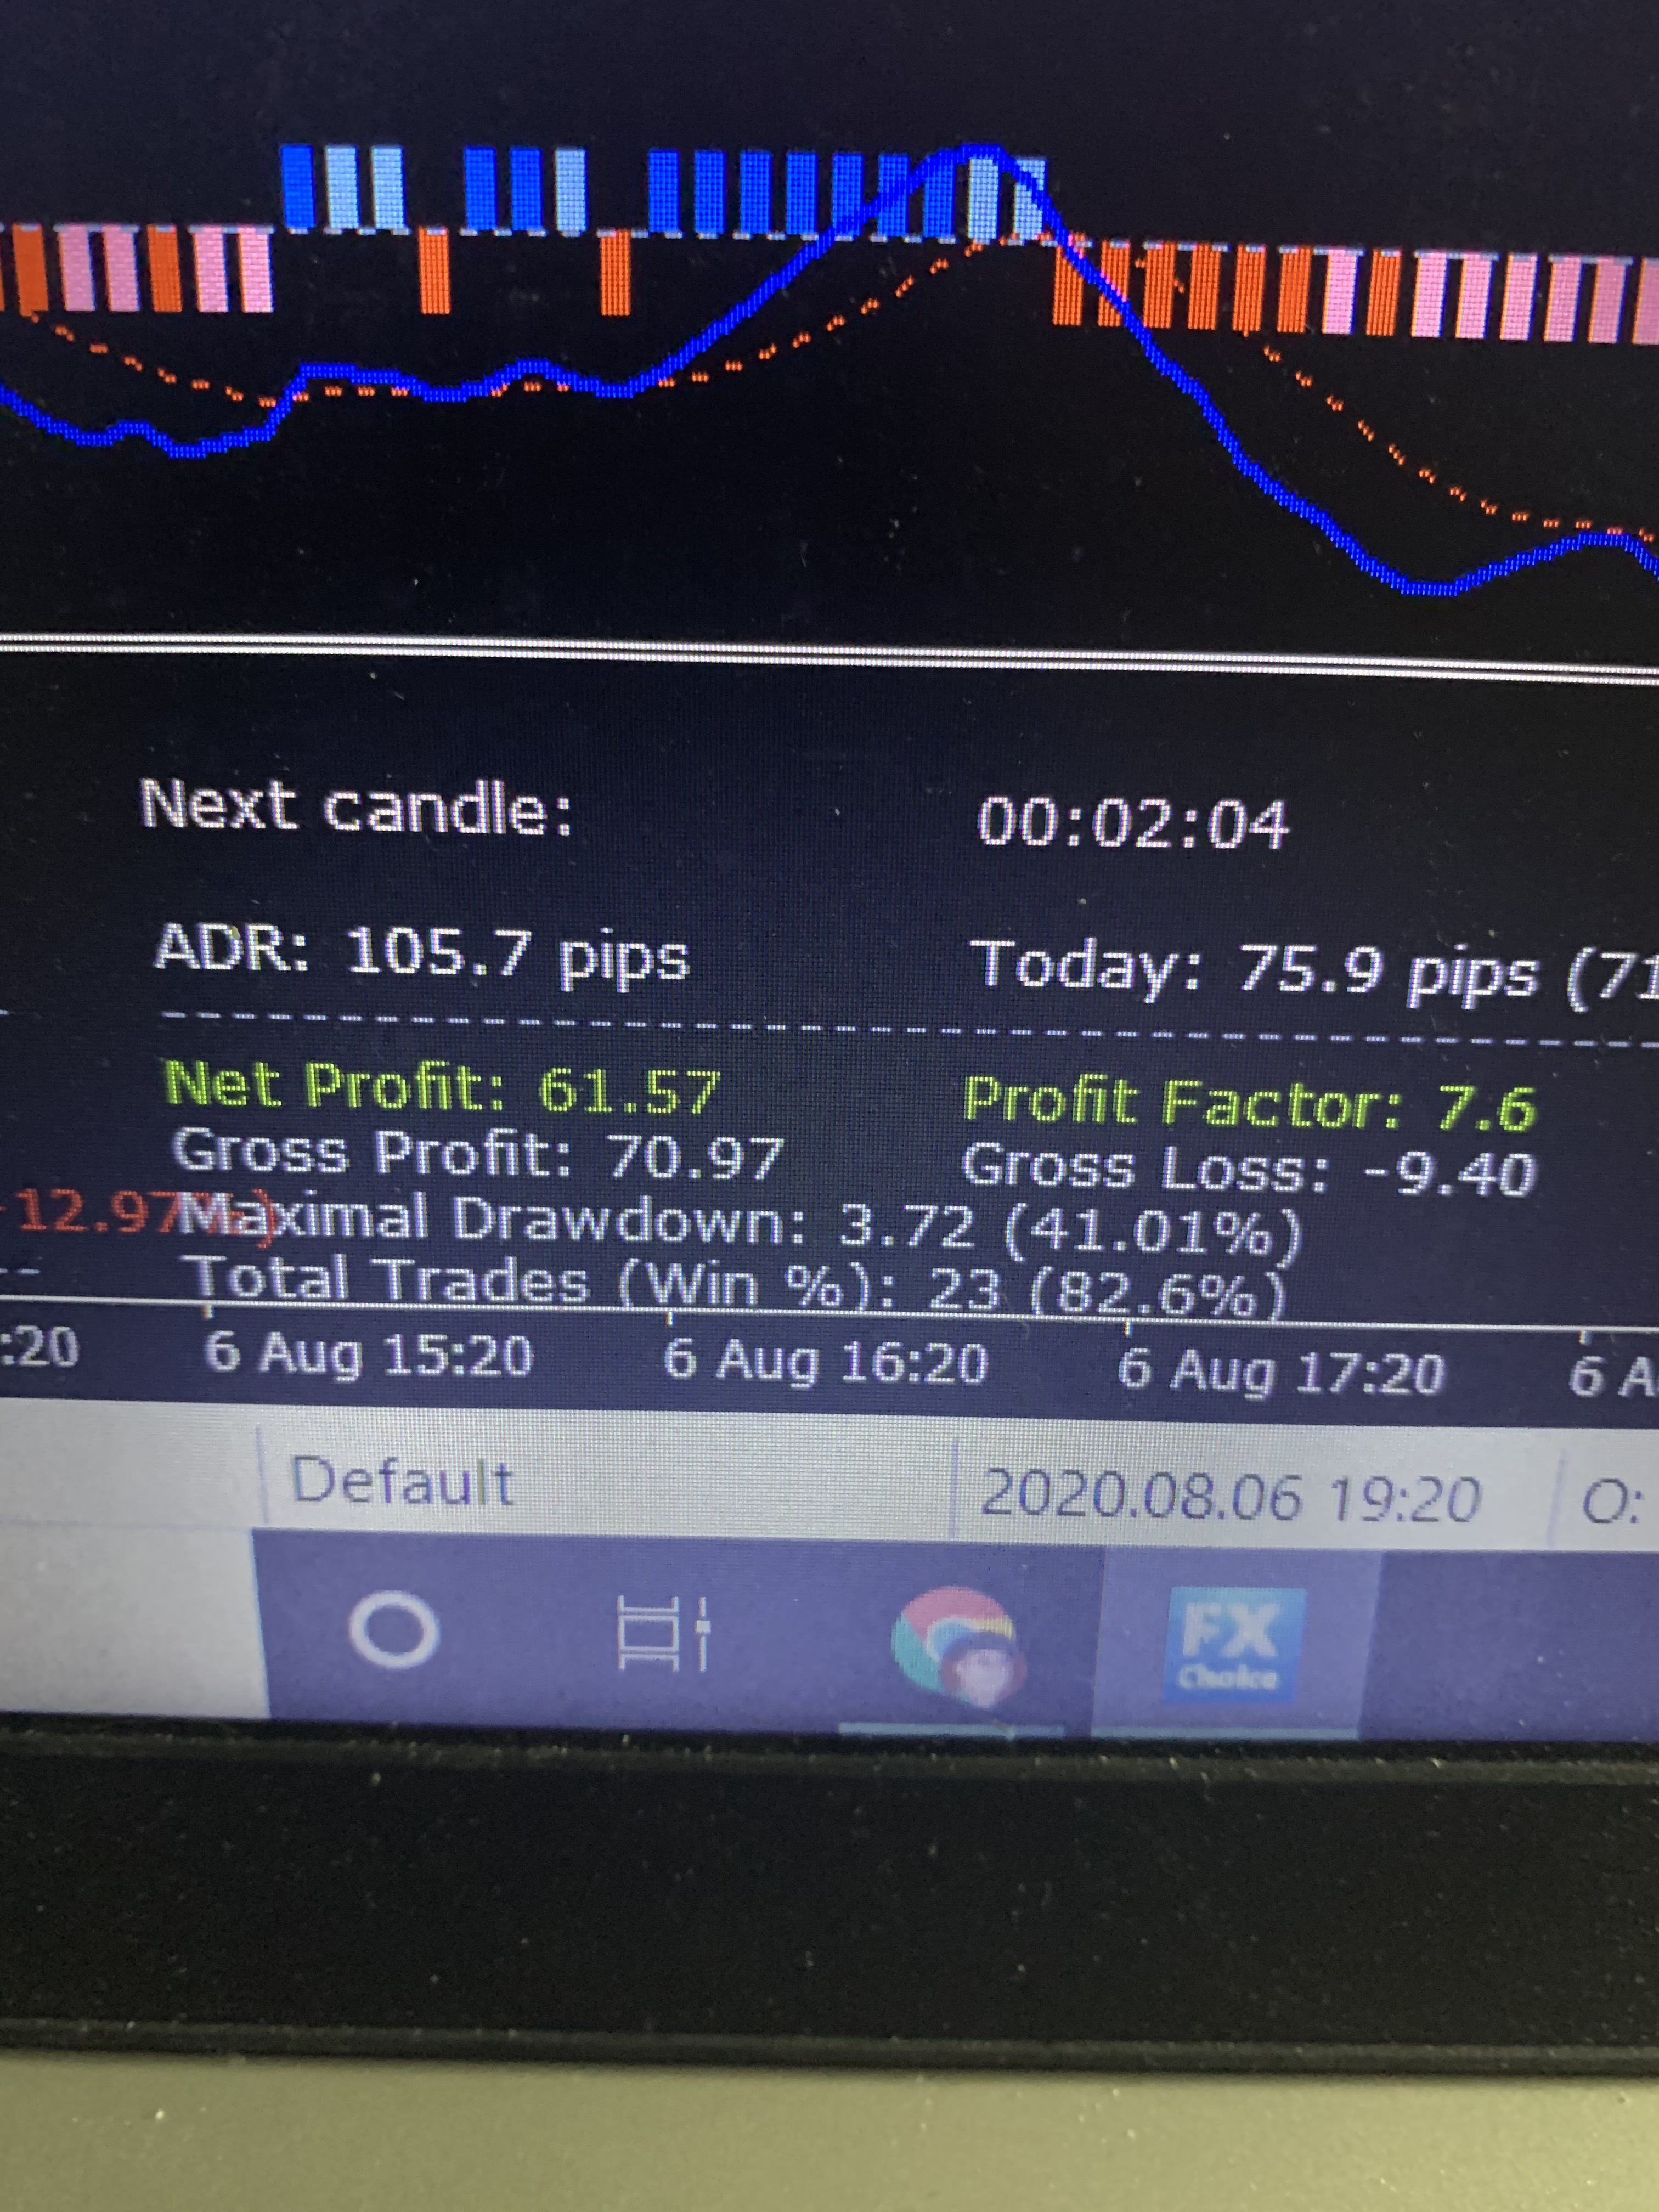
I wanted to share this. I am now using Entry points. Stop Losses and Take Profit in all my trading. Out of 23 trades i have 83% success rate. using the indicators above. I just am trading the Weekly/Day Chart . If EuroUSD is Bullish then I go to Smaller time frame and draw my line close to the top and take my 20 or 30 pips and walk away from computer,
I am taking profit .01 multiple pairs and opening back up other pairs depending what they are doing on the Smaller time frames. Do not take profit all at once. Keep drawdown at a minimum and take daily/weekly pip goal and let account build.
For Instructions on what indicators look at pictures above. Trading the Weekly/Daily Charts and whats TRENDING at the TIME


 !
!