My Trading Log

USDJPY short was closed @ BE earlier today. I felt uneasy about taking that trade ever since I opened it. Shorting the USD after considering it strong in the analysis was a mistake. When I go back to work I won’t be able to babysit my trades anymore like I do right now, which is probably for the better.

GBPJPY short is still active and has been in drawdown all day. I’m still bearish on the pair, so there’s no reason to interfere with the trade.

GBPUSD hit the SL and became the first closed trade, causing the MacGyver Index to drop 20 points to 980. I’m still bearish on the pair and I might enter again if a good setup appears.
I don’t think my analysis was that much off but the SL may have been to tight.

EUR general strength today against:
GBP - fell sharply, recovering slightly toward the end
JPY - rose substantially, falling back slightly toward the end
USD - little movement, went up very slightly

GBP general strength today against:
EUR - gained substantially, some retracement toward end
JPY - rose sharply
USD - rose substantially

JPY general strength today against:
EUR - fell, recovered slightly toward the end
GBP - fell sharply
USD - fell sharply but recovered about half the decline

USD general strength today against:
EUR - slightly down on inside day
GBP - fell
JPY - rose substantially but retraced about half the ascent
USD Index chart:

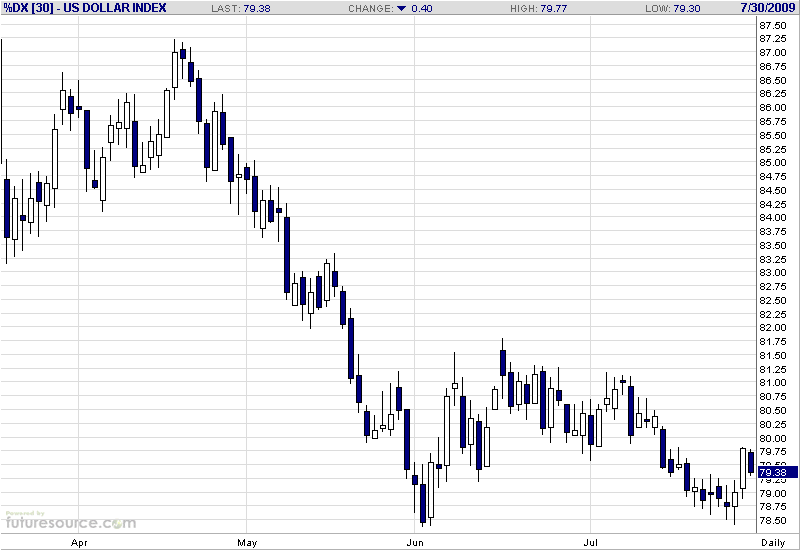
Pullback in the USD index today, forming an inside bar. Uncertain bias for near term.

Strongest currency today of the four: GBP

Weakest currency today of the four: JPY

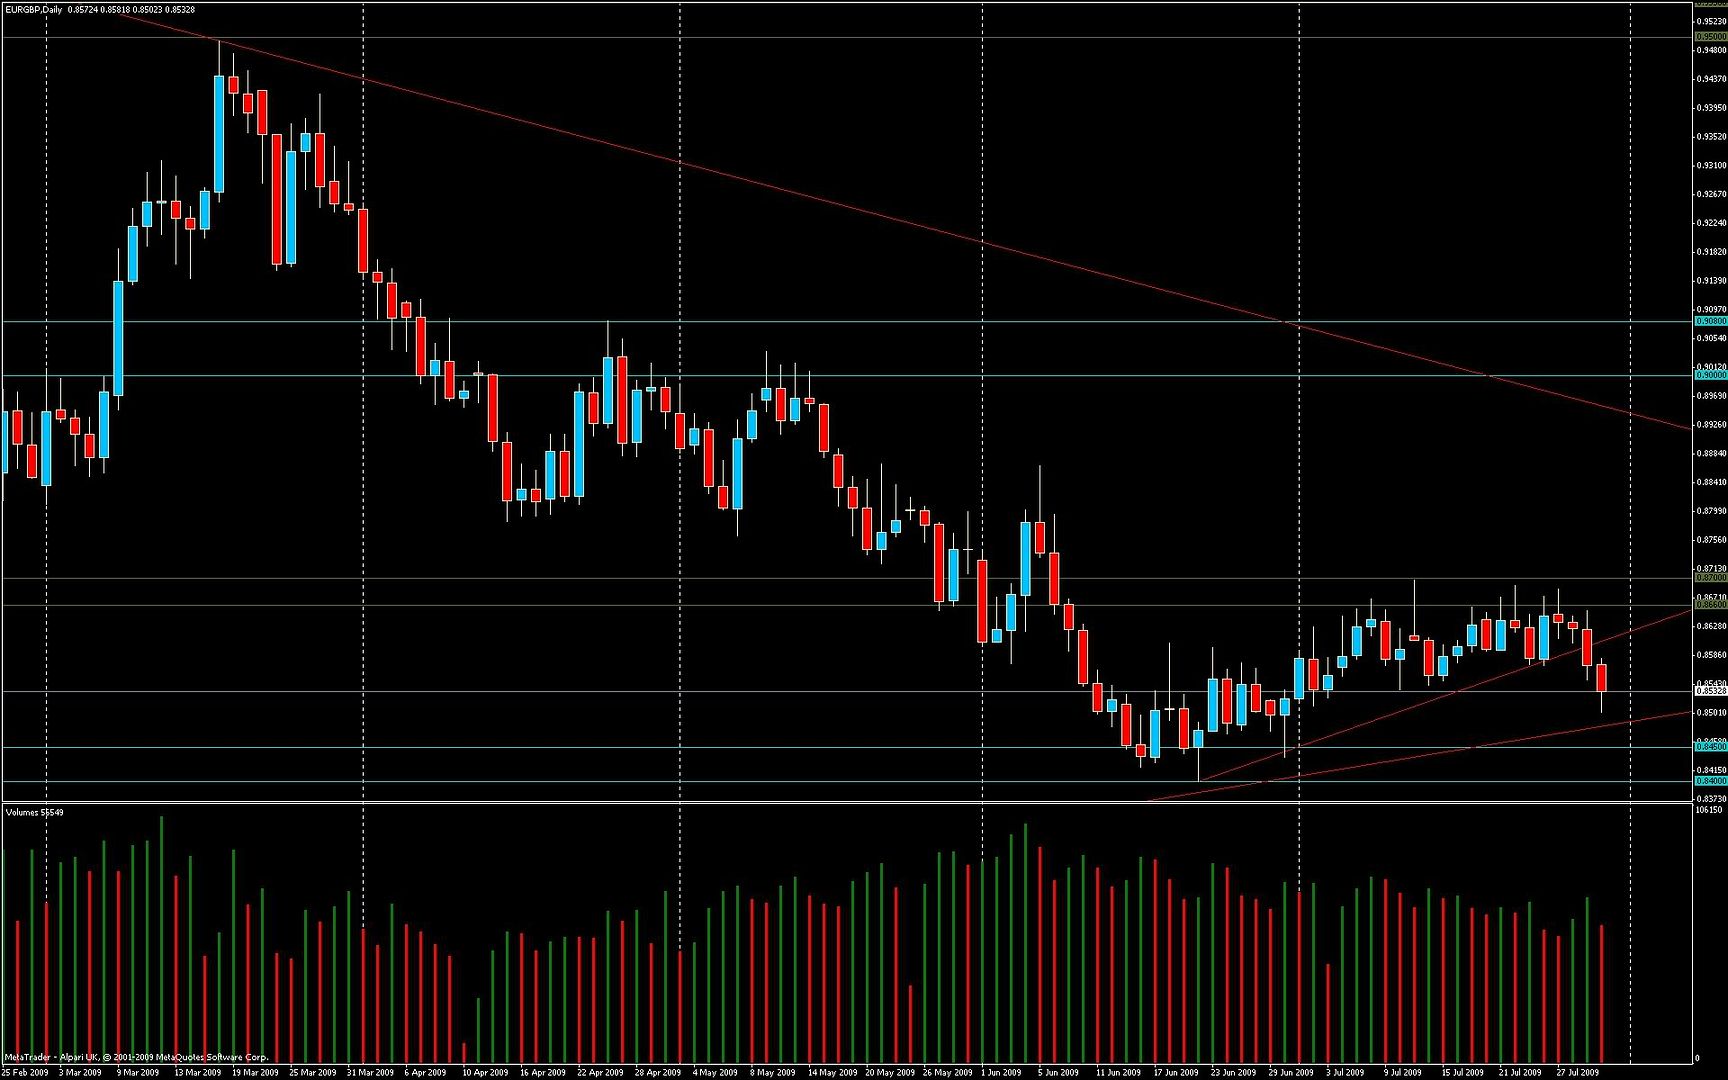
EURGBP charts:

General candlestick and S/R analysis
A second powerful bearish candle today. Price is currently not close to any SR zones. Almost reached the older S trendline today. Scaling all the way out to a monthly chart gives a very bearish look with an almost perfect gravestone doji forming.

VSA analysis
Still looks like little demand on hourly up bars today. Two highest volume bars may together represent a selling climax, suggesting that a retrace might be in store before any further drops

Bias
Bearish although we may see a retrace first

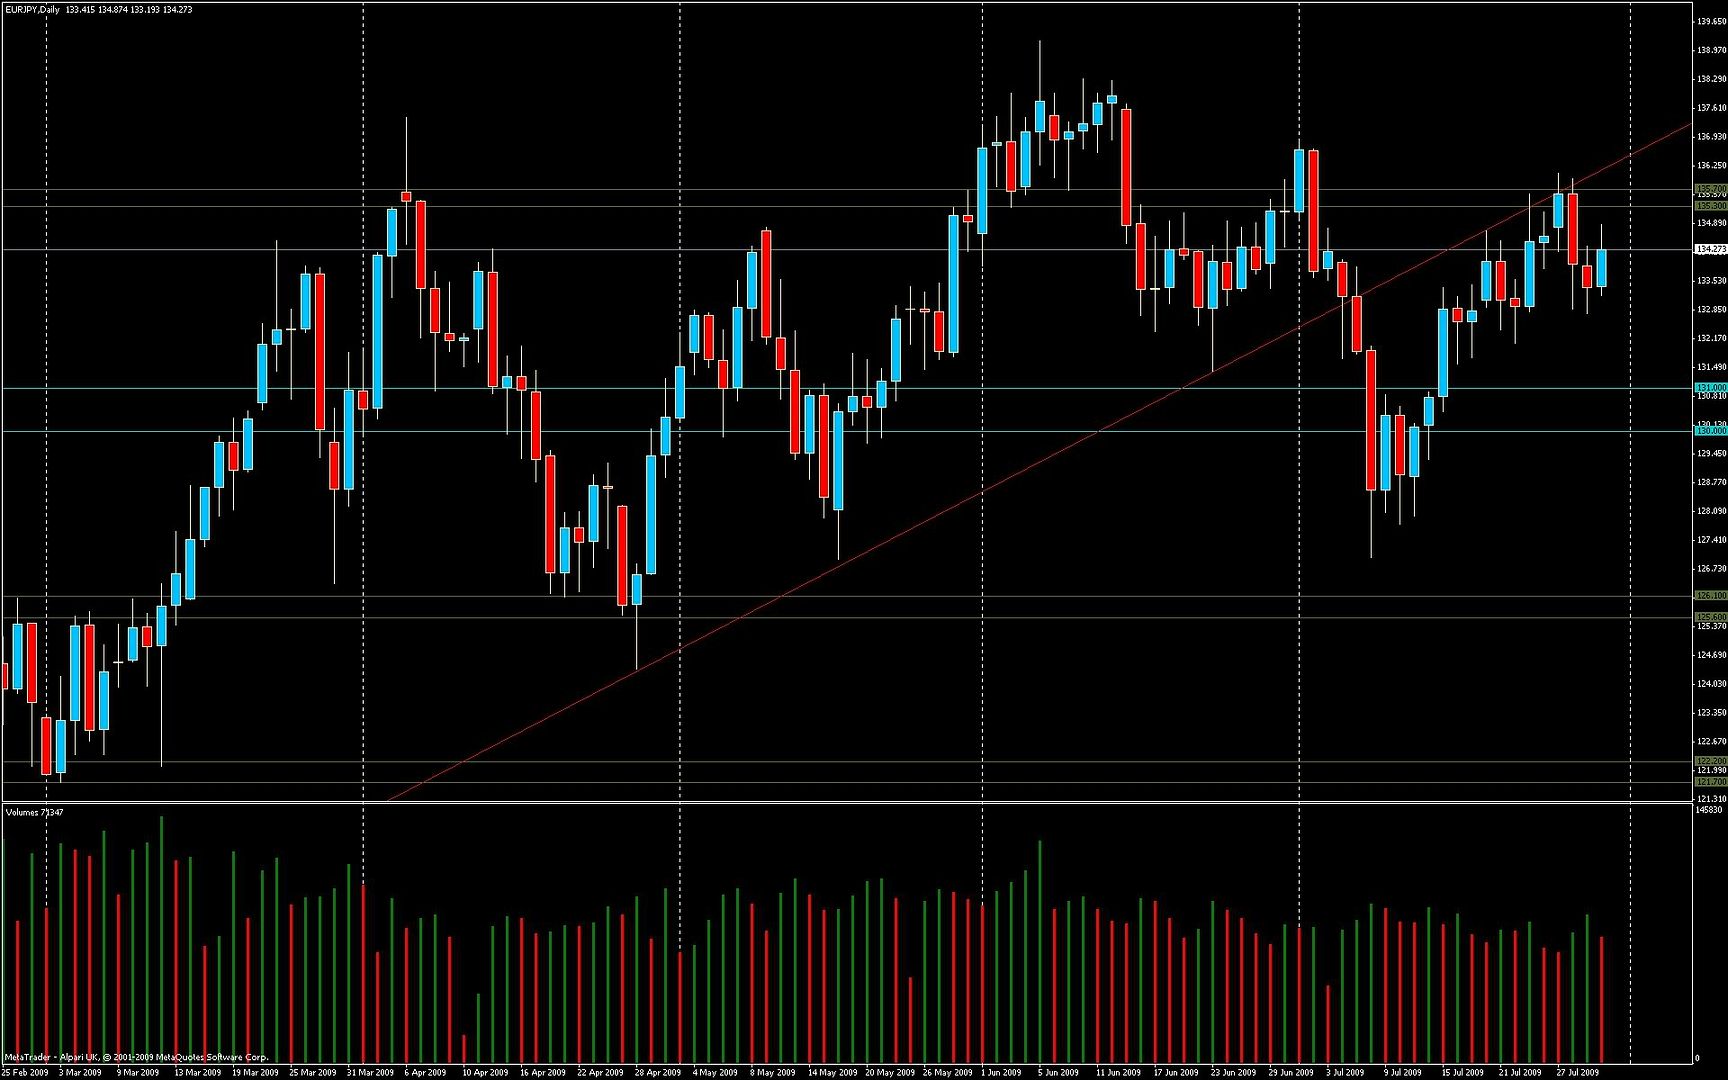
EURJPY charts:

General candlestick and S/R analysis
We see a bullish engulfing bar today, with an upper wick suggesting sellers want a say if price approaches the 135 level.

VSA analysis
1H chart shows a strange day where up bars have been on dropping volume and down bars have been on higher volume - and still price has gone up quite a bit today. Can’t make heads or tails of that.

Bias
Bearish

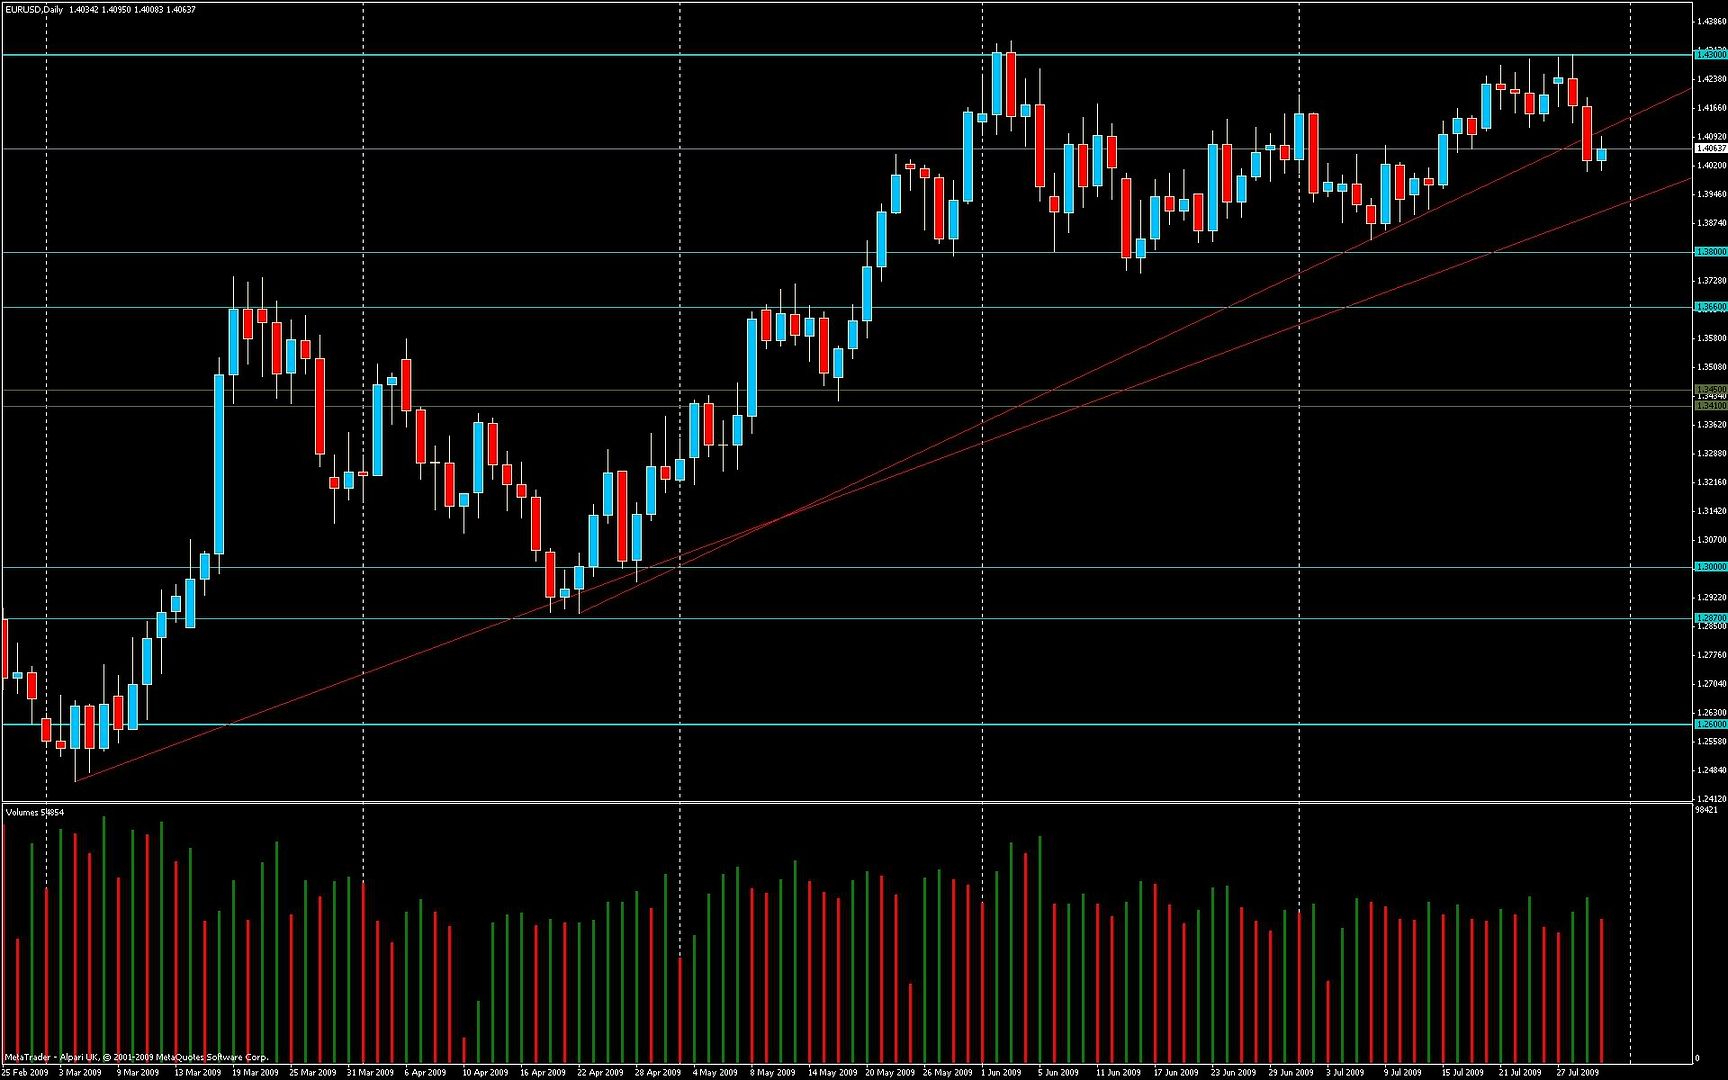
EURUSD charts:

General candlestick and S/R analysis
Price respected the old trendline which is therefor now viewed as a R trendline, it also stayed beneath 1.41. Todays small inside bar looks like some profit taking maybe.
Can’t help but peeking at Weekly, where a real nice bearish engulfing setup is forming with the highs bouncing against the 1.43 R zone.

VSA analysis
1H very ranging showing that the market wasn’t interested in pushing price anywhere much today. Outbreak attempts turn into pin bars on high volume showing that the smart money for some reason felt happy to keep price steady today.

Bias
Bearish

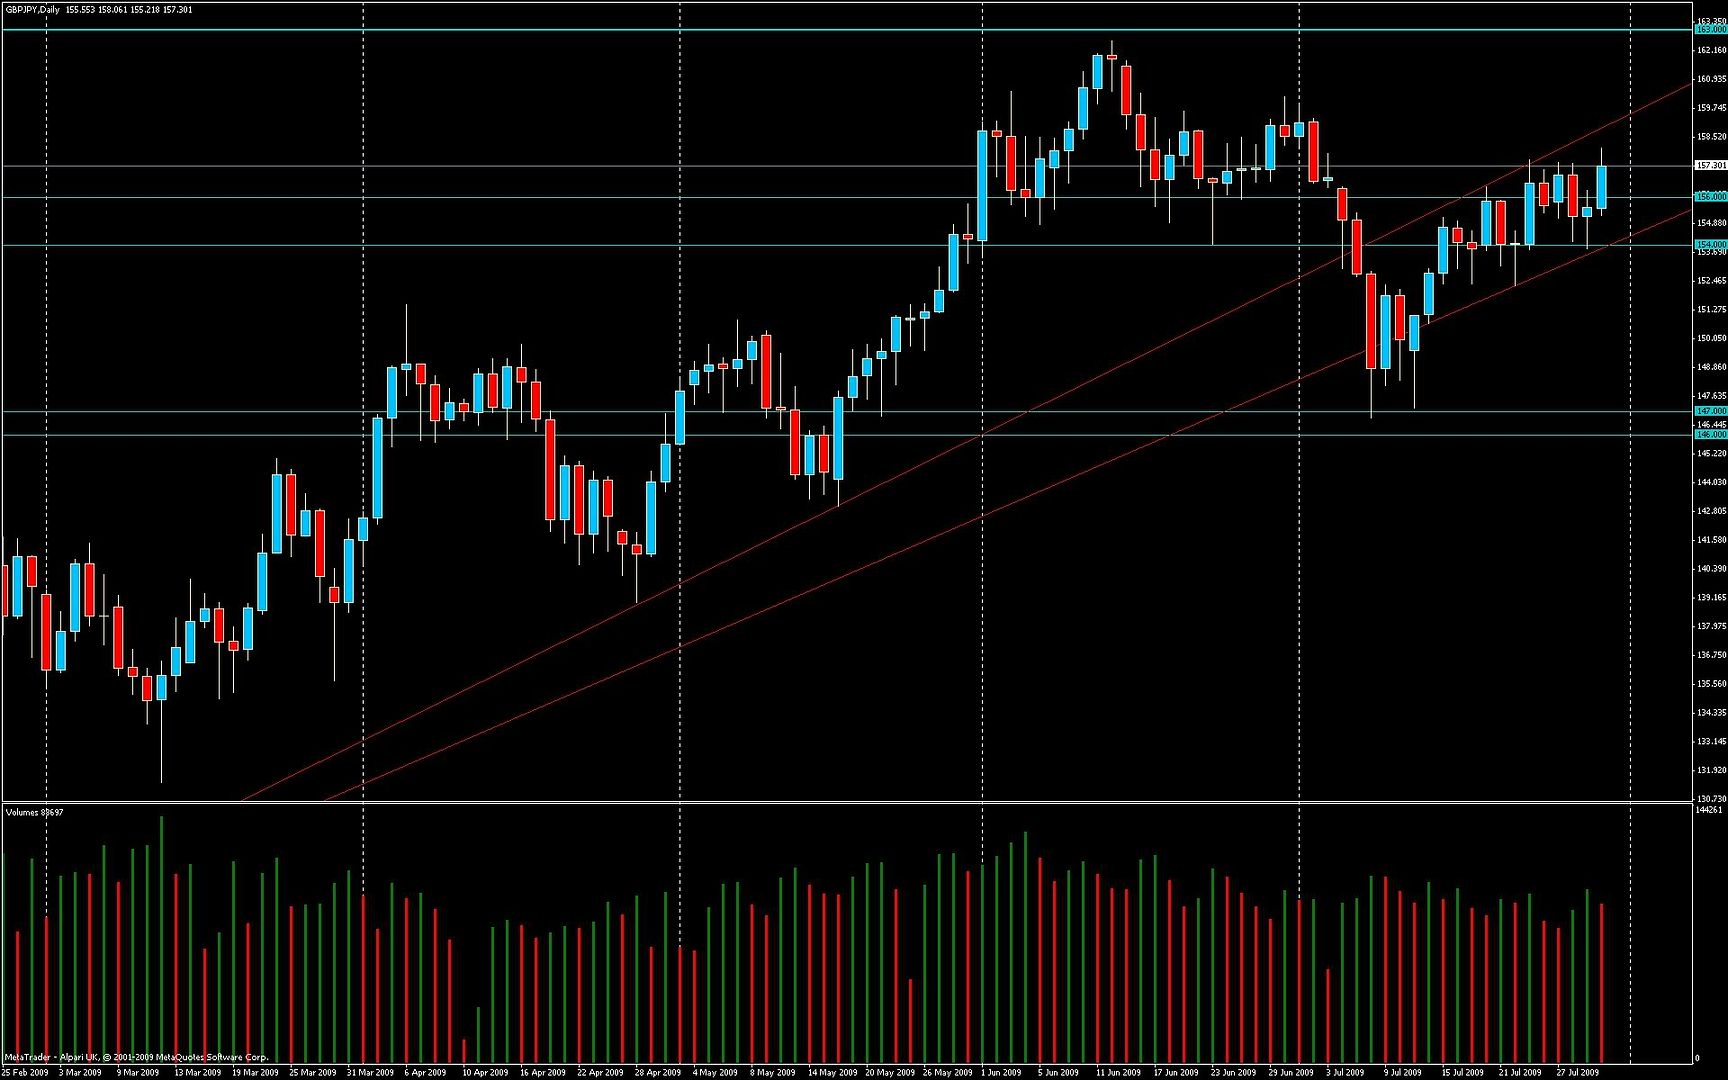
GBPJPY charts:

General candlestick and S/R analysis
Made a new high today and broke out of the 154-156 two-way zone which is now below, likely acting as S. Price stalled just before 158, but as this isn’t a R level there’s no reason why it can’t continue higher.
Next R is the R trendline and after that it’s the R zone starting at 163.

VSA analysis
Smart money has been buying today, but after the first hour of NY price stalled and interest in pushing higher seems to have disappeared.

Bias
Uncertain in the short term, bearish on the medium term

GBPUSD charts:

General candlestick and S/R analysis
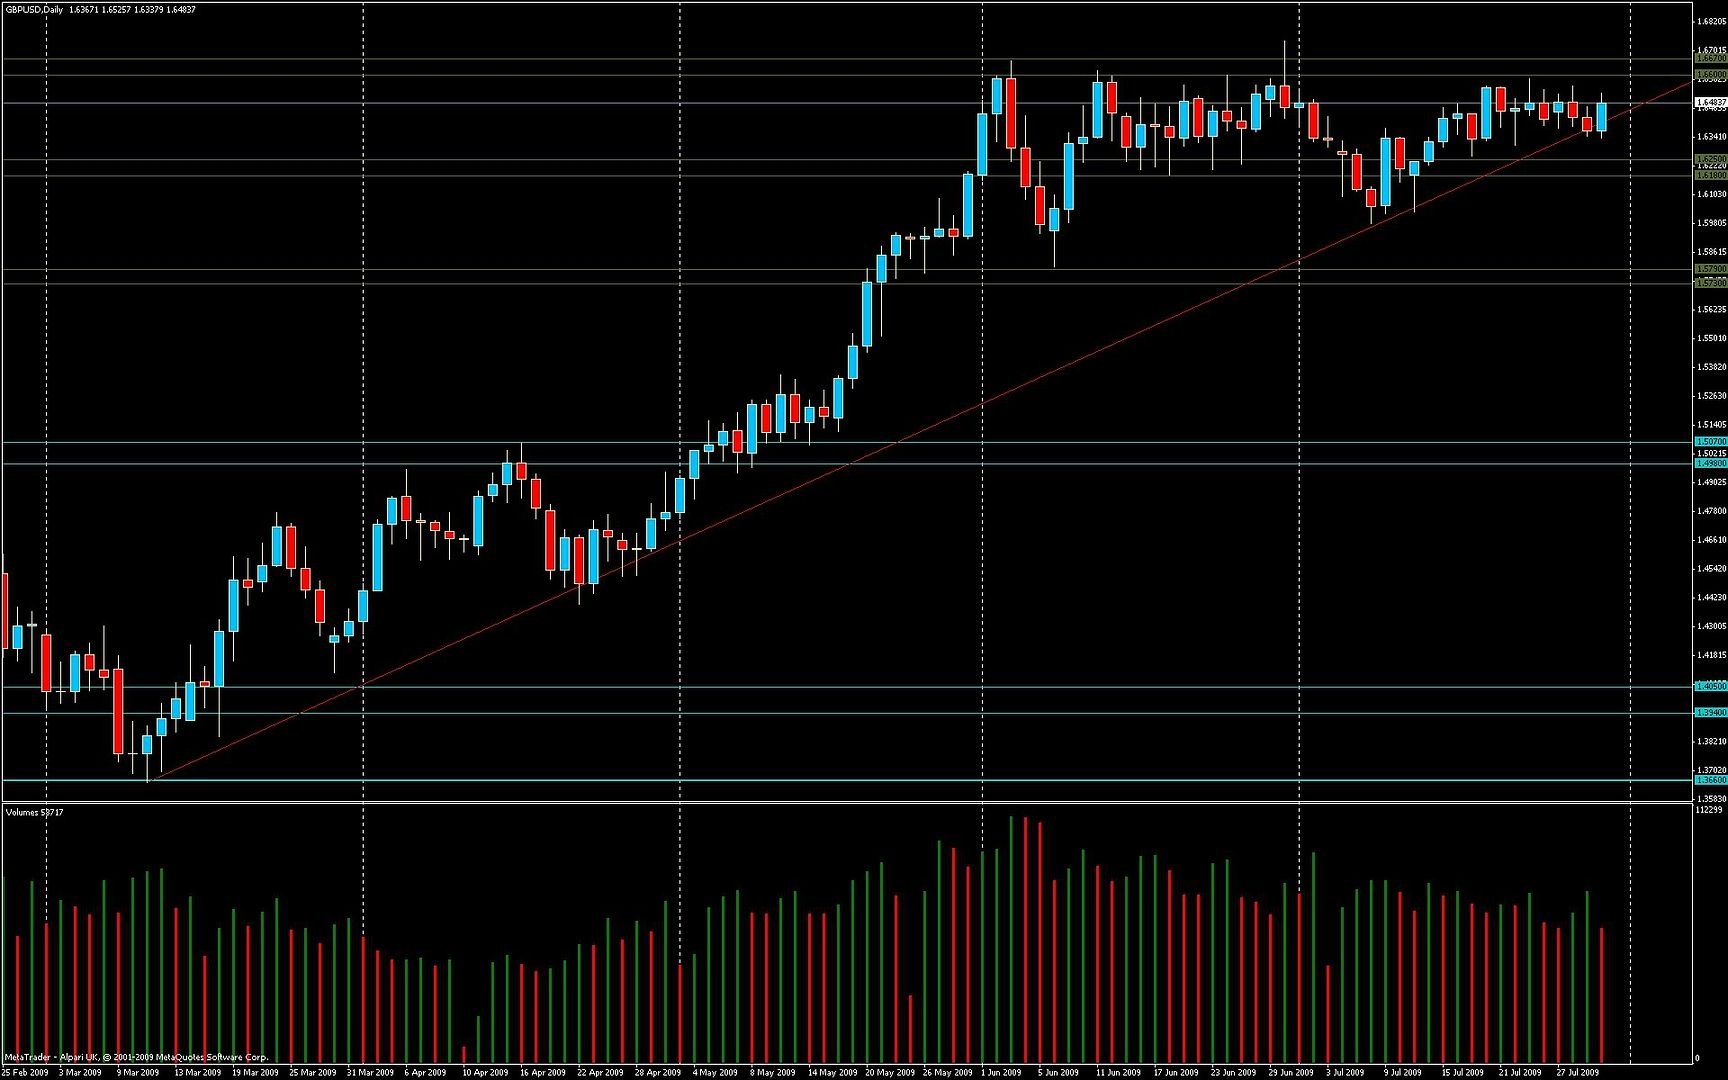
Bullish outside bar today, staying just below 1.65. Broke back above the trendline which I adjusted slightly. Now uncertain whether a solid break ocurred at all. Needs to break above 1.66 to go into bullish mode, or break back below the trendline (for real this time) to show some convincing bearishness

VSA analysis
Price was pushed back above the trendline before London open, on low volume. A few hours into London price stalled and test were made both up and down, but price didn’t go anywhere in particular after this.

Bias
Uncertain

USDJPY charts:

General candlestick and S/R analysis
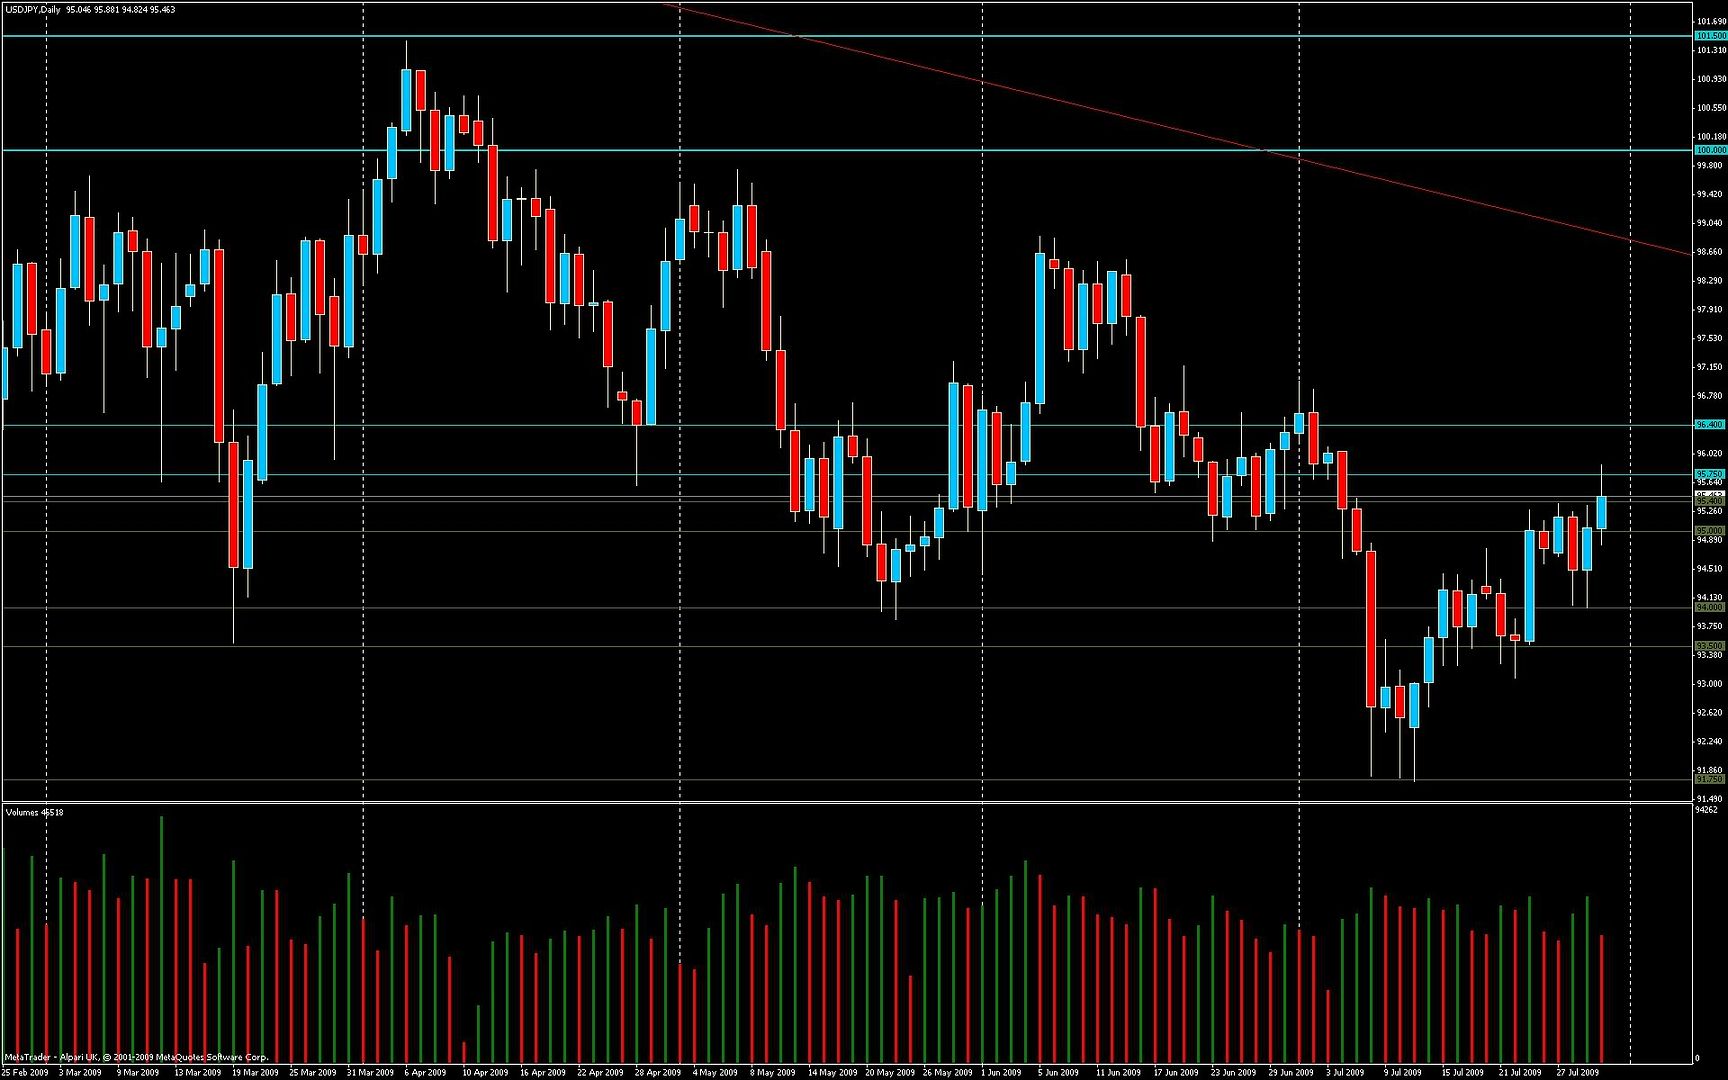
Price broke through the 95.40 R and attacked and failed at the 95.75 R zone today. Since then it dropped back but is finding S at 95.40.

VSA analysis
The push up through 95.40 was supported by high volume and confirmed by the next bar, which was also high volume and tested the remaining bears by pushing price back down to the 95.40 level only to bounce up from it.
That kind of power was not at all seen during the assault on 95.75, which accordingly failed.

Bias
Unclear, depends on which direction price decides to break out from the range 95.40-95.75 it’s moving in.

Projected strongest currency tomorrow USD

Projected weakest currency tomorrow EUR

EURGBP no trade

EURJPY no trade

EURUSD short @ market, SL 1.4320, open target

GBPJPY already active trade

GBPUSD no trade

USDJPY no trade

I clocked myself tonight and I find that this little routine takes closer to two hours every night.

I’m going to keep this up for a few weeks, depending in part on how it goes also.
But if it turns out that this will cause to many late nights and frowns from the better half, I’m considering switching up another time frame to weeklies - that would enable me to just do one thorough analysis during the weekend!

I can almost see the face I would have made if I had heard myself saying that a few months ago. :slight_smile:
If that happens I’ll expand the number of pairs a bit to compensate somewhat for the reduced number of trade setups and I may also increase my risk per trade slightly.

Lately there’s been some talk and praise here on BP on the James16 subject. I came across him several months back, but I was still in the video game/system jumping phase then. I’m going to have a look at his thread, I have a feeling I might learn something.

The GBPJPY trade was just stopped out at SL, bringing the MacGyver Index down to 960.

Tonights analysis is coming later, along with some thoughts and changes. I’m going to be a lot pickier from now on. More on that later.

Lately I’ve started reading through James16 thread over at FF and I’m also checking some of Nial Fullers material over at his site.

I started doing that as I want to simplify my approach a little and focus on the core in Price Action.

Candlestick formations are, like it or not, the basis of my chart understanding. And after having gone through quite the internal struggle over the past months, I’ve accepted S/R as the second core concept in my understanding of the markets.

I still think that VSA is a valid approach, but you can’t clutter your thinking with to many approaches or methods, so I’m placing VSA in the back seat for now.

I’ve done some math and my conclusion from that is that if I can average 5% per month, that’s more than enough. Combining that with a 2.5% risk per trade, means I’d only need one trade for 1:2 Risk:Reward, or two trades for 1:1. That means that trading becomes quite stress free. You have an entire month to find just one or two absolute top quality setups, A+ as the James16 people call them.
The challenge is of course to stay away from over trading, but I think I’m past those mental problems now. I feel quite a lot of patience and the greed is kept in check quite well. Actually I feel that the mental evolution is the area where I’ve done the best so far. Unexpected but nice.

As a result of this, my analyses will change a bit. I’ll save time and energy by just posting select charts, mainly of the few trade setups that I do take and maybe the odd chart between.
Another change is that I’ll be scanning more pairs looking for those picture perfect setups. Like someone wrote (I think it was JohnnyKanoo): A chart is a chart is a chart…

Nor will I try to gauge currency strength from now on either (not that I did it very well anyway…).

Finally, let’s do some dreaming shall we!

1,05^12 = 1,796

That’s 80% account increase in one year thanks to compounding. I’m going to turn thirty pretty soon, let’s imagine I can keep that percent going for ten years:

1,8^10 = 357

What that means is that 1$ turns into 357$ after just ten years. Hmm, let’s imagine that we start with just 1000$ - that becomes 357 000$ in ten years. Sweet.
Let’s say instead we start with 5000$ - that turns into 1 785 000 $.

Well, you get the idea. My point is that many newbies with the get-rich-quick mentality probably think I’m pathetic going for just 5% per month, but as we can see, all it takes is a few years before you can quit your day job and another few years until you’re rich (by my standards at least).

I’m adjusting to these news, so there’s no analysis for tonight. I have many new charts to place S/R lines and zones on…

Hope to be back in business Monday night, but it’s not a promise.

Like the title says, third consecutive loser brings down the MacGyver Index to 940.

Maybe it’s cheating, but since I’m making some changes I’ve decided to reset the index and when we start again I’m going to make it easier to follow by simply starting it at 1000$ and “trade it” as I trade my real account, the balance of which is for me alone to know mwahaha.

I haven’t done anything forex related today, so no news really.

Like Alanis Morisette sings: isn’t it ironic?

Yeah, it is. The first trade I took according to the adjusted methodology is of course turning out nicely instead of crashing and burning like the three trades I posted all did.

It’s good for the old self esteem if nothing else. There’s just one thing that I’m not quite happy with and that’s the R:R ratio which is about 1:1.

I’m going to make it a rule to not take trades that don’t offer at least twice the risk as reward.

Anyway, today was another nice summer day and still vacation so still nothing done really.

As usual there’s a never ending to do-list. Reading through all the James16 material along with Nial Fuller’s is very high on that list along with finishing the adjustment work so I can start building that fortune.

How to enter a trade: just buy or sell, right?

No, there’s more to it than that.

Imagine that we’ve identified a bullish two bar reversal formation with long lower wicks touching a support zone. Clearly this is a setup to go long.

Now we are presented with three options:

  1. Buy now!
  2. Place a pending buy order below the current price and wait for a retracement to get a better entry
  3. Wait for confirmation by placing a pending buy order above the high of the two bars

The first thing that becomes clear is that option 1 is the poorest. It isn’t based on any sort of logic. It’s like impulse shopping - I gotta have that now! Wrong! We tell price what it has to do for us, not the other way around!

Of the two remaining then? Well, both have pros and cons (don’t we just hate that it’s always like that!).

Option 2 has the pro of getting us a substantially better entry price and therefor better risk/reward ratios.
But it also has the cons of: the order might not get hit if price doesn’t retrace at all or doesn’t retrace enough to hit our order.
Another con is that the order might get hit because price has turned and just keeps on heading down and hits the SL. Then again that’s a risk we always face whatever the entry technique.

Option 3 has the pro of forcing price to break above the formation before the order is hit, thereby supposedly reducing the risk that the trade will decide to go the wrong way
The con is that the entry price isn’t that attractive. Often a bar will retrace at least to the 38 fib of the previous bar. With this order placement we miss the chans to get a better price which in turn worsens the risk/reward ratio of the trade.

After doing some thinking, my conclusion is that if we already have identified really high quality setups, we shouldn’t have to use option 2 to get even more confirmation. The probability of the trade should already be so high, that it’s better to use option 3 to try to improve the risk/reward as much as possible.

This is just my opinion though, others will come to other conclusions. Option 2 seems to be a method that Nial Fuller uses a lot, while the James16 people are diverse in this respect.

Now the question then becomes: how big a retrace should we ask for?
If we place our order for a too big retrace target, it will likely be missed and the trade will happen with us standing by the side watching.

This decision will have to be a work in progress, but from the high to the low of the formation, I think that we could probably aim for a 33% retracement.
Of course common sense has to be the guide here, as everywhere else for that matter. Extremely long wicks, previous places where price has bounced etc has to be taken into consideration. 33% is just a mental guideline for me, one that may very well be adjusted as experience grows.

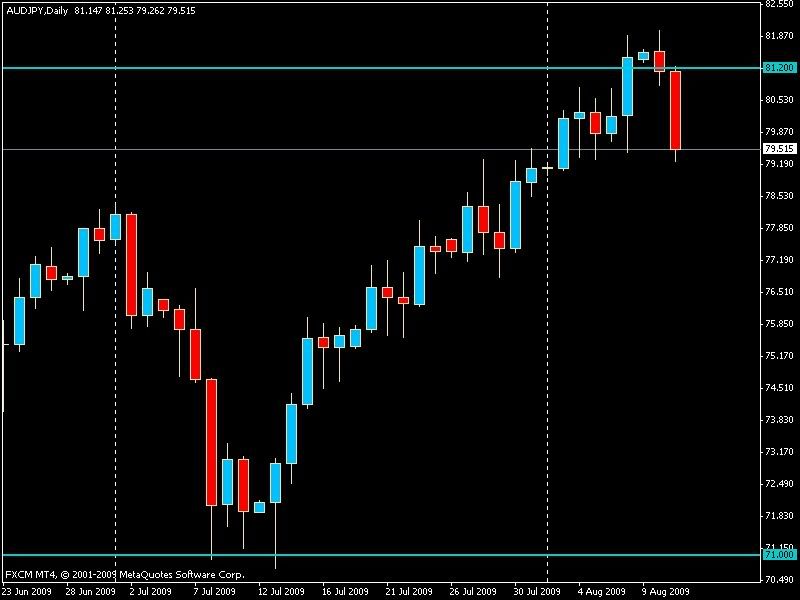
I’m having a look at AUDJPY daily, which seems to forming a nice reversal right at a PPZ (Price Pivot Zone).

Not sure I’m going to trade it, but I might. I’m still placing those PPZ on my charts, it’s slow going as I’m not very focused right now. Lot’s of other stuff to do.

Here’s the chart:

Right now price is sitting at the 79.5 support level and if we do decide to sell we can either place a sell order below at a price where, if hit, we expect the breakout to be for real. 79.2 might be such a price.

The other option is to wait for a retrace and try to enter on a better price. In this case though I feel that the confirmation might be worth the cost.

Reasonably, playing the confirmation style, we should be able to place the SL somewhere above the 79.5 level where it should be safe. Placing it at around 80.0 gives roughly an 80 pip SL.

I’m just thinking with my keyboard here really. I’m not even sure I’ll take the trade. We’ll see. It may develop into a weekly setup if we skip it now. There’s always another trade coming so there’s never any need to chase trades.

Really tired tonight. Takes it’s toll to turn around the sleeping cycle when vacation’s over, especially when you keep staying up late but suddenly have to get up early. Brrr. Not fit for any analysis or chart staring tonight.

I do however have enough energy to mention that the AUDJPY trade (which I did take) was a winner. Didn’t see that coming from me, huh:)

Seriously though, felt good to see that the new and probably final track I’m on is working. Only part I’m not quite happy with is the R:R ratio, but then again 1:1 is OK if the win percentage is high. As experience and confidence grows I’m sure I’ll get better at it.

I’ve been thinking about how to best do it. I want it to be really simple and quick for me and at the same time it needs to be very accurate and detailed to be of any use.

I recently came across a free service on the net where you can supposedly link your MT4 account to the website and have the trades published. Seems like a very clever idea.

I’m thinking about doing it this way, provided that it works since I’m running MT4 on Ubuntu.

That way all the relevant information along with all history would be simple to access and the only work for me would be to enter the trades in my MT4 demo. I’m going to investigate this option.

In other news: I’m still really tired from first the week of work even though it’s been really slow and easy. I’m still going through my 20 charts placing the lines. Maybe I’ll be done this weekend, depends on the weather.

edit: just tested it and it doesn’t seem to work. probably an issue with Ubuntu, which isn’t strange since MT4 is only built for Windows. We’ll see.

I did a lot of stuff during the weekend which caused me to sit down to my charts pretty late on Sunday, with poor mental focus.

Still, as I flipped through them I couldn’t help but notice that almost all the JPY pairs had formed nice two candle reversal formations at valid resistance levels.

I thought about taking a trade, but decided against it as I was yawning and really not in the right state to take such decisions.

Today of course makes you regret staying out, or does it? Well, kind of but not really. I think I made the right decision given the circumstances and what we should all remember is that there’s a million A+ setups waiting for us in the days and weeks to come.

I’m slowly getting on with the S/R placements. Once I finish, beware! Mwahaha :smiley:

Life is a fine balance between right and wrong, yin and yang and so on. In the same way, trading requires finding several balances. Second perhaps only to your account balance is, IMO, the level of risk you decide to subject your account to on every trade.

General advice says to not risk more than somewhere around 1-3% per trade. A common mistake I suspect for beginners (I was guilty of it myself in the beginning) was to risk far too much of the account. Doing that, as we all know, is an excellent way of doing real harm to your account when a few trades in a row go against you. Let’s not even think about the revenge trading that may follow.

When I grew up a bit trading wise, I realized that how much I’m prepared to risk on a trade has to be defined by how much I’m willing to risk losing, not by dreams of how much I can make if my trade is a winner.

I tried the different levels of risk and calculated what would remain of an account after a series of 5, 10, 15 or 20 consecutive losses. Don’t think that could ever happen to you? Think again. At least up to 10 consecutive losses must be expected to occur at some time during the trading career.

This is how it turns out:

1% account risk:
5 losses - 95.0% account balance left
10 losses - 90.4%
15 losses - 86.0%
20 losses - 81.8%

2.5 % account risk:
5 losses - 88.1% account balance left
10 losses - 77.6%
15 losses - 68.4%
20 losses - 60.3%

3 % account risk:
5 losses - 85.8% account balance left
10 losses - 73.7%
15 losses - 63.3%
20 losses - 54.4%

4 % account risk:
5 losses - 81.5% account balance left
10 losses - 66.5%
15 losses - 54.2%
20 losses - 44.2%

5 % account risk:
5 losses - 77.4% account balance left
10 losses - 59.9%
15 losses - 46.3%
20 losses - 35.8%

10 % account risk:
5 losses - 59.0% account balance left
10 losses - 34.9%
15 losses - 20.6%
20 losses - 12.1%

I think these numbers speak for themselves. There’s a very good reason to never risk more than 3% of your account and personally when my account balance gets to a happy place, I’ll definitely move to 1% risk.
During account buildup I feel that 2.5% is a level which I can feel comfortable with.

I think it’s very noteworthy that a string of only 10 consecutive losses with 5% risk reduces your account to only 60% of what it was, and even just five losses in a row melts it to under 80% of original balance.

Leverage isn’t the killer. Poor risk management is.
Very well said!! :slight_smile: :slight_smile:

Excellent post! I stick with the 2%:cool:

Good Information I stole it and reposted on F.F. With a return to here… Hope you don’t mind… Plus always remember If you Lose 50% of your account you have to make up a 100%…

Hope your new ideas are working for you… Ken Lee

No, I don’t mind at all Ken! :slight_smile: