I never said that the upward bias in stocks was due to “inflation”, I said that upward bias is due to the degradation of a currency’s purchasing power, which is caused by the expansion of the money supply (which in turn has its roots in the CB monetary policies).
I also never stated that it was only due to purchasing power degradation, only that this purchasing power degradation is continuously occurring, independent of economic cycles due to the make up of the EuroDollar / global monetary & banking system.
BTW, CPI is not the same thing as “inflation”.
Actually, I answered your question fully, maybe not in the way you expected it though. ![]()
My brain is wired for analysis (my strength), unfortunately it means that I struggle with effective communication, especially on an internet forum, but hopefully my answer here will be clear enough.
Your question was:
I am a full time professional trader and this is how I do it:
In other words, instead of focusing on a strategy, I analyze market movements, trends, conditions, intermarket correlations and more to align my position with where the market is headed (not where it’s at or where it’s been). Strategy doesn’t matter, even random coin flip entries can be profitable.
No, I didn’t overstate the 100%, I stated virtually 100% guaranteed, there are of course outliers and exceptions like public companies going bankrupt. However especially with forex, you can have multiple pullbacks / corrections but eventually a trend will end and reverse.
Nothing in life is guaranteed but the timing and magnitude of a reversal can be forecasted with a high enough accuracy to be very profitable.
Please accept my apologies for being blunt here, I’m not trying to insult, but this is impossible for you.
My friend, I do this for a living and I (as well as other pros I know) can easily distinguish a pullback / correction from a reversal.
For those that are interested, here are 3 examples that I posted on this forum.
Example #1
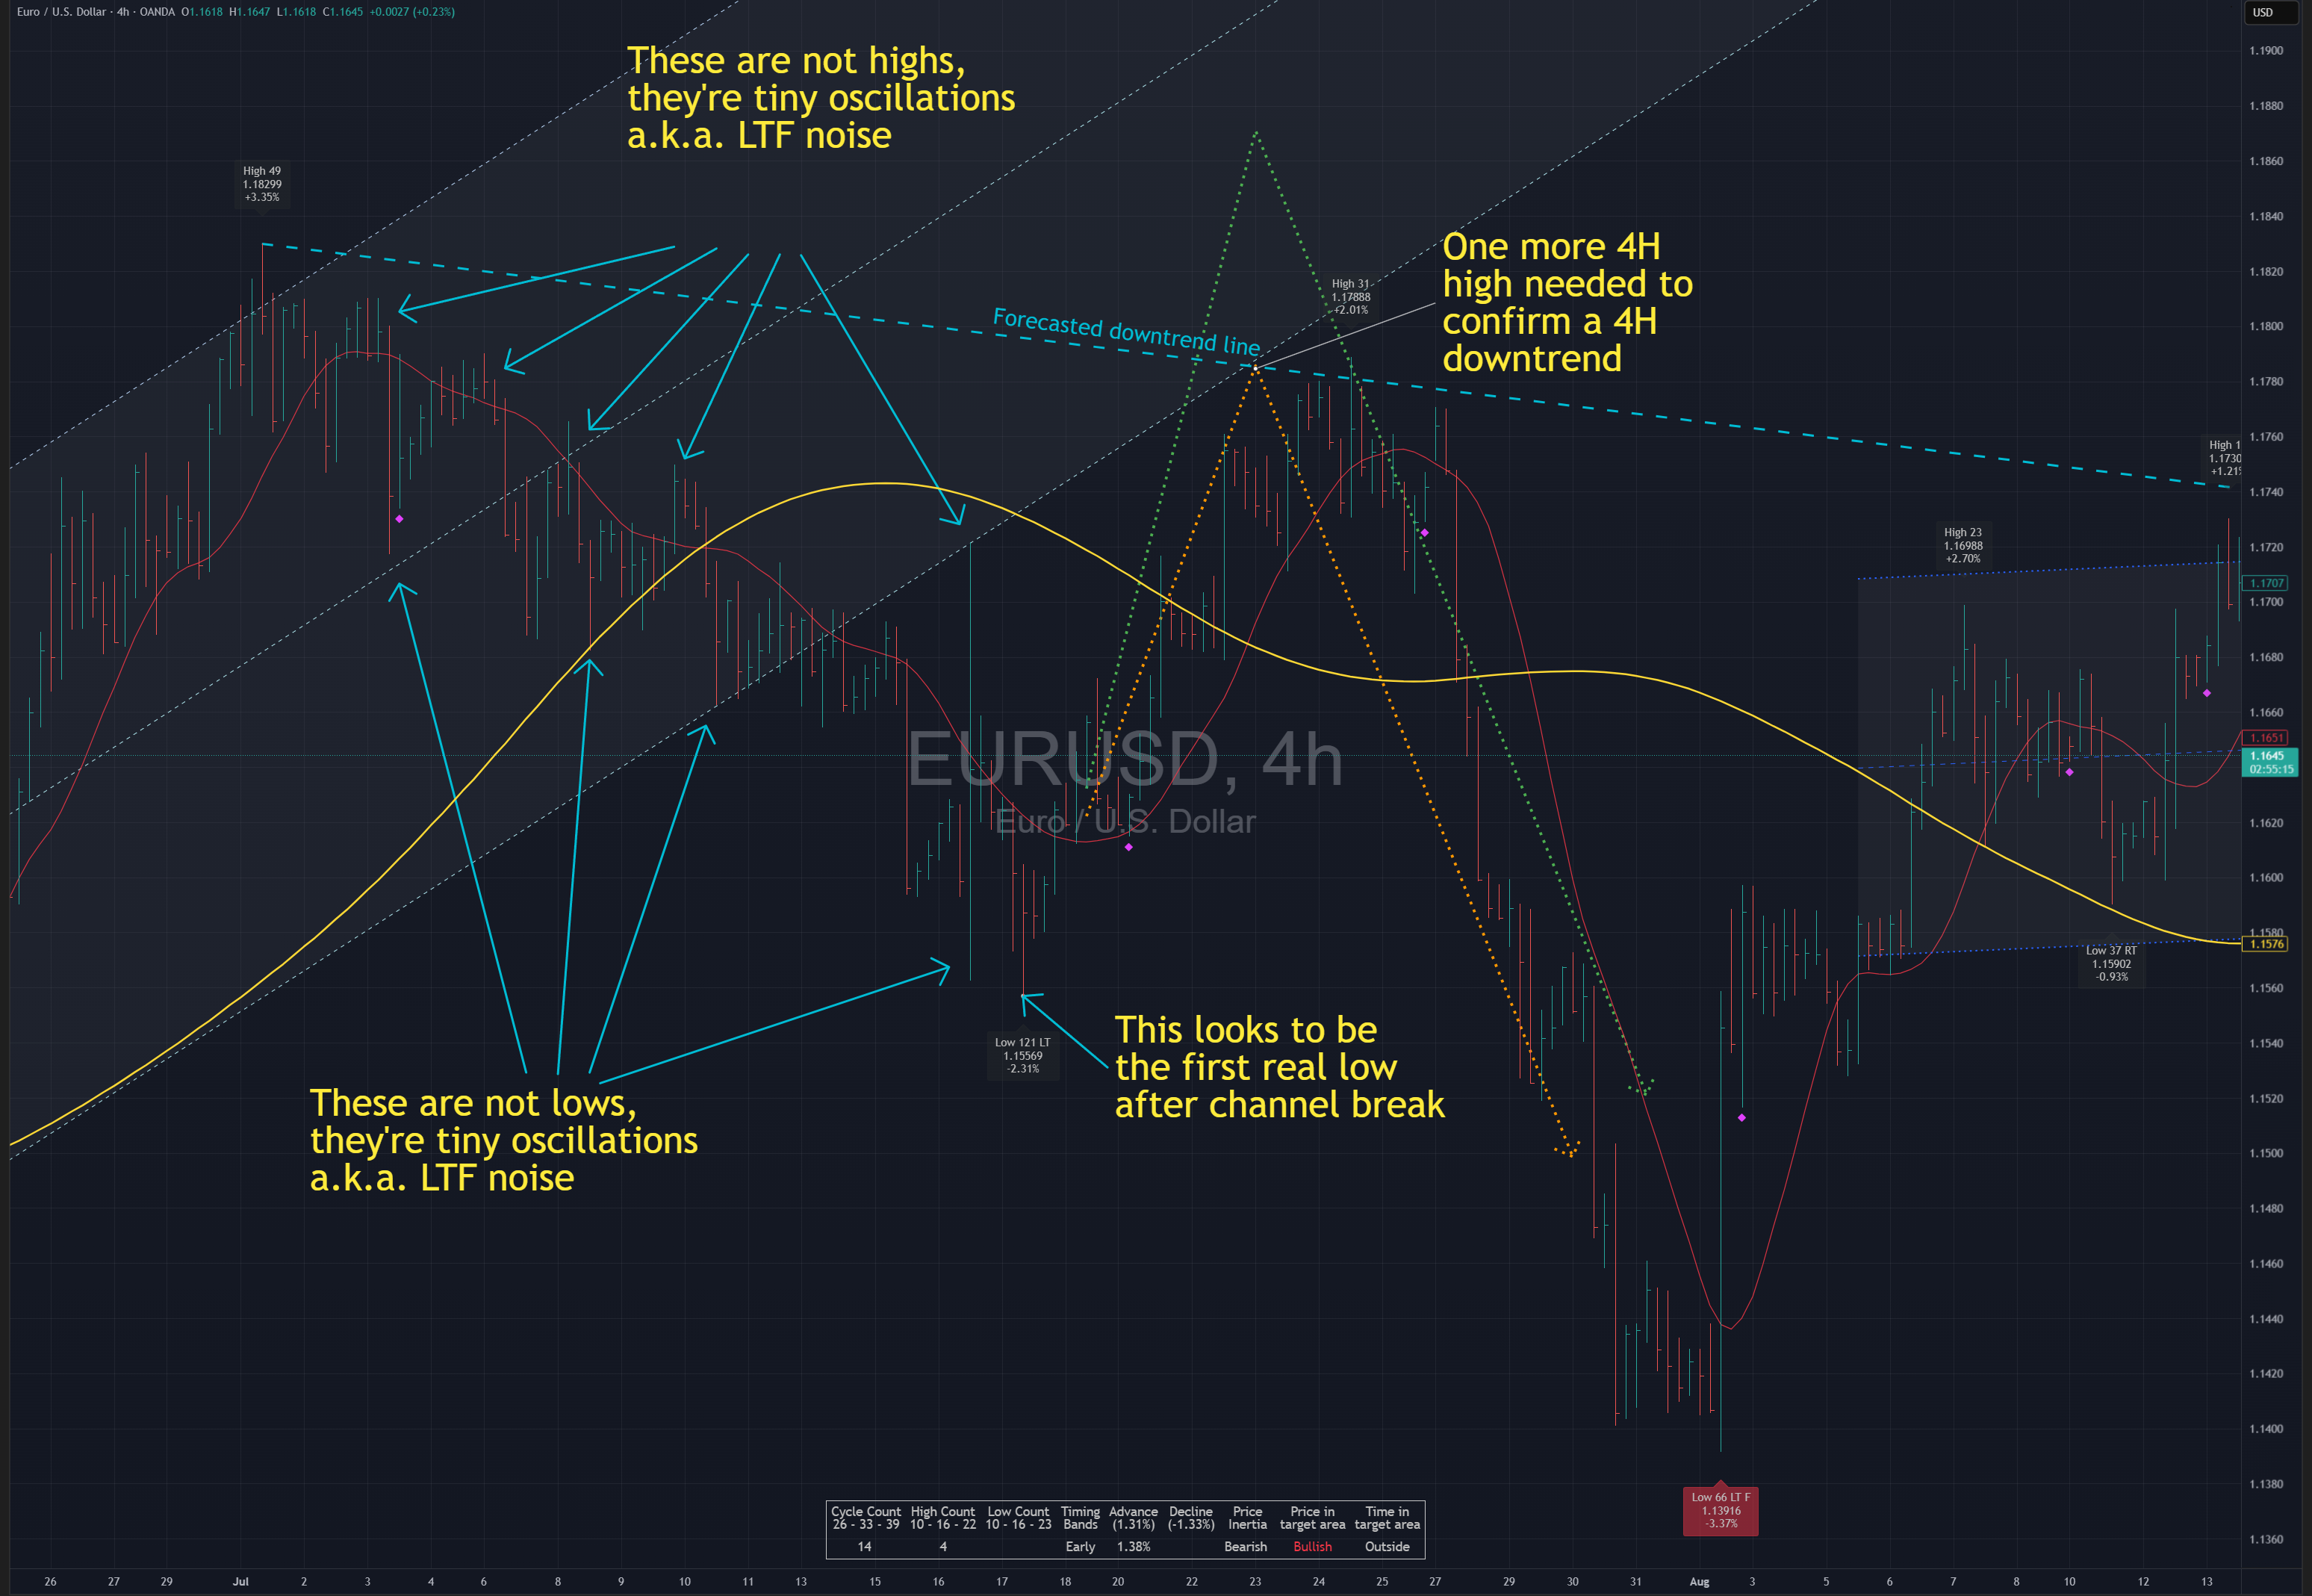
This one I called out in real time and clearly show the difference between pullbacks / corrections (labeled LTF noise / “tiny oscillations”) and reversals. There are also follow up replies where I literally map out where I thought price was heading and follow up with where price actually went.
The last thing I wrote in that thread was:
And price made a new low on the 4H TF @ 1.13916 (below 1.1550), before turning up again ![]()
Example #2
Example #3
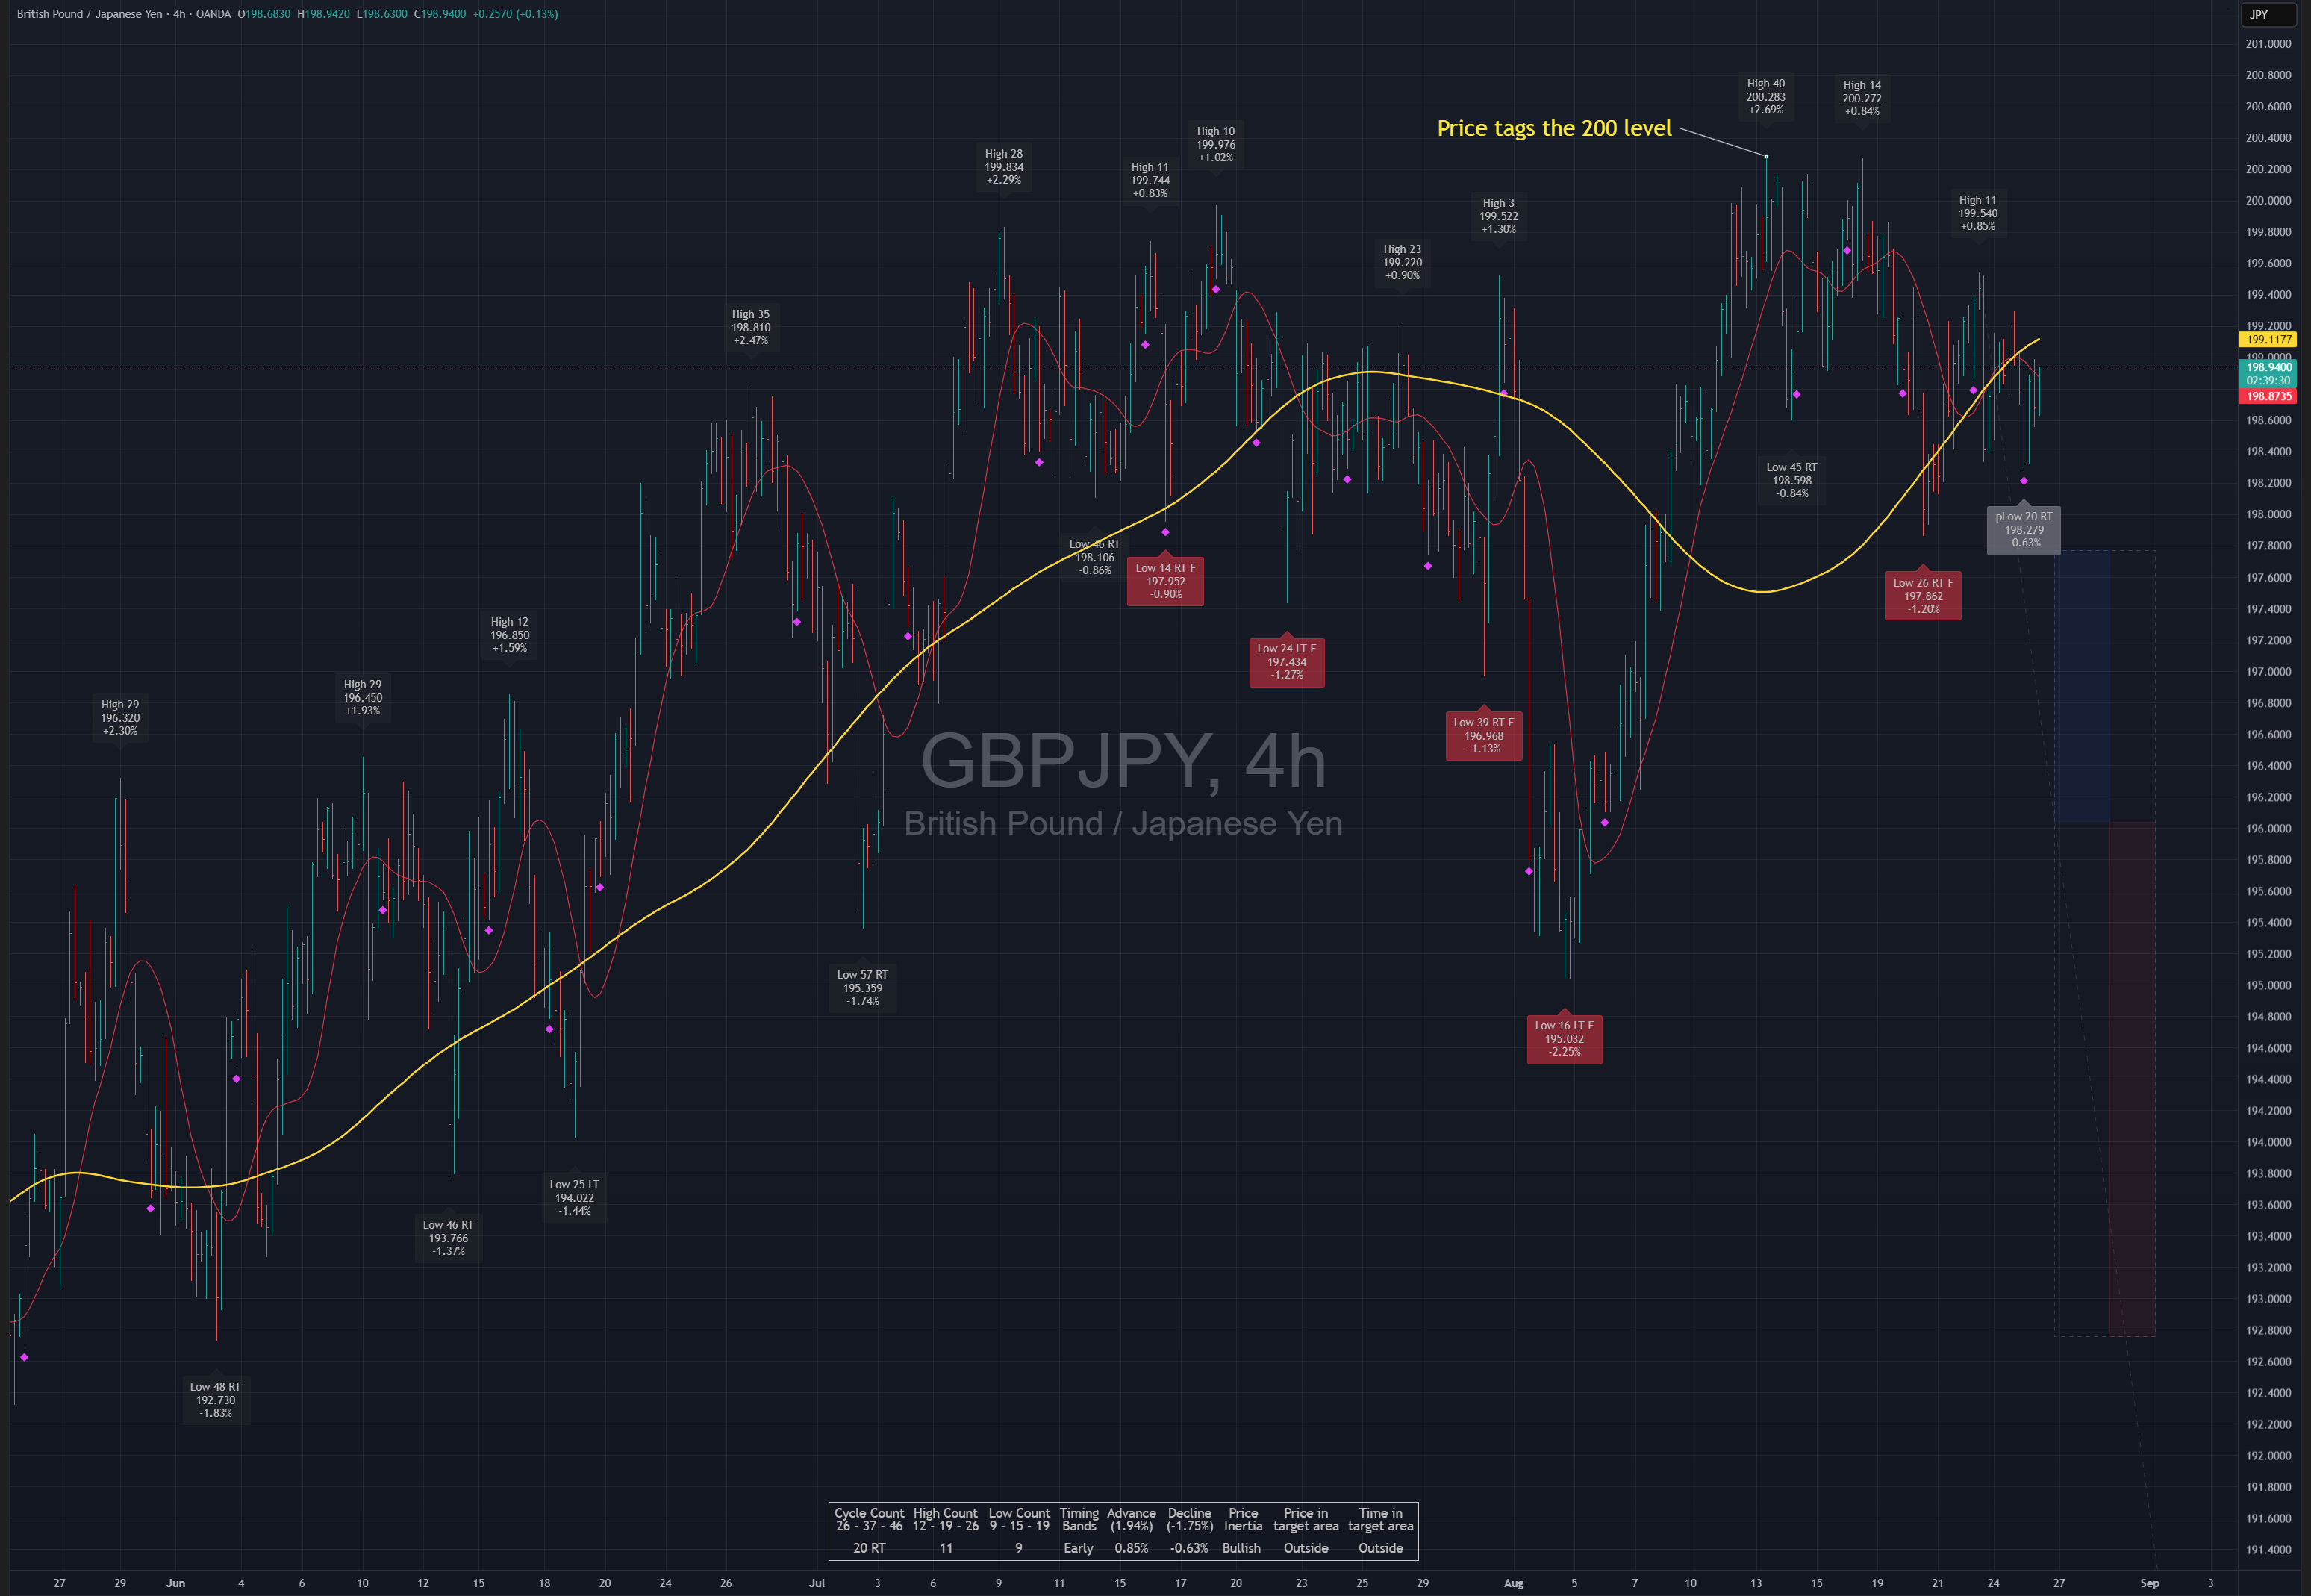
I made this post April 10th, 2025 ![]()
And 18 weeks later (longer than the forecasted 10 to 14 weeks) on August 13th 2025, price tagged the 200 level ![]()