Hello all traders!
I started this forum for all aspiring traders who are looking for quality training that covers basic to advanced Price Action Trading and explains the details of our high probability Price Action Algo Trading System.
You can refer to the Babypips trade journals section and find the "Price Action Algo Trading System Journals”, which includes an overview of how the PAAT system works and examples of daily trades.
The PAAT is based on a simplified/practical dynamic price action view of the market and I will train you step-by-step through deliberate practice lessons with drills to gain the necessary skills to read/interpret price charts accurately and quickly.
Each lesson will be followed by some examples of our 760 Smart Drills presented in the PAAT Premium course, which will help to turn your acquired knowledge into essential trading skills. You have to take each lesson in the right sequence and then Forward Test each Smart Drill using real market data many times, till it becomes your second nature.
We will cover all of the following topics under 33 workshops:
Workshop 1: Price Turning Points - Swing Low (SL) & Swing High (SH)
Workshop 2: Range, Drawing Range Line, Identifying/Update Range lines in live market
Workshop 3: Dynamic Support (DS) line & Dynamic Resistance (DR)
Workshop 4: Dynamic Channels (DC)
Workshop 5: Patterns
Workshop 6: Relationship between Pattern and Range
Workshop 7: Trend Channel Break Out
Workshop 8: Sideway Channel Break Out
Workshop 9: Sideway and Trend Channel Break Out - Advance
Workshop 10:Momentum Range Analysis (MRA)
Workshop 11: Momentum Slope Analysis (MSA)
Workshop 12: Combining Momentum Range & Slope Analysis
Workshop 13: Identifying Structural Swings
Workshop 14: Drawing Structural Channels
Workshop 15: Combining Structural Channels and Trading Channels
Workshop 16: Trading Rule - Future Structure Direction
Workshop 17: Trading Rule - Future Trading Channels Direction
Workshop 18: Combining Future Structure Direction & Future Trading Channels Direction
Workshop 19: High Probability Trade Area
Workshop 20: 4 Groups Winners and Losers
Workshop 21: Setup T
Workshop 22: Overbought/Oversold Areas
Workshop 23: Stop Loss
Workshop 24: Targets
Workshop 25: R/R and Enter
Workshop 26: Trade Risk Evaluation
Workshop 27: Exit Strategies
Workshop 28: Pattern Filter
Workshop 29: Momentum Filter
Workshop 30: High Probability Trade Area Filter
Workshop 31: OB/OS Zones Filter
Workshop 32: R/R Ratio Filter
Workshop 33: Overview of Workshops 1 to 33 Module
This will help you to analyze the market structure properly in real-time and find high probability trading area opportunities during the trading sessions, which is essential to your consistency as a profitable trader.
8 Likes
Hello all traders!
Before we start the first lesson of Workshop 1: Price Turning Points, let’s have a look at the section on the Price Psychology Action, which explains What drives the market and Price Action moves?
The markets are an open auction environment evolved to facilitate trading. Market participants are constantly betting against each other to determine the fair value price of a financial instrument. This creates buying or selling pressure which subsequently moves the price of traded financial instruments.
4 Likes
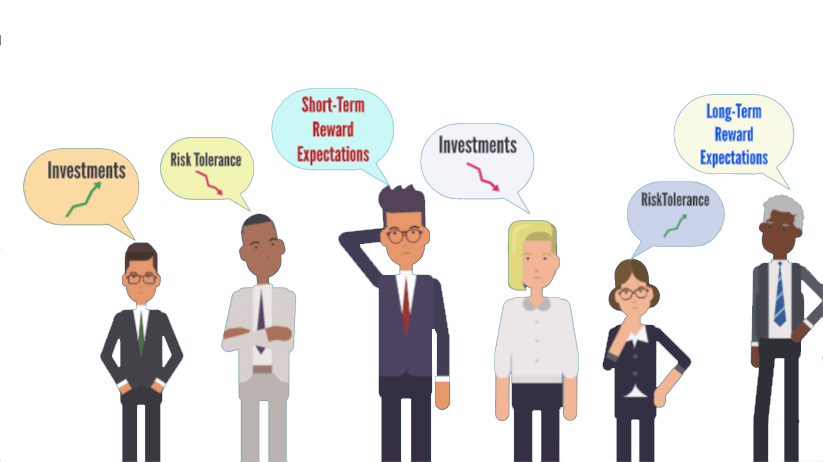
The cumulative decisions of these collective humans determine the market price’s direction. Since market participants have various degrees of investments, risk tolerance, and short- to long-term reward expectations and sentiments, this makes the price direction unpredictable!
4 Likes
As a result, price movements in the market exhibit a wave shape pattern. Each wave cycle is repeated throughout different time frames,

4 Likes
This is similar to fractal patterns seen in nature.

4 Likes
Traders put their money at risk by betting the price goes in a specific direction, hoping that the price would move in their benefit and they make make a profit. The profit of some traders caused by a price movement in one direction is paid by the loss of others, and this is phenomenon is known as a zero-sum game. Therefore, amongst market participants, there is a constant desire to profit and constant fear of losing money.
4 Likes
This crowd psychology makes the market a live, emotional entity and its mood represents the collective emotional feelings of all its participants. As a result, the market goes through cycles of greed when the price is rising, and a cycle of fear when the price is falling. This concept of market psychology is essential for traders to understand so they can execute their trading plans with confidence and accuracy.
4 Likes
Now with this summary, if we want to answer the question of what drives the market and Price Action moves, the simple answer is that: Decision of traders in form of buy/Sell with the hope to make money and not to lose!
The excessive flow of orders on one side creates buying or selling pressure that at the open auction environment of the market, forces the price of the instrument to go up or down.
But with the money at stake and excessive desire in form of FEAR not to lose, or excessive desire to in form of GREED to make money, emotional pressures build up and many traders let this get the best of their logical decisions.
4 Likes
Hi Everyone,
We start our first lesson of Module 1, workshop 1, which covers the topic of Price Turning Points.
As mentioned earlier, the markets are an open auction environment evolved to facilitate trading. Market participants are constantly betting against each other to determine the fair value price of a financial instrument. This creates buying or selling pressure, which subsequently moves the price of traded financial instruments. The cumulative decisions of these collective human beings determine the market’s price direction.
Since market participants have various degrees of investments, risk tolerance, and short- to long-term reward expectations and sentiments, this makes the price movement to exhibit a wave shape pattern and each wave cycle is repeated throughout different time frames, similar to fractal patterns seen in nature.

5 Likes
This crowd psychology makes the market a live emotional entity and its mood represents the collective emotional feelings of all its participants. The market participants enter into the greed phase when the price is rising, and the fear phase when the price is falling. Due to a lack of training, many aspiring traders are not prepared to recognize and respond properly to the changes in phase of the market at these turning points. The emotional-cognitive mismatches add up to the issue!
5 Likes
Price turning points define advanced price action, market structure, high probability trading setups, and the best price entry areas, which will all be discussed in detail in upcoming modules.
5 Likes
Swing High and Swing Low:
If we look at one single wave of price, also known as a swing, it is made of two turning points. The price that is going up reaches its highest level at a PEAK, before reversing down. The highest reversal turning point on the chart is defined as ‘Swing High’, which is abbreviated as SH.

6 Likes
The price that is going down reaches its lowest level at a TROUGH, before reversing up. The lowest reversal turning point on the chart is defined as ‘Swing Low’, which is abbreviated as SL.

6 Likes
Use These Three Simple Steps to Identify any Standard Swing High Quickly:
1- Find the Peak candle.
The Peak candle is the one that has the highest high amongst all other candles. Then mark the Peak candle, as Zero.
2- Mark the 2 candles before the zero candle as -1, and -2. And after zero candle as +1 and +2 accordingly.
3- If the ‘High’ of these four candles are sequentially lower than the High of zero Peak candle, you identified a standard Swing High (SH).
5 Likes
Use These Three Simple Steps to Identify any Standard Swing Low Quickly:
1- Find the TROUGH candle.
The TROUGH candle is the one that has the Lowest Low amongst all other candles. Then mark the TROUGH candle, as Zero.
2- Mark the 2 candles before the zero candle as -1 and -2.
And after zero candle as +1 and +2 accordingly.
3- If the ‘Low’ of these four candles are sequentially higher than the Low of zero Trough candle, you identified a standard Swing Low.

5 Likes
Practice Drills 1: Workshop 1: Price Turning Points - Swing Low (SL) & Swing High (SH)
To practice Identifying the standard SH, please watch from the 2.05 min and for SL from 3.49 min of the below video:
How To Identify standard Swing Highs & Swing Lows
5 Likes
Practice Drills 2: Workshop 1: Price Turning Points - Swing Low (SL) & Swing High (SH)
To practice Identifying the standard SH, please watch this example of smart drill first:
How To Identify standard Swing Highs & Swing Lows - Forward Test example
Then forward test with real market data the same concept at least 10 times using any instrument chart. Hope this helps you to master this skill and please let me know if you have any questions.
4 Likes
Hello all traders!
In the first lesson of “Workshop 1: Price Turning Points”, you have learned how to identify the Standard SH & SL. We will continue our discussion on “How to identify Non-standard Swing Highs & Swing Lows”.
I have already created an animated lesson on this topic and please refer to the following link to view the clip that explains the process in detail:
How to identify Non-standard Swing Highs & Swing Lows
Please watch this lesson with the examples provided and let me know if you have any questions on this topic.
6 Likes
Practice Drills 3: Workshop 1: Price Turning Points - Non-standard Swing Low (SL) & Swing High (SH)
To practice Identifying the Non-standard SH, please watch from the 1.13 min, and for Non-standard SL from 2.43 min of the below video:
How to identify Non-standard Swing Highs & Swing Lows
4 Likes
Practice Drills 4: Workshop 1: Price Turning Points - Non-standard Swing Low (SL) & Swing High (SH)
To practice Identifying the standard SH, please watch this example of smart drill first:
How To Identify Non-standard SH & SL- Example of Smart Drills
Then forward test with real market data the same concept at least 10 times using any instrument chart. Hope this helps you to master this skill and please let me know if you have any questions.
5 Likes