Price Action Algo Trading (PAAT) System- Basic to advanced Lessons with Practice Drills

Workshop 7 - Sideways Channel Breakout to Sideways

In this workshop, we discuss the concept of Sideways Channel breakout that often leads to the formation of another Sideways pattern. This helps you to analyze Sideways Channel Breakout to a new emerging pattern and categorize the new pattern on the price charts instantly.

I have already created a video on this topic, so please refer to the following link to view this clip and let me know if you have any questions:

7 Likes

Practice Drills 12: Workshop 7 - Sideways Channel Breakout to Sideways

To practice recognizing when a sideways channel breakout happens, which often leads to the formation of another sideways pattern, please watch this example of a smart drill first:

Then forward test with real market data the same concept at least 10 times using any instrument chart. Hope this helps you to master this skill and please let me know if you have any questions.

7 Likes

Workshop 7 - Sideways Channel Breakout to a Trend

In this workshop, we discuss the concept of Sideways Channel breakout that leads to the formation of a trending pattern. This helps you to analyze Sideways Channel Breakout to a new emerging trending pattern, so you will not miss the beginning of a trend.

I have already created a video on this topic, so please refer to the following link to view this clip and let me know if you have any questions:

6 Likes

Practice Drills 13: Workshop 7 - Sideways Channel Breakout to a Trend

To practice recognizing when a sideways channel breakout leads to the formation of an emerging trend pattern, please watch this example of a smart drill first:

Then forward test with real market data the same concept at least 10 times using any instrument chart. Hope this helps you to master this skill and please let me know if you have any questions.

6 Likes

Workshop 8: Trend Channel Breakout - Continuation of the Trend

In this workshop, we discuss the concept of Trend Channel breakout that leads to the continuation of the same trending pattern. This helps you to analyze the Trend Channel Breakout that is temporary and leads often to the continuation of the Trend.

When you update the dynamic channel in an uptrend pattern and see the price breaks the dynamic resistant line, you often see that the new pattern has higher Swing highs and higher swing lows, which indicates the continuation of the uptrend pattern.

When you update the dynamic channel in a downtrend pattern and see the price breaks the dynamic support line, you often see that the new pattern has lower Swing Lows and lower Swing Highs, which indicates the continuation of the downtrend pattern.

I have already created a video on this topic, so please refer to the following link to view this clip and let me know if you have any questions:

6 Likes

Practice Drills 14: Workshop 8 - Trend Channel Breakout - Continuation of the Trend

To practice recognizing when a trend channel breakout leads to the continuation of the same trending pattern, please watch this example of a smart drill first:

Then forward test with real market data the same concept at least 10 times using any instrument chart. Hope this helps you to master this skill and please let me know if you have any questions.

6 Likes

Workshop 8: Trend Channel Breakout - Conversion to Sideways Pattern

In this lesson of workshop 8, you will learn how to recognize the Trend pattern breakout and interpret its conversion to another Sideways pattern.

When you update the dynamic channel in an uptrend pattern and see the price breaks the dynamic support line, you may see that the new pattern has a higher swing high but a lower swing low, which indicates the conversion to a sideways pattern.

When you update the dynamic channel in a downtrend pattern and see the price breaks the dynamic resistance line, you may see that the new pattern has a lower swing low but a higher swing high, which indicates the conversion to a sideways pattern.

I have already created a video on this topic with an example of Smart Drills, so please refer to the following link to view this clip and let me know if you have any questions:

6 Likes

Practice Drills 15: Workshop 8 - Trend Channel Breakout - Conversion to Sideways Pattern

To practice recognizing the Trend pattern breakout and its conversion to another Sideways pattern, please watch from the 1.42 min of this recorded video clip of a Smart Drill:

Then forward test with real market data the same concept at least 10 times using any instrument chart. Hope this helps you to master this skill and please let me know if you have any questions.

6 Likes

Workshop 9: Sideways and Trend Channel Break Out - Advance

In this lesson of workshop 9, you will learn how to recognize the interconversion of Sideways and Trend Patterns using this simple 2-step process:

In Step 1, Find and compare the last 2 swing highs and 2 swing lows, and determine the current type of “Pattern”.

In step 2, Look for a new turning point, and update the new Dynamic Channel.

You keep determining the type of “Pattern and update the new DC. You will see how uptrend patterns are converted to sideways patterns, and sideways are transitioned to a new sideways pattern, or converted to a new downtrend/uptrend pattern.

I have already created a video on this topic with an example of Smart Drills, so please refer to the following link to view this clip and let me know if you have any questions:

8 Likes

Practice Drills 16: Workshop 9: Sideways and Trend Channel Break Out - Advance

To practice recognizing the interconversion of Sideways and Trend Patterns using the 2-step process of determining the type of Pattern and updating the new DC, please watch this recorded video clip of a Smart Drill:

Then forward test with real market data the same concept at least 10 times using any instrument chart. Hope this helps you to master this skill and please let me know if you have any questions.

8 Likes

Workshop 10: Momentum Range Analysis (MRA)

In workshops 10 and 11, you will become familiar with the concept of Momentum:

Momentum refers to the Rate of Change in a Security’s Price. We use momentum to analyze the Strength and Weaknesses of the “Trend” Pattern, which provides an early indication of the beginning or end of the trend. Therefore, in Sideways patterns, the momentum analysis is not applicable and is only used when the dynamic channel shows “Trending” Patterns.

We simplified our price action Momentum Analysis and use 2 methods of Range analysis and Slope analysis. We use both methods and in this lesson, you will learn how to use Momentum Range Analysis to analyze the Strength and Weaknesses of “Trend” Patterns.

I have already created a video on this topic, so please refer to the following link to view this clip and let me know if you have any questions:

8 Likes

Practice Drills 17: Workshop 10: Momentum Range Analysis (MRA)

To practice the application of Momentum Range Analysis to analyze the strength of a trend pattern, please watch this recorded video clip of a Smart Drill:

Then forward test with real market data the same concept at least 10 times using any instrument chart. Hope this helps you to master this skill and please let me know if you have any questions.

8 Likes

Workshop 10: Momentum Range Analysis Application

In this lesson of workshop 10, you will learn how to use the Momentum Range Analysis effectively to analyze the strength and weakness of a “Trend”, so you can get an early indication of when a trend starts or when it ends.

I have already created a video on this topic, so please refer to the following link to view this clip and let me know if you have any questions:

6 Likes

Practice Drills 18: Workshop 10: Momentum Range Analysis Application

To practice the application of Momentum Range Analysis to analyze the strength of a trend pattern, please watch this recorded video clip of a Smart Drill:

Then forward test with real market data the same concept at least 10 times using any instrument chart. Hope this helps you to master this skill and please let me know if you have any questions.

6 Likes

Workshop 11: Momentum Slope Analysis (MSA)

In this lesson of workshop 11, you will learn how to use the Momentum Slope Analysis (MSA) effectively to analyze the strength and weakness of a “Trend”, so you can get an early indication of when a trend starts or when it ends.

To analyze the strength and weaknesses of an established uptrend, we compare the slope of the last two dynamic support lines. To analyze the strength and weaknesses of an established downtrend, we compare the slope of the last two dynamic resistance lines.

No change in slope means the strength of the trend is constant and not changed. An increase in the slope means the strength of the trend is increasing. A decrease in the slope means the strength of the trend is decreasing, an early indication of the end of a trend.

I have already created a video on this topic, so please refer to the following link to view this clip and let me know if you have any questions:

5 Likes

Practice Drills 19: Workshop 11: Momentum Slope Analysis

To understand the concept of Momentum Slope Analysis to analyze the strength of a trend pattern, please watch this example of a smart drill.

Then forward test with real market data the same concept at least 10 times using any instrument chart. Hope this helps you to master this skill and please let me know if you have any questions.

5 Likes

Workshop 12: Combining Momentum Range & Slope Analysis

As we discussed, we simplified our price action Momentum Analysis into 2 methods, and you have learned the application of each method of momentum Range and Slope analysis separately.

In this lesson of workshop 12, we will review the combined application of both methods of Momentum Range and Slope analysis. You will see how both methods work often complementary, to provide an early indication of the Strength, and also the Weaknesses of an established trend.

I have already created a video on this topic, so please refer to the following link to view this clip and let me know if you have any questions:

5 Likes

Lesson 2: Review of Workshops 1 to 11

In this lesson of Chapter 12, we will provide an overview of all previous chapters by analyzing price charts in a forward-test manner, identifying dynamic channel patterns, and analyzing the strength and weaknesses of developing trends.

The phrase “The Trend is Your Friend Until It Ends” is a trading adage that emphasizes the importance of following market trends. When a trend is in place, it is often more profitable to trade in the direction of the trend than to go against it. However, it is important to remember that trends do not last forever, and they can end suddenly. This is why it is important to be vigilant and to identify potential trend reversals early.

The skills you have acquired so far are essential for understanding and implementing the first two algorithms of the trend-following Setup T in the Price Action Algo Trading System. The Setup T consists of five decision-making algorithms, and we will practice the first two algorithms to execute them in the correct sequence and make informed decisions.

The first two decision-making algorithms of the Setup T are exactly based on what you have learned so far to identify trending patterns and analyze their strength and can be summarized as below:

Algo 1: Analysis of Patterns: This algorithm verifies whether the observed pattern on the chart exhibits a trending behavior.

Algo 2: Analysis of Momentum: This algorithm ensures that the identified trend is strong and not ending due to a loss of momentum.

The first two algorithms ensure that you only trade strong trending patterns and avoid trading when the trend is ending and transitioning into a sideways pattern.

|624x353.1978329908463

As you have learned and practiced, in the first step, you look for a new SH or SL, update the new dynamic channel, and determine the type of pattern. Then, the first algorithm condition checks if your current pattern is trending, as illustrated below:

|624x353.8712871287129

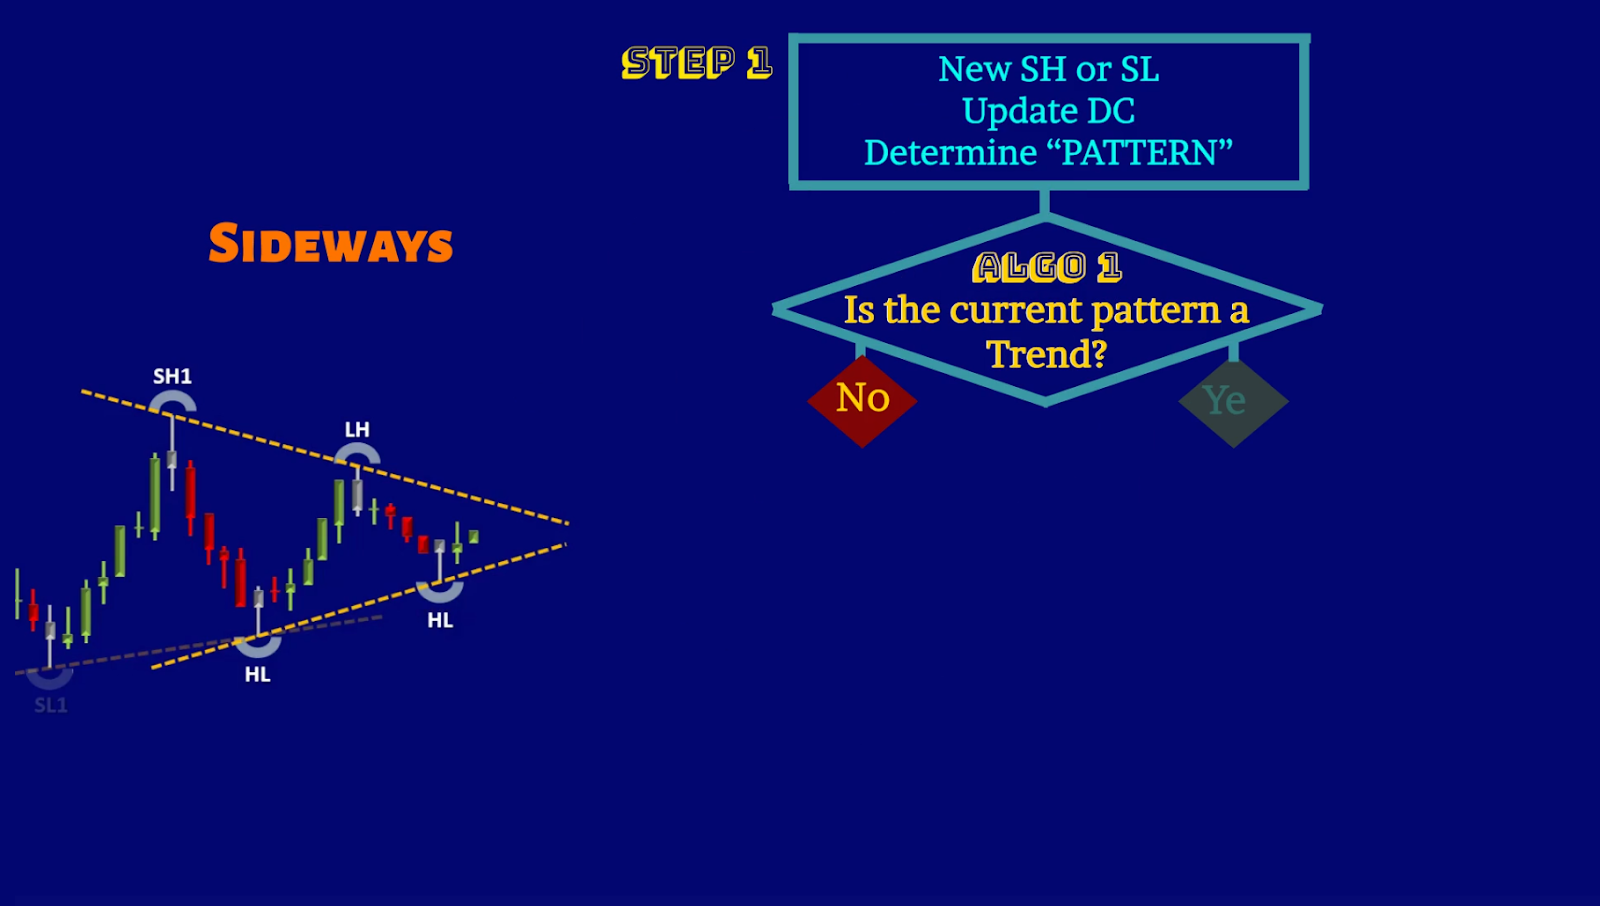
If the answer to the first algorithm condition is “No,” step 1 has to be repeated, as shown below:

|624x353.5313531353135

So, you keep updating the dynamic channel with every new SL or SH, until the new trend pattern is formed, as you see in the below price chart:

|624x353.5313531353135

If the answer to the condition of the first algorithm is “Yes,” it activates Step 2, which involves momentum analysis using MRA and MSA, as illustrated below:

|624x353.1978329908463

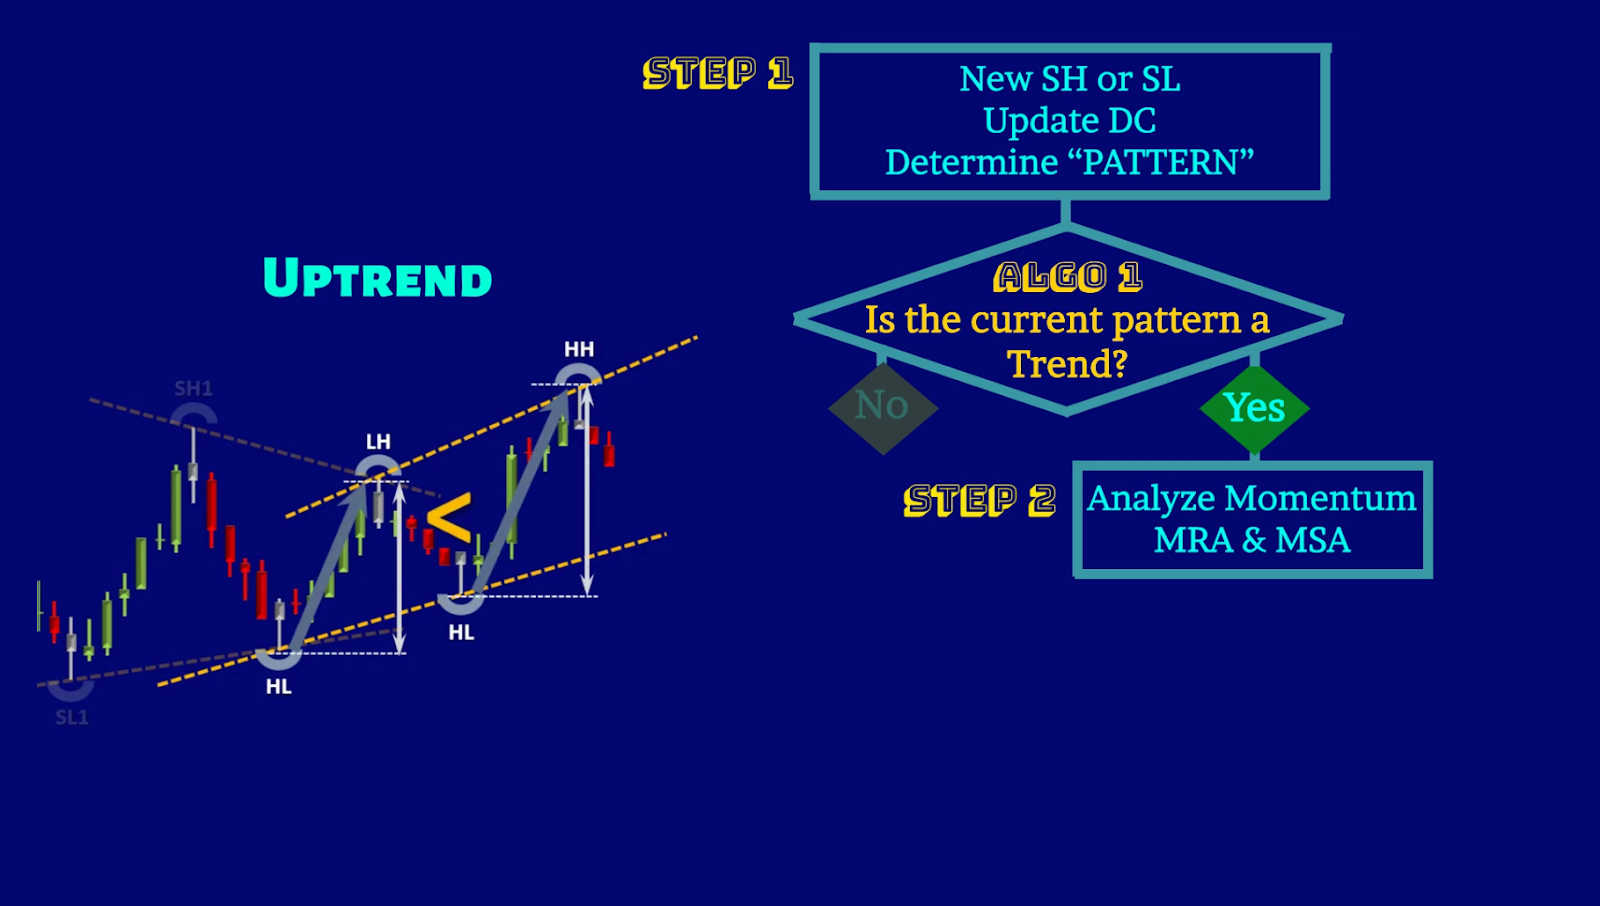
The second algorithm condition continuously monitors the momentum and assesses the strength and weaknesses of the established trend.

If the momentum range analysis or momentum slope analysis indicates that the trend is strong and has not weakened, you will proceed with the remaining conditions of the Setup T algorithms, as shown below:

While you constantly repeat step 1 with every new price turning point and confirm that the pattern is a trend, and then proceed to step 2 to confirm that the momentum is strong, as shown below:

As you can see in the price chart above, the trend is still strong, and this cycle is being repeated as you check the other entry setup algorithmic conditions to enter this uptrend.

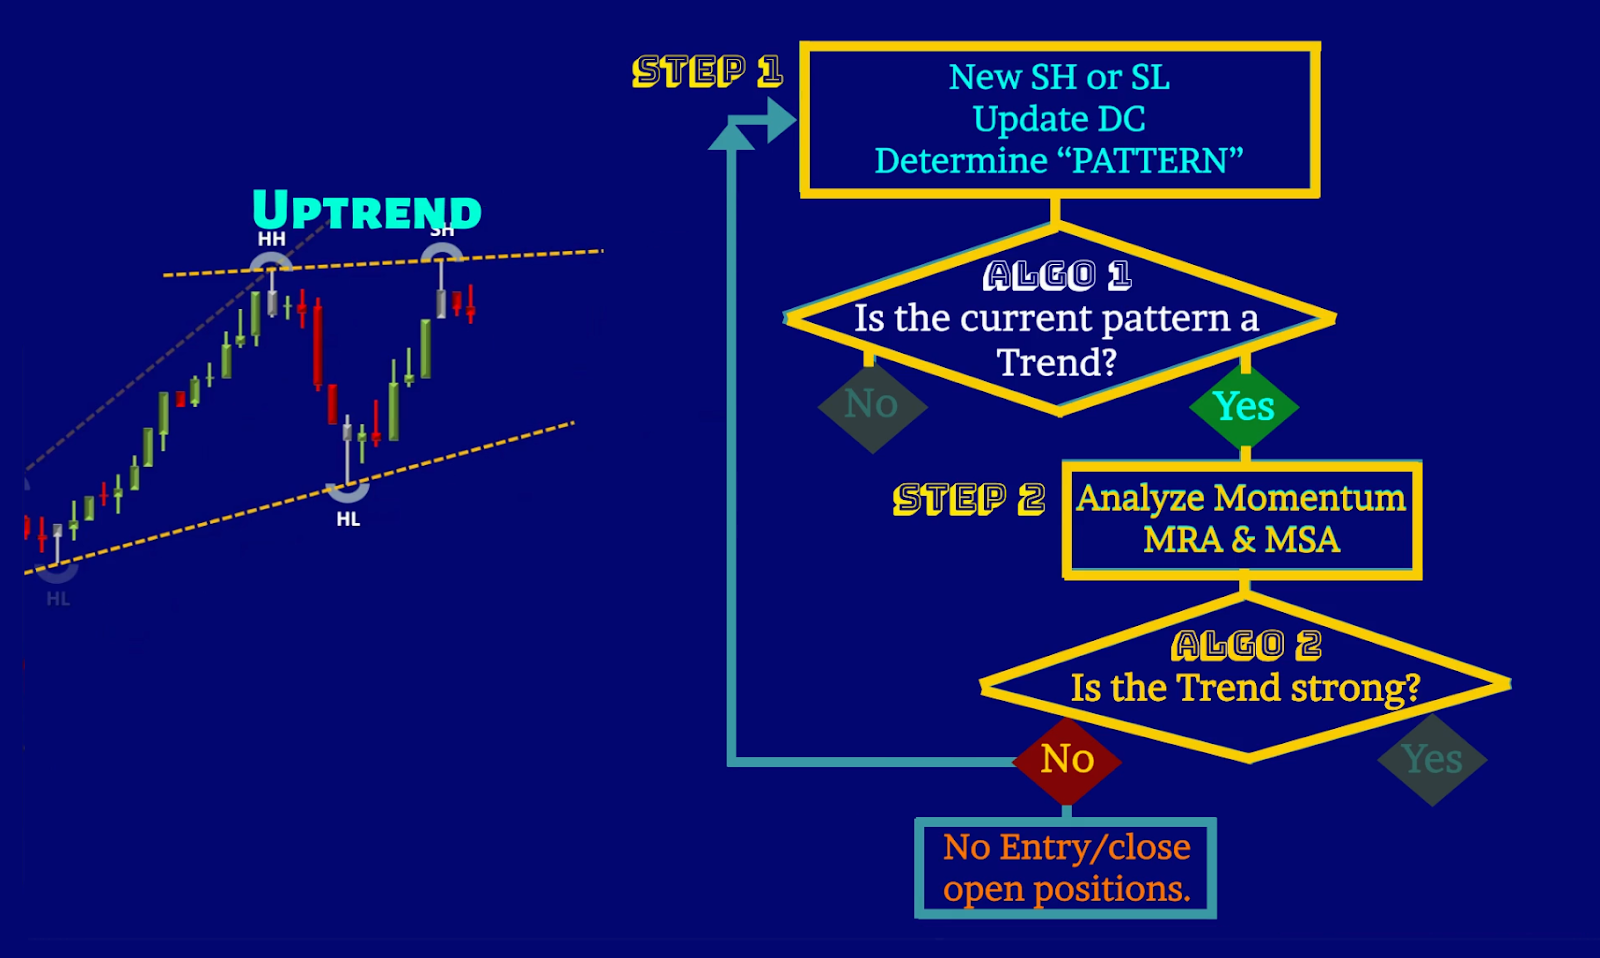
As you repeat steps and algorithms 1 and 2, you may notice that the momentum analysis shows signs of trend weakness, as shown in the price chart below:

In this case, you should not proceed with the remaining algorithms to enter any new positions and be prepared to close all open positions.

Then repeat steps and algorithms 1 and 2 with every new price turning point and update of the DC to see if the trend resumes its strength or transitions to a sideways pattern, as shown below:

As you can observe from the price chart development below, the weakened uptrend has ultimately transitioned into a sideways pattern. Therefore, algorithm 1 will not pass, and step 1 needs to be repeated until a new uptrend or downtrend emerges:

So, let’s practice applying these two steps/algorithms in a forward-test manner, simulating the live market conditions on the price chart based on the below flow chart:

This will develop your skills in recognizing the trend and sideways pattern transition and analyzing the momentum of trending patterns. This will help you not trade sideways patterns and not miss any strong tradable trends.

It is important to allocate dedicated time for practice in order to develop and refine your skills in this area. Utilize various techniques such as forward-testing, market replay, and live demos to acquire the essential PAAT skills necessary for success in trading. Also, you can use practice drills offered in the PAAT-Trial course free of charge to develop the essential skills discussed in this chapter.

1 Like

Dear Fellow Traders,

Many of you who were interested in Price Action Algo Trading have asked how to continue with the lessons that have been posted so far. You can continue your lessons using one of the following steps:

1- Read the PAAT Mini-Book, which is offered for free by following this link:
PAAT Mini-Book

2- Try the PAAT-Trial course which is offered for free and includes dynamic price action lessons and Smart Drills by following this link:
PAAT Trial Course

I’m glad the PAAT class content was useful for you and let me know if you need further assistance.

Best regards,
Reza

The Three Essential Trendline Trading Strategies that You Need to Consistently Trade Any Market

In this video, we outline three powerful trendline trading strategies that provide an edge by utilizing setups within the Price Action Algo Trading system, each offering varying win rates and risk-reward ratios: