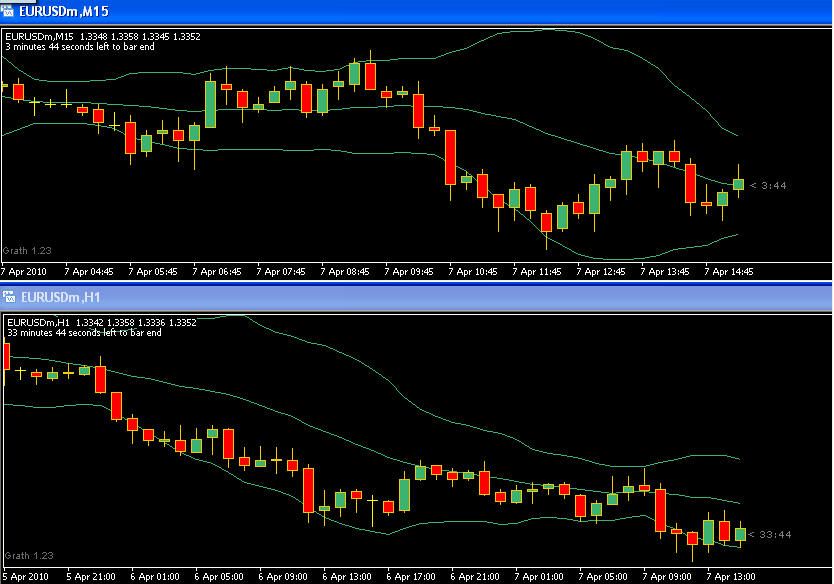
What pair were u trading?
That was the EUR/USD
I used to use snagit but my free trial ran out. I bought Screen Shot 8 by Broderbund on ebay for about $10…works the same as snagit. After capturing the pic with Screen Shot I save it in a documents file and then upload it to photobucket. Then copy the IMG imag and paste it into the post. It sure makes it easy for us to see and learn from it. The thumbnail attachment are too hard on my old eyes.
I go all the way down to the 5 min chart and watch for a bounce off the top BB with a reverse signal. I also use mad scalper to time my entry. I have been using the two methods together and have been doing well. Both of them together helps keep me out of bad trades.
http://forums.babypips.com/free-forex-trading-systems/30927-mad-scalper.html
Range Bound tells me to look for a move down but mad scalper says…not yet.
Too often I wound up jumping the gun on mad scalper only to have it go nowhere or back against me. Now I am looking for a bounce off the outer BB and then look for the reversal confirmation of the mad scalper. Mad scalper is great for entering a trend…once the trend has started. Range Bound tells you when the trend should happen because pa bounces off the opposite BB of the direction indicated by daily or 4hr.
By the time I have finished this post the 5 mind pa is up to the top BB. From there I’ll look for a reversal signal and an entry on the mad scalper. If I’m really confident I sometimes go to the 1 min on the mad scalper to get in early. Such signals make for a very small stop loss…10 or so.
This is an illustration of the power of these two methods together. I was still sleeping and missed it.
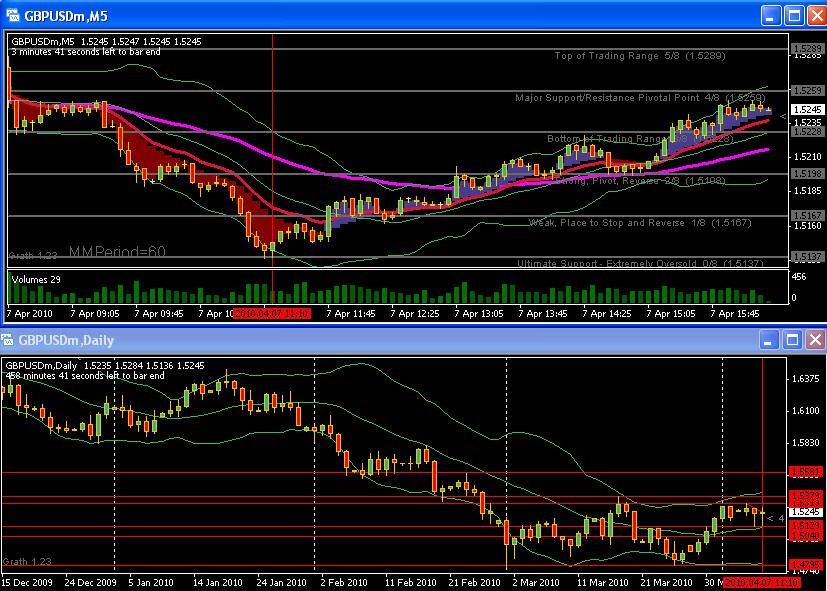
The daily tell us to only trade long (the red horizontal lines are support & resistance lines that I put there from the daily, 4hr, & 1hr…where I look for reversals).
The 5 min shows the pa at the bottom of the lower BB…we’re watching for a reversal up. If we enter at the close of the up candle (stop loss is only 15 pips) or the close of the next candle (stop loss is still only 20-25 pips) we would be getting in really early.
But if we are following Mad Scalper rules we would not get in until after the red line crosses above the magenta line and the color is blue and not until the color had changed from red to blue…and then enter on the opening of the second blue bar. We would not have gotten in this trade until 1.5212…but good for a safe 20-30 pips. If we had dropped down to the 1 min chart and waited until the ma’s crossed up…confident that we were trading in the right direction, because of our use of the Range Bound BB rules, we could have gotten in the trade much much earlier.
I hope this explains how these two methods compliment each other but also remember something very important about my explanation and analysis…hind sight is always 20/20. 
Very good PTB! 
Lost on two trades on the usd/cad. daily/hr. Price was below 20sma on the daily and price was touching upper band on the hourly. reverse candle formed but price kept on rising. Happened twice!! Maybe I should stick to the pairs i know. 

Hi jatoki
I also got kicked out of the first trade, there is NO strategy that will win 100%.
I did not trade the second one, as the pair was trading strongly above the SMA, I see you dont have the SMA on the hourly, I recommend you put it on.
Cheers
hi Monkey trader,
Yea there is definitely no perfect trading strategy. I do have the sma on the hourly. its the same as the middle band of the boinger bands.
Daily had a reversal signal off the bottom BB and was heading up. That was the first clue that you should not go short.
4hr was up at the top BB but no real reversal signal yet. Just because it is at the outer BB does not mean it will change direction…just means to watch for reversal signal.
1hr…same as 4 hr…no reversal signal yet.
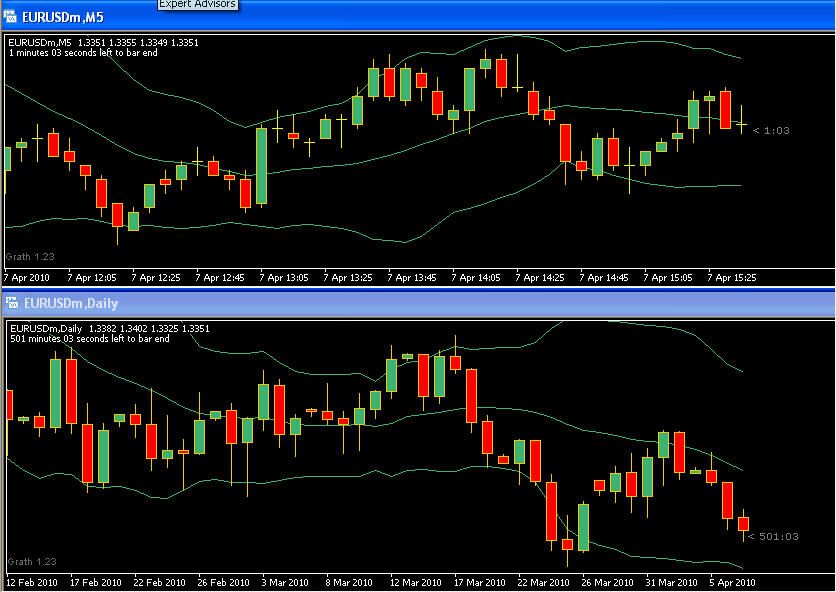
30 min…same thing…no sign of reversal.
15 min…small bodies on candle & a dogi just means a possible change of direction.
5 min…still nothing definite.
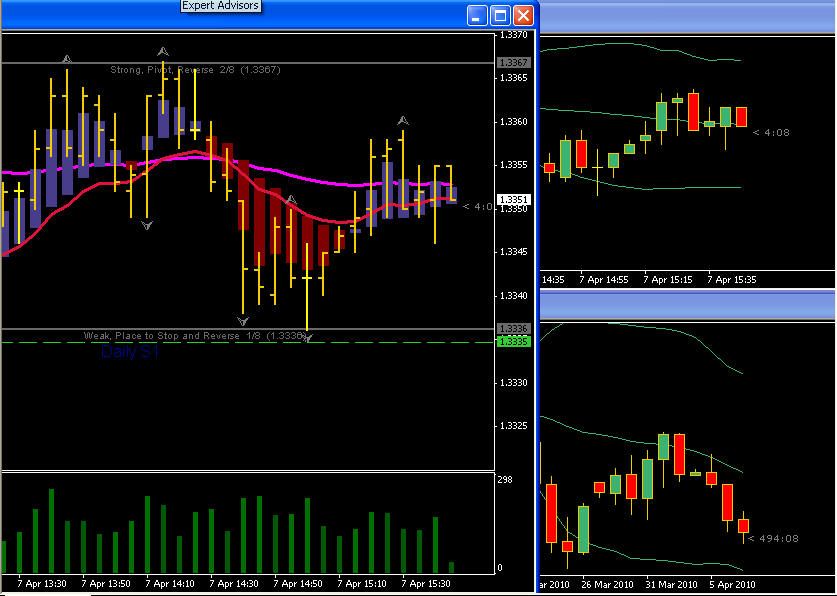
Also a short trade was not confirmed by the mad scalper chart…rather it was more of a long signal.
Keep in mind that the tail does not wag the dog…the dog wags the tail. All indications from the larger TF is that the price action was going up not down…even though the daily was below the middle BB it had already bounced off the bottom BB and had a definite dogi and was confirmed by an upward engulfing candle (one that moved at least 50% in the opposite direction of the previous large down candle…
So…with the larger time frames indication up, you should have been looking to stay out of the trade or at least scalping upward.
The main thing I look for is which way do the larger TF’s say it is heading. If we get that wrong we are going to be in a world of hurt. Just because the price is above the middle BB line (20sma) does not mean it is going up. If the price has recently bounced off the upper or lower BB, it is actually heading in the opposite direction…which will be confirmed by the 4 hr and probably the 1 hr. Once we know the direction we can now look for an entry on the lower TF such as the 5 min chart.
As I’ve mention before I find the Mad Scalper invaluable for an entry. I would not think of using one without the other. Together they have kept me out of several bad trades.
Hi PTB,
I see what you mean. Makes sense. So a possible trade would be when the higher time frame is for example trading[B][U] below the 20sma and trending downwards[/U][/B], we look for an entry on the lower time frames when price is trading around the upper bolinger band and wait for a reversal candle as opposed to just trading when higher time frame is below 20sma but trending upwards.
Can you elaborate a little more on Mad Scalper Chart.
thanks for the additional input.
The thing to be aware of is…what has the daily price action done recently? I’m careful of what is happening when the larger time frame chart’s price action is on the outer BB’s.
I would suggest you go to the Mad Scalper thread and study it. The rules are on the first page. Look at the first few pages to understand what Pete is talking about. You may then want to skip to the last several pages to see what has been posted more recently. Pete also has another thread that deals with longer term analysis, which is very good. I use that info all the time when looking at the Range Bound charts. It deals with volume. Forex does not have true volume (forex futures does) but Pete shows how to use the volume indicators to your advantage. I find they are very useful. When the price is moving in a certain direction with low volume, I suspect that the momentum is not sufficient to make it continue in that direction…especially useful on retraces. If retracement show large volume I suspect that it may be able to retrace and keep going. I trade mostly on smaller time frames. Pete shows how to use the volume bars, especially with pin bars, to your advantage.
Sometimes I will get a very different point of view when I bring up the mad scalper chart after making my first determinations from the Range Bound charts. I will be almost ready to pull the trigger when…whoa…the mad scalper charts don’t say that!..at least not yet. They’ve kept me out of what would have been damaging trades. With the two methods together I have more confidence in my trades. With that confidence I am able to have a smaller stop loss but that confidence has also allowed me to have a larger stop loss. Doesn’t make sense does it? Sometimes I will get stopped out because of a spike and then see it go in back to trading in my direction. These two methods give me confidence that I am trading in the right direction.
All this information is to your advantage. I just keep poking information into my mind and find that the picture becomes more and more clear. I’ve been trading off and on for 6 or 7 years. I’m doing better now and have more confidence than ever. I’m getting to where I have more time to really get into this. I hope to be able to show some of my daughters and others that want to be stay-at-home moms that they can do this to supplement their income. I wish you well and profitable trading.
Dang, I’m wordy!
Hi, this trade kicked me out by 2pips:mad:
Daily was trading below SMA, hourly consoladating and made inside bar.
The SMA on hourly was still pointing up, I should read what I posted about angle of SMA:D


EUR/USD
As Im posting I see a setup on EUR/USD.
You can see the sell stop, stoploss and limit iv placed.


