@Vaczak Try this. Select the button on TV number 1. Then select the Heiken Ashi option shown in 2.

1 Like
I’m back to just closing whenever I’m a few pips in profit again today. Trying to make every trade be a winner, even if it’s just two pips.
2 Likes
Hopefully some of us are doing much better than I am today. I’m trying to trade while driving again. But, my last five trades have been winners. One pip, three two pips, and a 4 pip while pumping gas. That’s right. Big money!
I bagged 42 pips on Sunday night trading USDJPY 1hr. I got in Friday on a signal and held, and bam!
I mean, I held longer than I normally do, but price was moving the right way for me.
1 Like

Further testing has shown the strategy can also work on Eur/Jyp, Chf/Jpy, ond Usd/Jpy.
The PSAR setttings of 0.05 / 0.05 (or close to those, such as 0.06 / 0.07) work nicely on 5M or 1M timeframes for these alternative pairs as well.
1 Like
USDJPY on the way down.
Quick 10 pips!
1 Like
USDJPY in freefall!
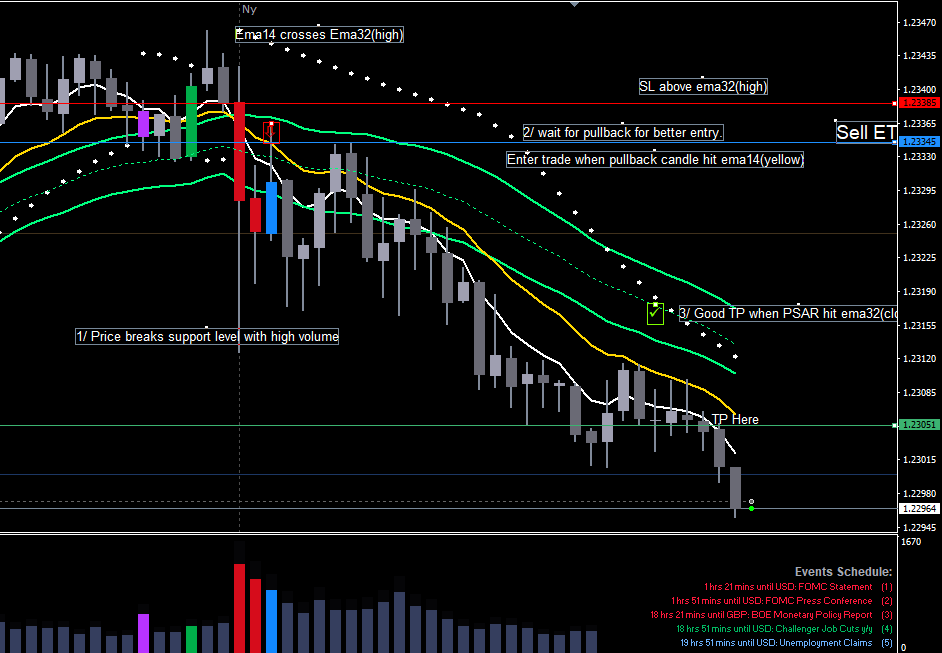
Hi AT, thank you for sharing your scalping system. After testing with a demo account, I’ve put some real money and tested it. I also adjust the system a bit by adding 1 more EMA32(close) and set PSAR(step: 0.02; maximum: 0.08) to find better TP. What i found is whenever the PSAR getting close or hit the ema32(close), it will be a good point to TP. I bagged 64pips today, it looks promising but ofc i need to back test it more.
GBPUSD m5
3 Likes
Is this the middle line inside the solid green lines? How do you use this?
1 Like
Yes, i added it to identify a possible good TP, if you look at #3 in the pic (the green ✓), it is where PSAR crosses the middle line, you should take tp when you see it. This TP setup works best when your trade follows the big trend on higher timframe m15/h1.
3 Likes
@sgk179 Thanks for the amendments and well done on the 64 pips yesterday.
-
Do I have to wait for a down or up signal on the chart to occur first?
-
Does it HAVE to be a CANDLE that pierces through both the upper and lower 32’s for a sell and vice versa for a buy?
-
What pairs have you been getting the most success on or is this likely to work on all them?
Thanks in advance.
Ramping it up on my 1M Eur/Jpy.
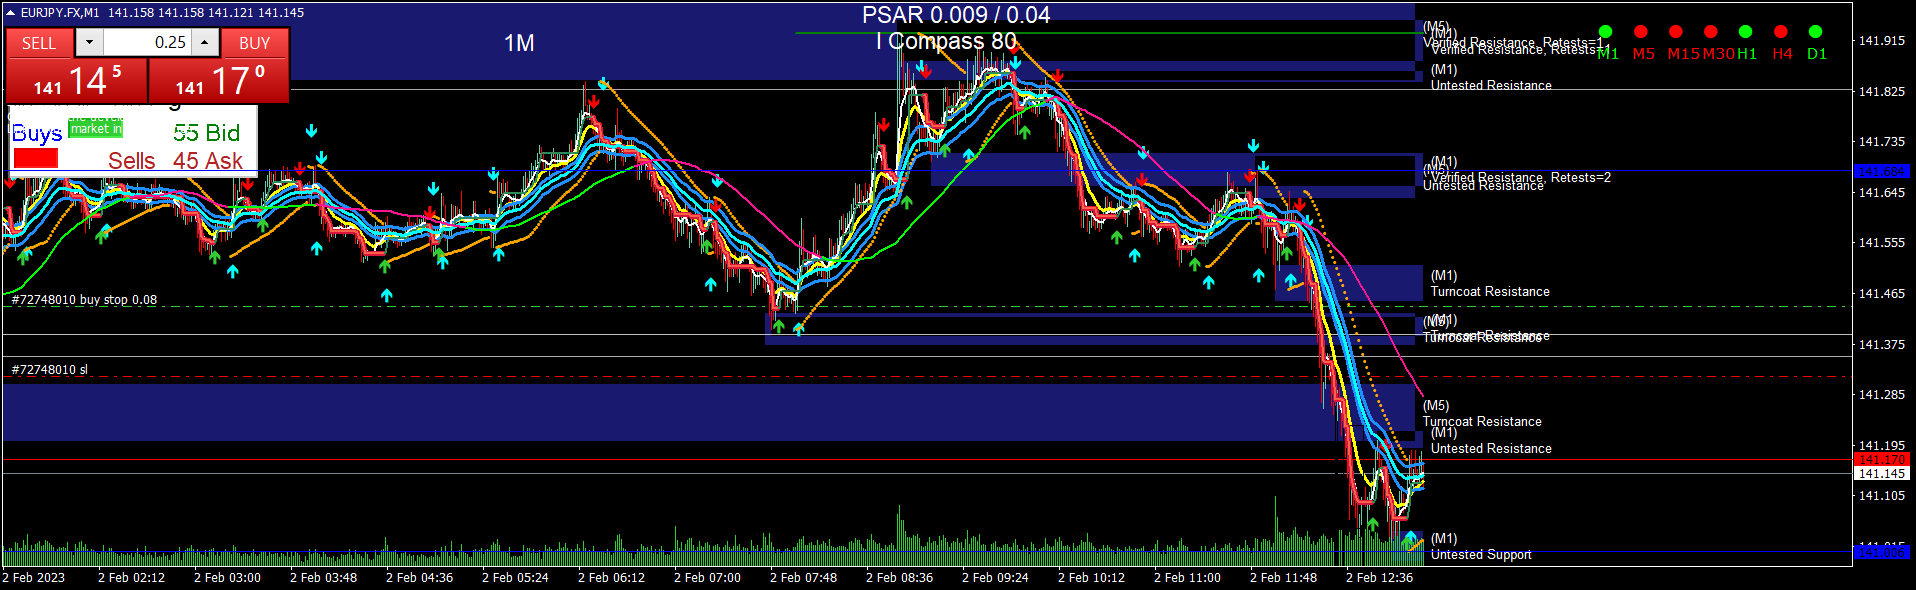
Going with PSAR at 0.009 / 0.04.
Going with Green/Pink I Compass indicator set to 80.
I hope to go through the rest of this year with those settings.
Hi rocktrucker, in response to your questions:
1/ Yes we have to wait for the signal to occur. For me the down/up signal tell us that, there will be a chance for an entry.
2/ No it doesn’t have to be a candle that pierces through the green 32’s, but it is MANDATORY that the price has already broken the nearest resistant level (for BUY) or support level (for SELL).
If you see a good sign like a pinbar with a long wick or an engulfing candle, your winning chance for he trade will be higher. Sometimes these candle appears before the signal. In addition when you see the volume at the signal is higher, it is a sign that telling you it might be worth to open your trade longer to earn more pips.
3/ I’ve only tested this for 1 day so i cant tell. Here’s another example i took a trade on USDJPY recently

Happy trading 
Hi sgk179
Thanks for coming back.
Number 1 - I don’t see the signals on your chart though unless you are using something else for signal confirmation?
In number 2 you talk about support and resistance levels, are you talking about the high/ low 32’s bar that are acting like the s/r levels or are you using an indicator for this in MT4 as I can see you have drawn two lines on your chart?
Thanks
I’ll give this a try! Thanks!