Okay, let’s refine the strategy to focus solely on the 24 and 120-period SMAs with price action and liquidity concepts for intraday and swing trading.
Strategy Name: SMA Crossover Price Action Liquidity
Goal: Identify short-term momentum changes within the longer-term trend, capitalizing on liquidity areas and price action signals.
Currency Pairs: Major pairs with good liquidity (EUR/USD, GBP/USD, USD/JPY, AUD/USD, XAUUSD). Important for liquidity sweeps and reliable PA.
Timeframes: 15-minute (M15) for entry, 1-hour (H1), and 4-hour (H4) for context/trend.
Indicators:
24-period Simple Moving Average (SMA): Represents shorter-term momentum.
120-period Simple Moving Average (SMA): Represents the intermediate-term trend.
Awesome Oscillator for confirmation
Core Concepts:
Liquidity: Areas on the chart where a large number of orders are likely to be clustered. These often include previous swing highs/lows, key levels, and areas where price has consolidated for a while. We anticipate the price reacting to these levels.
Price Action ¶: Analyzing candlestick patterns and chart patterns to identify potential reversals or continuations. We’re looking for specific patterns to confirm our signals.
Strategy Rules:
1. Higher Timeframe Trend (H4 Chart):
Uptrend: 120 SMA is trending upward. Price is generally above the 120 SMA.
Downtrend: 120 SMA is trending downward. Price is generally below the 120 SMA.
Rangebound/Consolidation: 120 SMA is relatively flat. Avoid trading during this period.
2. Intermediate Trend and Liquidity Assessment (H1 Chart):
Use the H1 chart to refine the trend assessment. Is the price pulling back to the 120 SMA? Is it bouncing off it? Does the 24 SMA cross above/below the 120 SMA for additional confluence?
Identify key liquidity areas:
Swing Highs/Lows: Mark recent swing highs and lows. These are areas where stop-loss orders are often clustered.
Double Tops/Bottoms: Similar to swing highs/lows, these represent areas where price previously struggled to break.
Consolidation Zones: Areas where price has moved sideways for a while. Breakouts of these zones often trigger strong moves.
Trend Lines: Drawing trendlines may help to identify potential support and resistance areas.
3. Entry Signals (M15 Chart):
Long Entry (Uptrend or Bullish Reversal near SMA):
SMA Crossover: The 24 SMA crosses above the 120 SMA.
Price Action Confirmation: After a pullback to the 120 SMA (or a nearby liquidity area), look for a bullish candlestick pattern, like a bullish engulfing, a hammer/pin bar, or a piercing line. Ideally, this PA forms near the 120 SMA or just after a liquidity sweep.
Liquidity Sweep: Price dips below a recent swing low (sweeping the liquidity), then quickly reverses upwards, breaking back above the low. This is a very powerful sign of bullish strength.
Short Entry (Downtrend or Bearish Reversal near SMA):
SMA Crossover: The 24 SMA crosses below the 120 SMA.
Price Action Confirmation: After a pullback to the 120 SMA (or a nearby liquidity area), look for a bearish candlestick pattern, like a bearish engulfing, a shooting star/pin bar, or a hanging man. Ideally, this PA forms near the 120 SMA or just after a liquidity sweep.
Liquidity Sweep: Price spikes above a recent swing high (sweeping the liquidity), then quickly reverses downwards, breaking back below the high. This is a very powerful sign of bearish strength.
4. Entry, Stop Loss, and Take Profit (M15 Chart):
Entry: Enter after the close of the confirming candlestick, or use a buy/sell stop order a few pips above/below the confirmation candlestick’s high/low.
Stop Loss:
For Long Trades: Place the stop loss below the recent swing low that preceded the bullish candlestick pattern or below the 120 SMA, whichever is lower. Consider the ATR (Average True Range) to add some buffer to your stop loss placement.
For Short Trades: Place the stop loss above the recent swing high that preceded the bearish candlestick pattern or above the 120 SMA, whichever is higher. Consider the ATR (Average True Range) to add some buffer to your stop loss placement.
Take Profit:
Risk/Reward Ratio: Aim for a 1:1 or 1:2 risk/reward ratio for intraday or Swing trade, respectively.
Previous Swing High/Low: Place your take profit near the next significant swing high (for long trades) or swing low (for short trades) on the M15 or H1 chart for intraday or Swing trade, respectively.
Liquidity Target: You can also target a known/recent liquidity pool for your TP.
5. Risk Management:
Risk per Trade: Never risk more than 1-2% of your total trading capital on any single trade.
Position Sizing: Calculate your position size based on your risk tolerance and the distance between your entry and stop loss.
Consistent Application: Stick to the risk management rules.
Trading Journal: Keep a detailed trading journal.
Important Considerations & Tips:
Preferably, try to buy within the discount area and sell within the premium area.
*** SMA as Dynamic Support/Resistance:** Treat the 120 SMA as a dynamic support (in uptrends) or resistance (in downtrends) level. Pullbacks to the SMA can offer good entry points.
*** Aggressive PA**: Aggressive price action and multiple confirmations increase the odds for success.
*** Confluence is Key:** The more factors that align (SMA crossover, PA signal, liquidity area), the stronger the signal.
*** False Breakouts:** Be aware of false breakouts. If price breaks through the 120 SMA but quickly reverses, it may be a false signal. Look for confirmation from price action.
*** News Events:** Be mindful of major economic news releases.
Backtesting: Thoroughly backtest the strategy.
Practice: Trade on a demo account until you are consistently profitable.
Focus and Adapt: Don’t try to trade every signal. Be selective and only trade the best setups. The market changes over time, so be prepared to adapt your strategy as needed.
Example Trade (Long):
H4: 120 SMA trending upwards.
H1: Price pulls back to the 120 SMA after making a new high. Potential liquidity at the last swing low.
M15: 24 SMA crosses above the 120 SMA. Price sweeps the liquidity at the swing low, forms a bullish engulfing pattern right at the 120 SMA.
Entry: Buy after the close of the engulfing candle, preferably within the discount area.
Stop Loss: Below the low of the engulfing candle or the recent swing low (liquidity area).
Take Profit: At the next significant swing high on the M15 or H1 chart or at a 1:1 or 1:2 risk/reward ratio.
This strategy is designed to be simple yet effective, relying on the basic principles of trend following, price action, and liquidity.
Consistency comes from disciplined application, risk management, and continuous learning. Remember to start with a demo account and gradually increase your trading size as you gain confidence and experience.
Good luck!
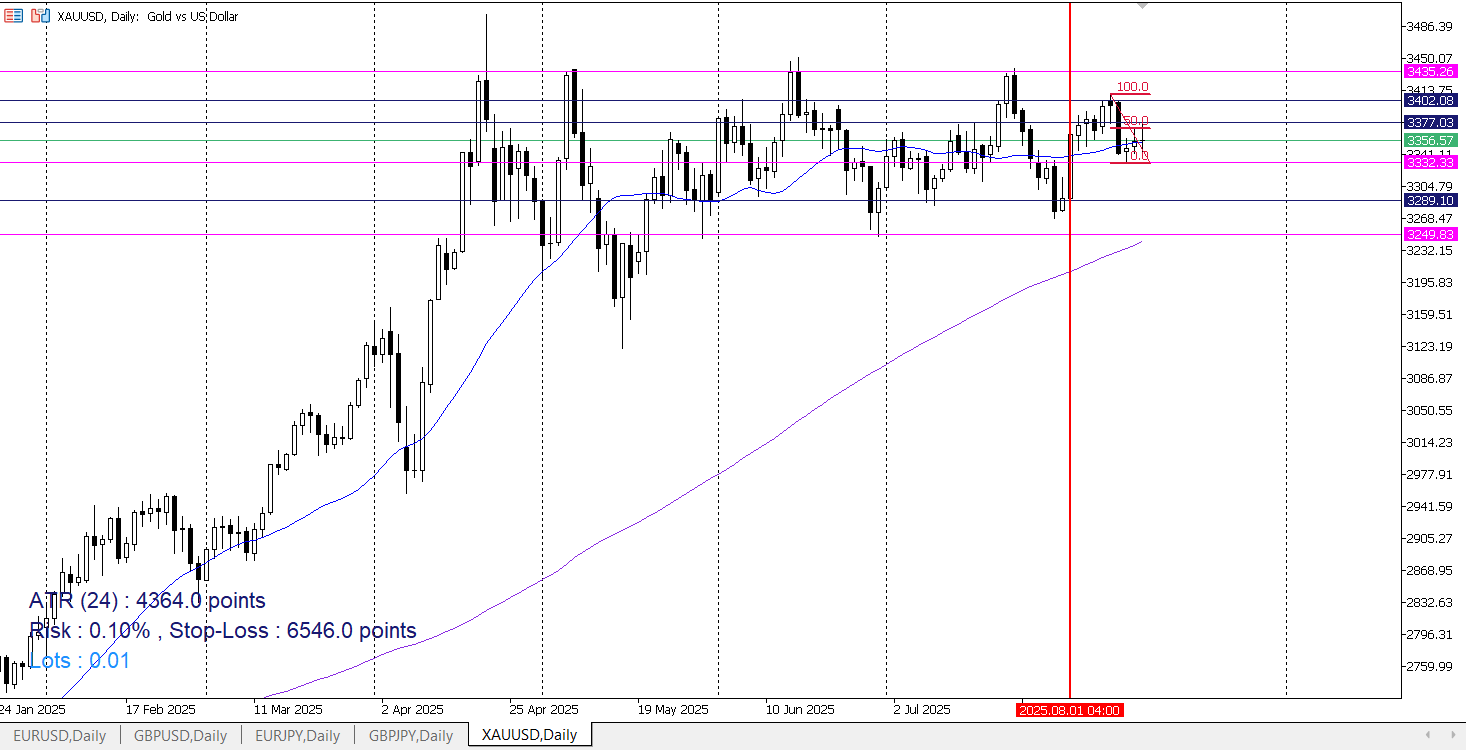
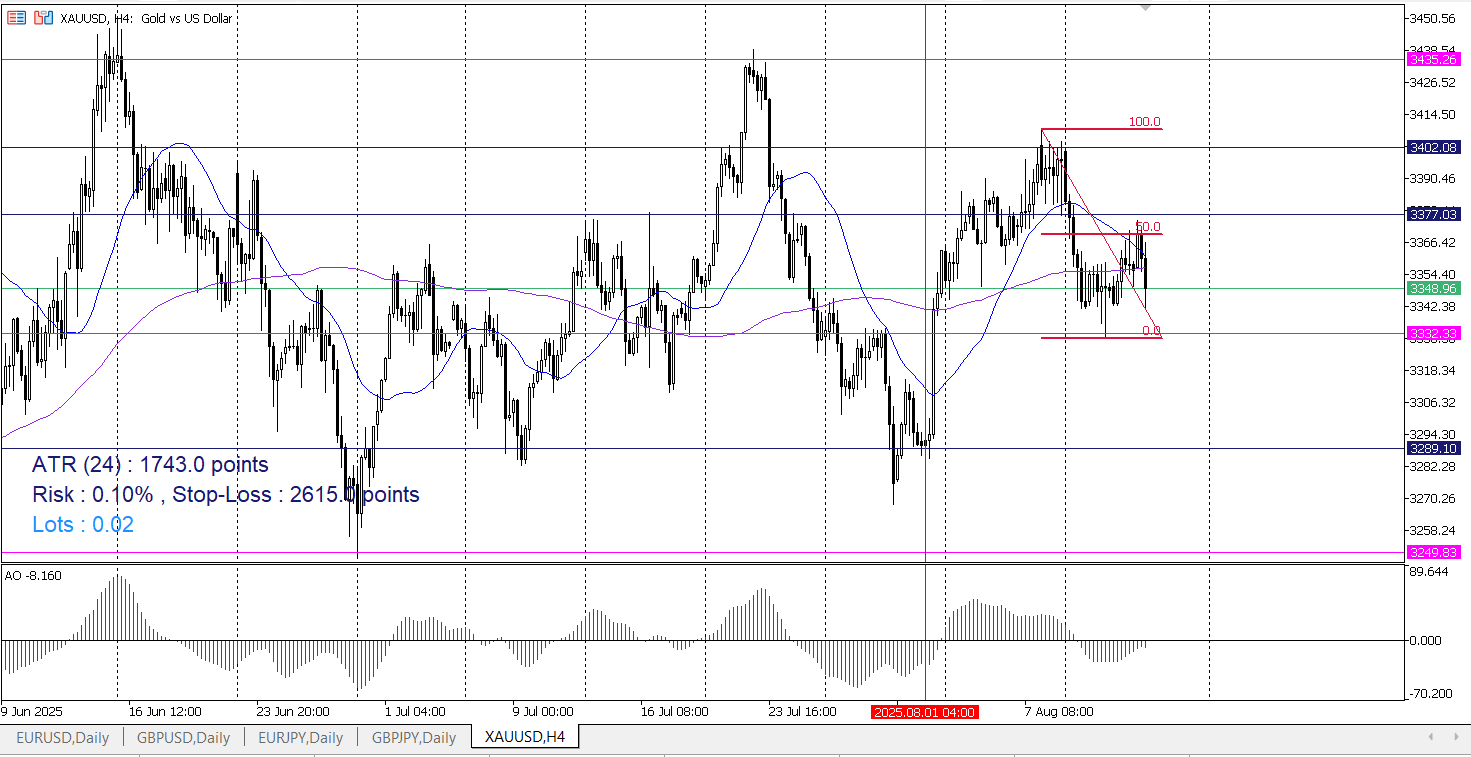
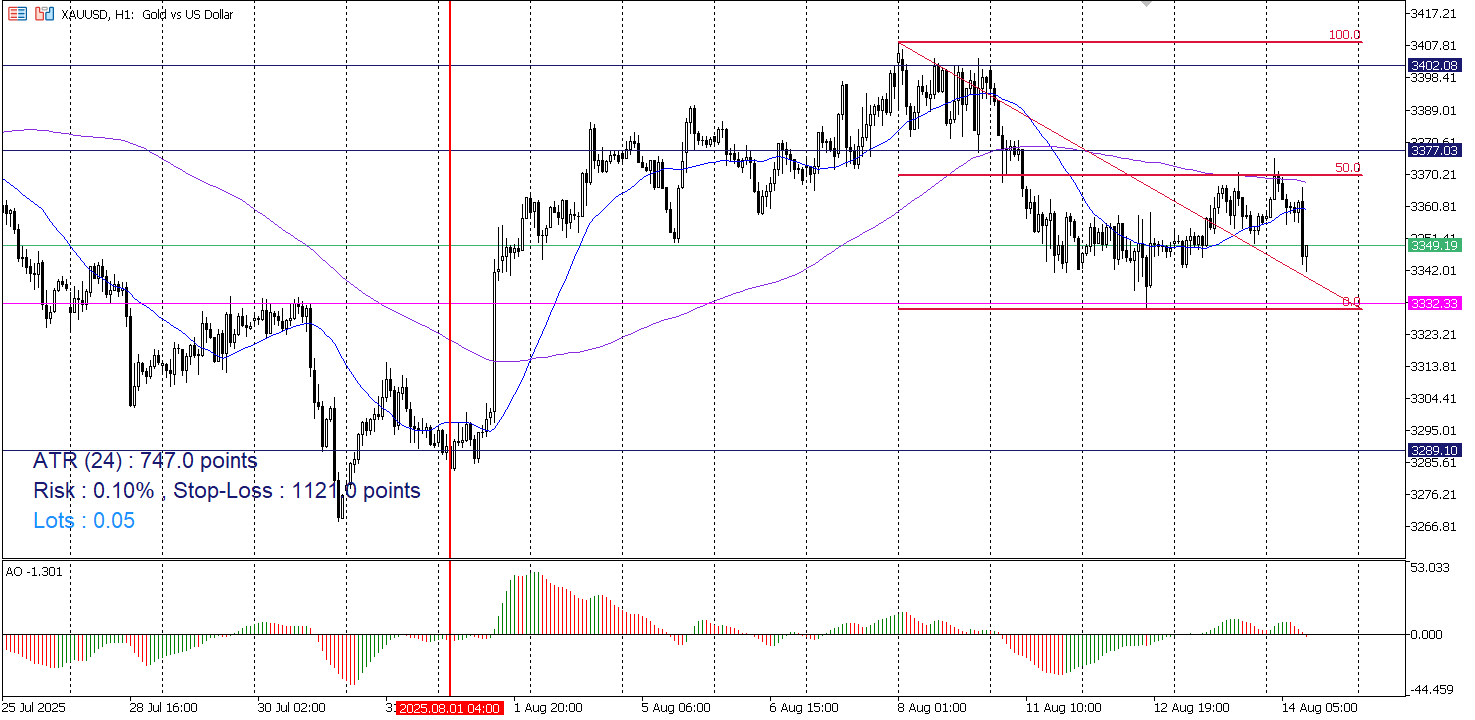
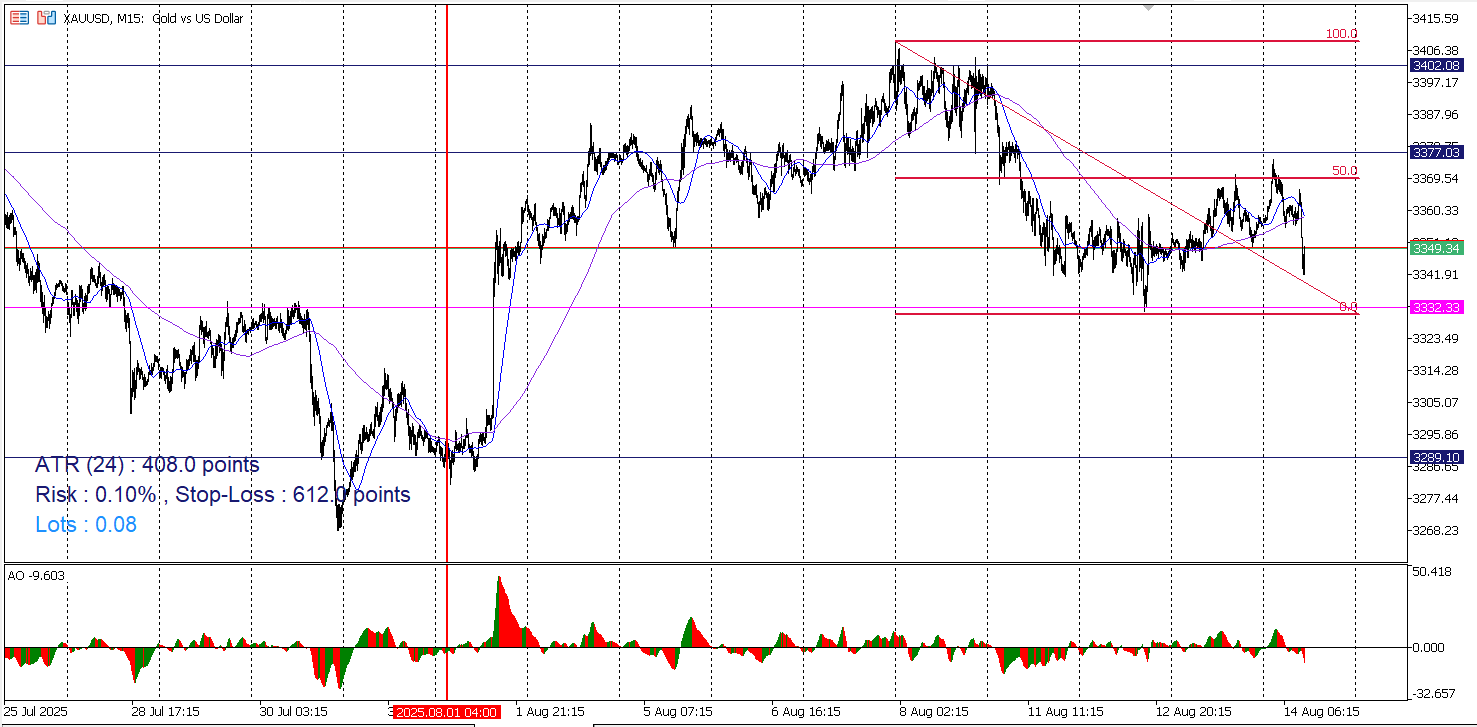
Screenshots of H4, H1, and M15 of XAUUSD are attached for review as per above rules strong text . Check the Red verticle line on the charts drawn on august 01, 2025 at 4.00 am.
The price has been trending within a range (Magenta line) on a daily time frame from April 22, 2025, to date.