Hi there every one hope your all well and keeping safe.
I will teach you all supply and demand trading,to keep you on the right side of the market with the banks and big boys.now supply and demand is not 100% win rate nor is it the holy grail but it’s as close to the holy grail any of you will ever find.trust me on this.i went searching for these indicators that are 100% win rate.ive tried most if not all and the only thing I’ve found works for me is supply and demand its powerful strategy if you get taught how to trade it correctly.
4 Likes

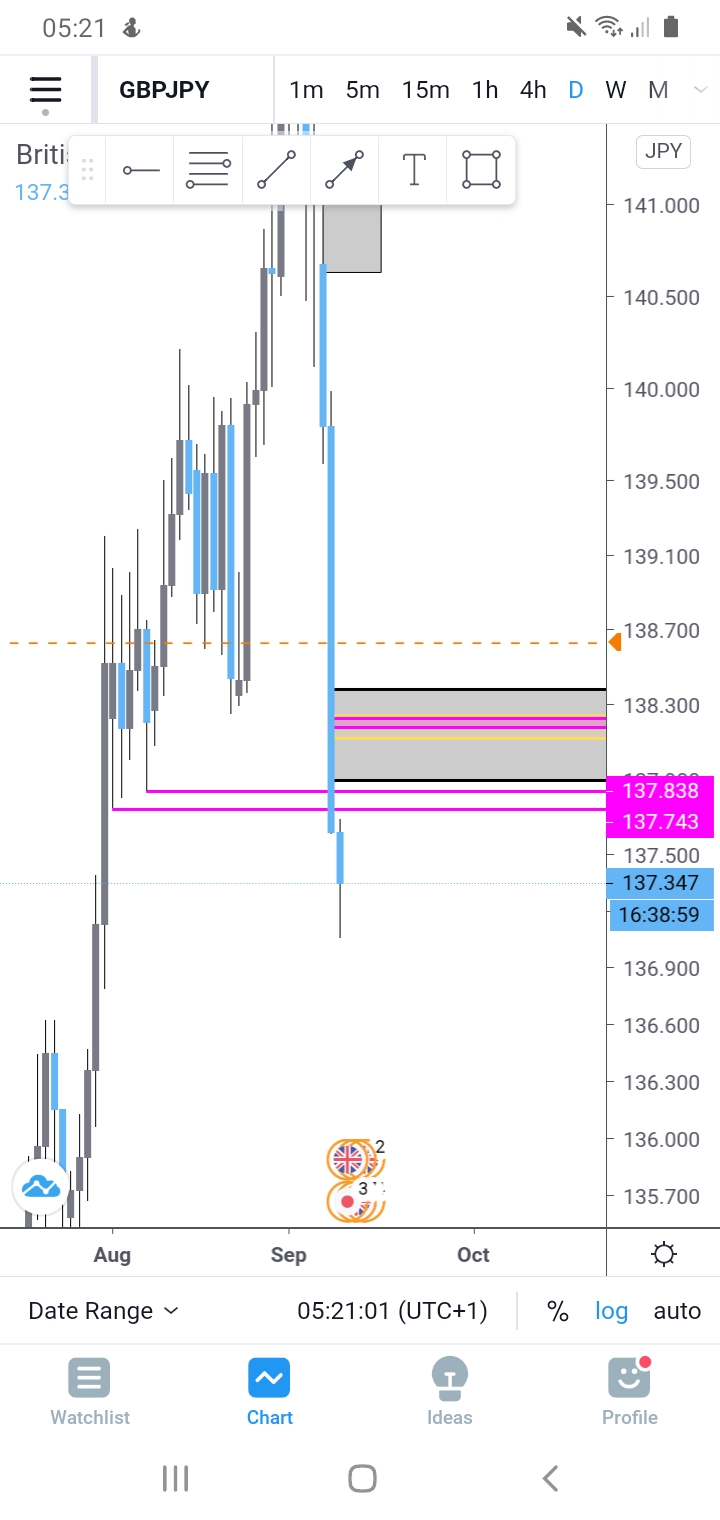
I’m expecting price to break daily market structure marked with the pink lines a little pullback and a move of 200 pips plus over the coming weeks.price normally moves one weekly supply to weekly demand same for daily zones also
2 Likes
Oooh. Good call! I’m in this trade myself.  Entered just around the same time, too!
1 Like
Hi ponponwei  .nice trade.i didnt hold over night uk time.i wanted to see the daily market structure broke first I will be entering into this trade today.i did take a few little continuation pattern trades down to those levels tho
  .
.
I will be keeping a close eye on this today I want price back into that 4hr 1hr nested supply with 5 min reversal pattern.
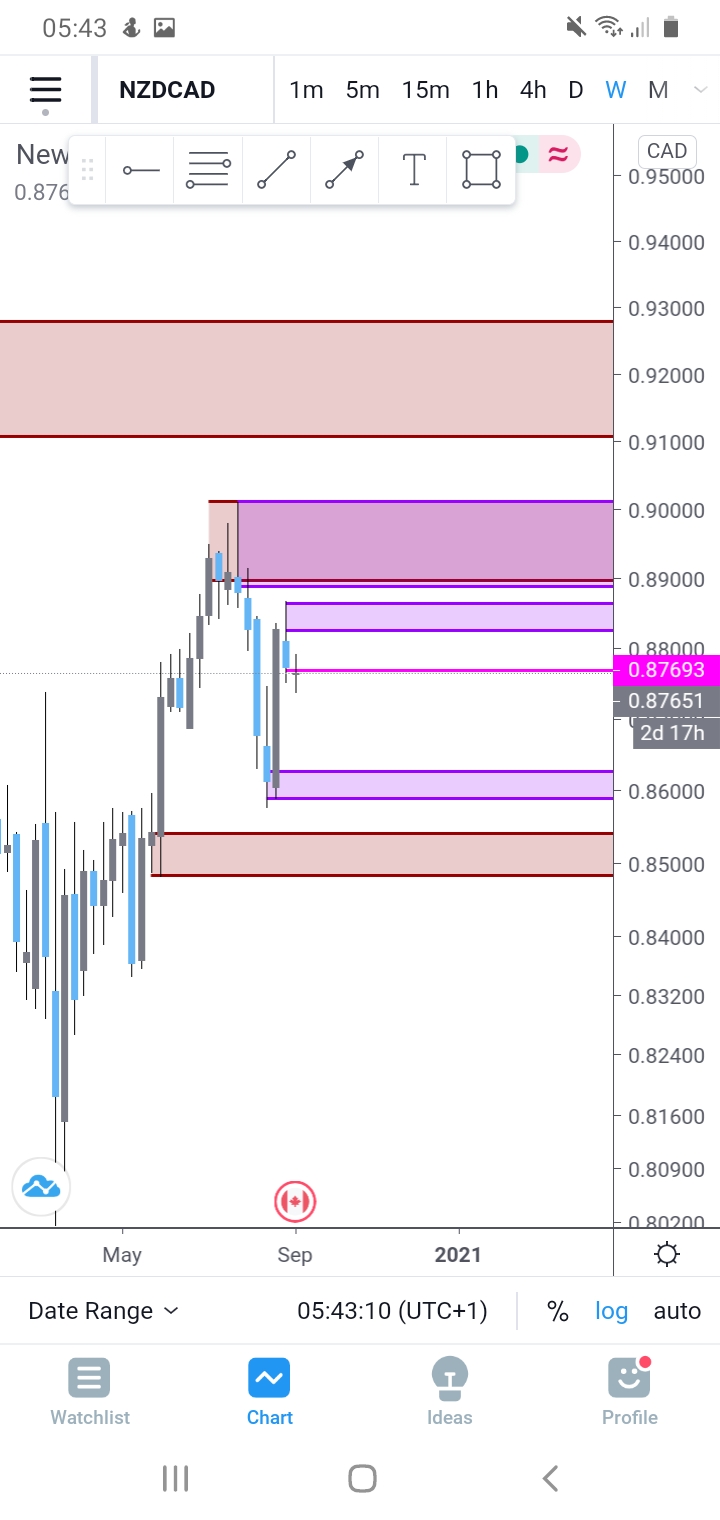
just having a browser through charts this morning came across this bouncing inbetween weekly supply/demand zones.after marking your weekly zones only advice this for experienced supply/demand traders.drop to your daily timeframe
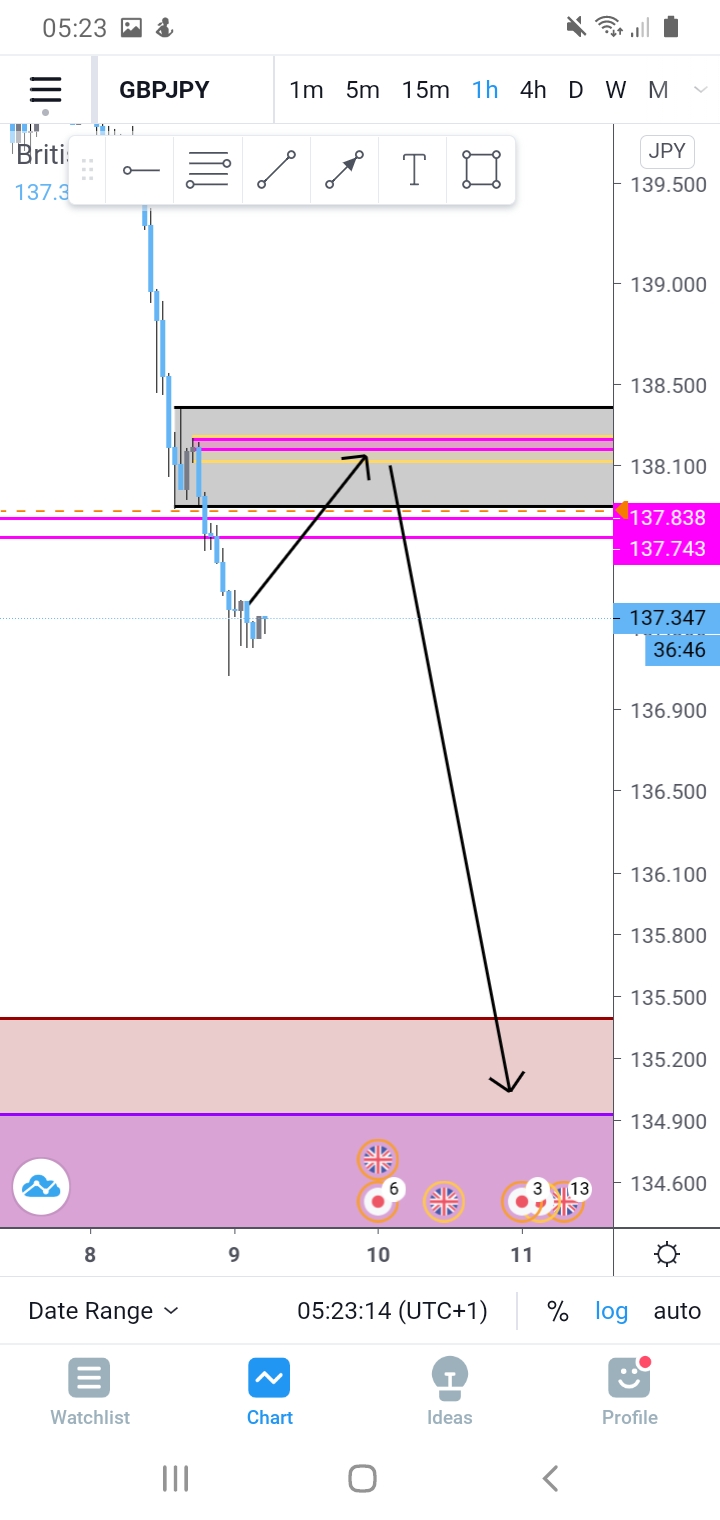
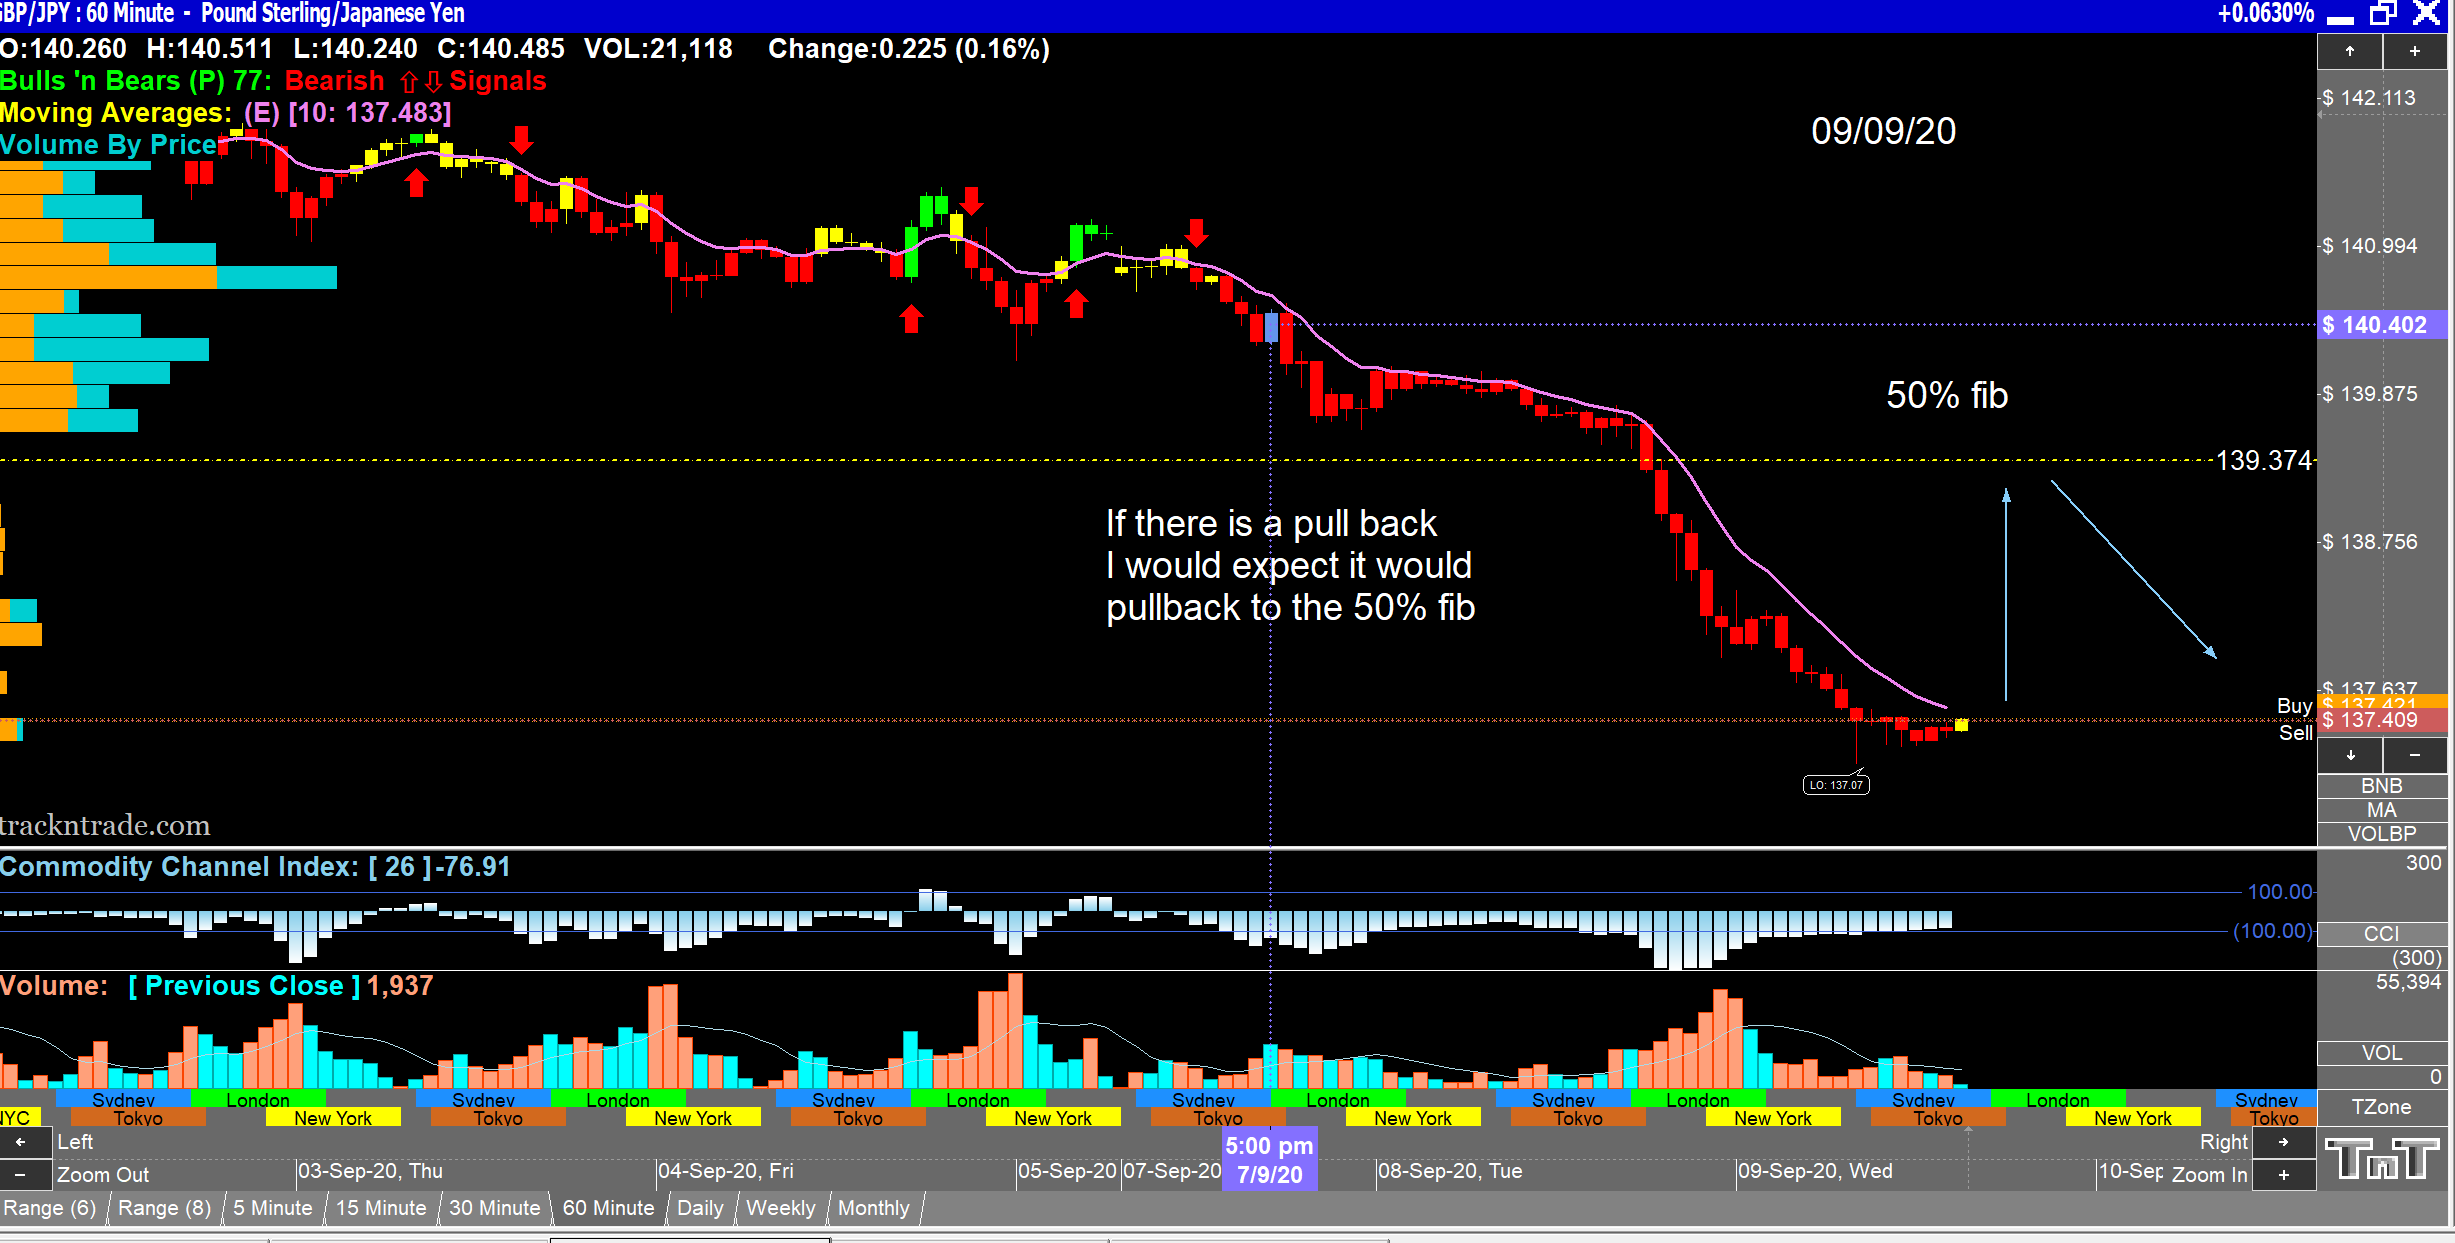
has you all can see from the picture above.the daily zone marked purple took out market structure.(this happens every single day on all timeframe) then this may not happen today but if we get the pullback to the daily zones marked with an arrow I will be on this down to where the arrow finishes is just over 100pips.thank me later 


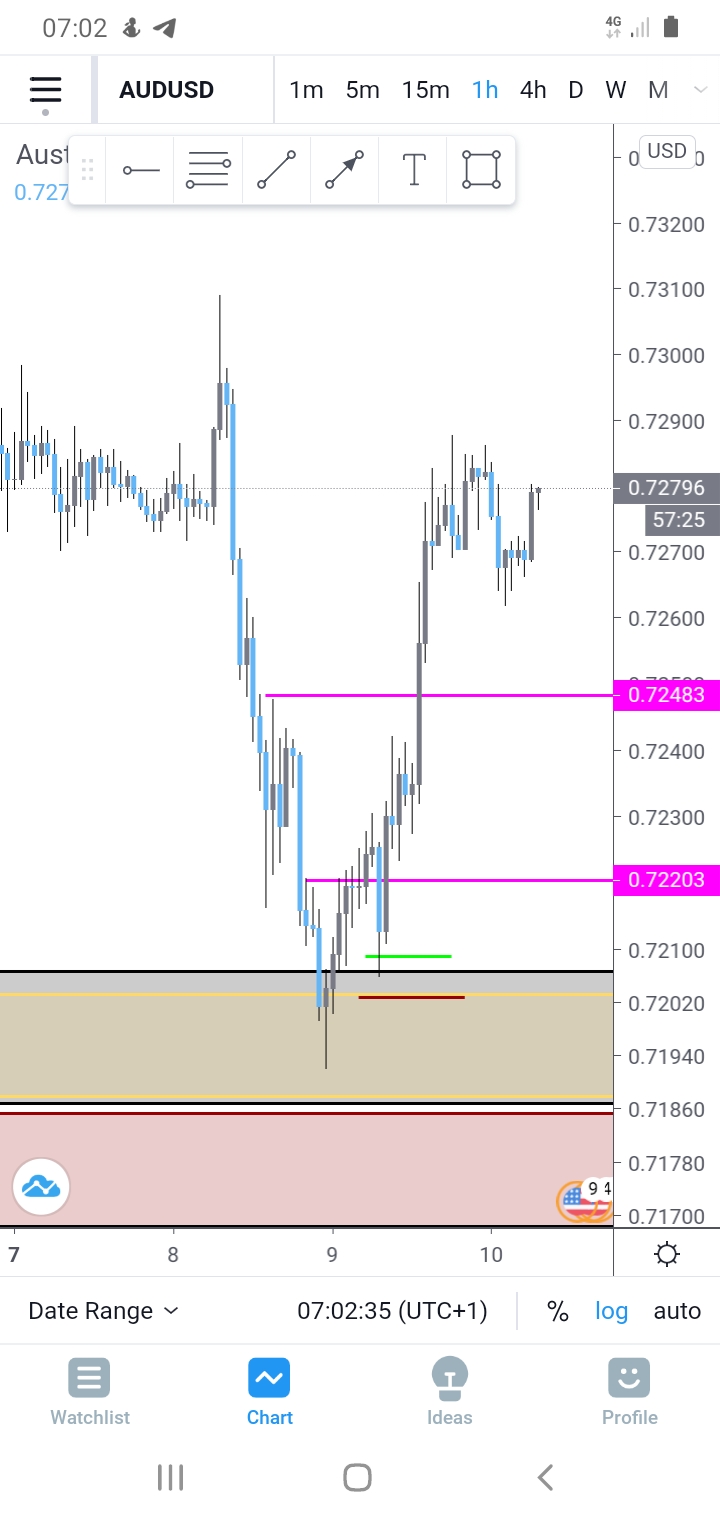
so I’ve dropped down to the 4hr and 1hr timeframes and found the market structure I want broken we have had one taken out and clearing the way for bigger profit margins.it may pullback now to that red zones at the bottom or it will clear the top market structure before pulling back to that red zone for a bigger profit margin.price always clears paths for profit margin alerter will be set and I will wait.now you could have taken that trade straight of the 1hr 4hr nested zone and youd be on 24 pips plus profit but I prefer to wait for confirmation…pulled back after the first market structure was taken out alerter went of I jumped inline with daily trend currently 33pips profit 3 positions 99pips in total.im here to show you how to trade profitable nothing else

I really want to know alot about trading indicator and so on.?. I am new an
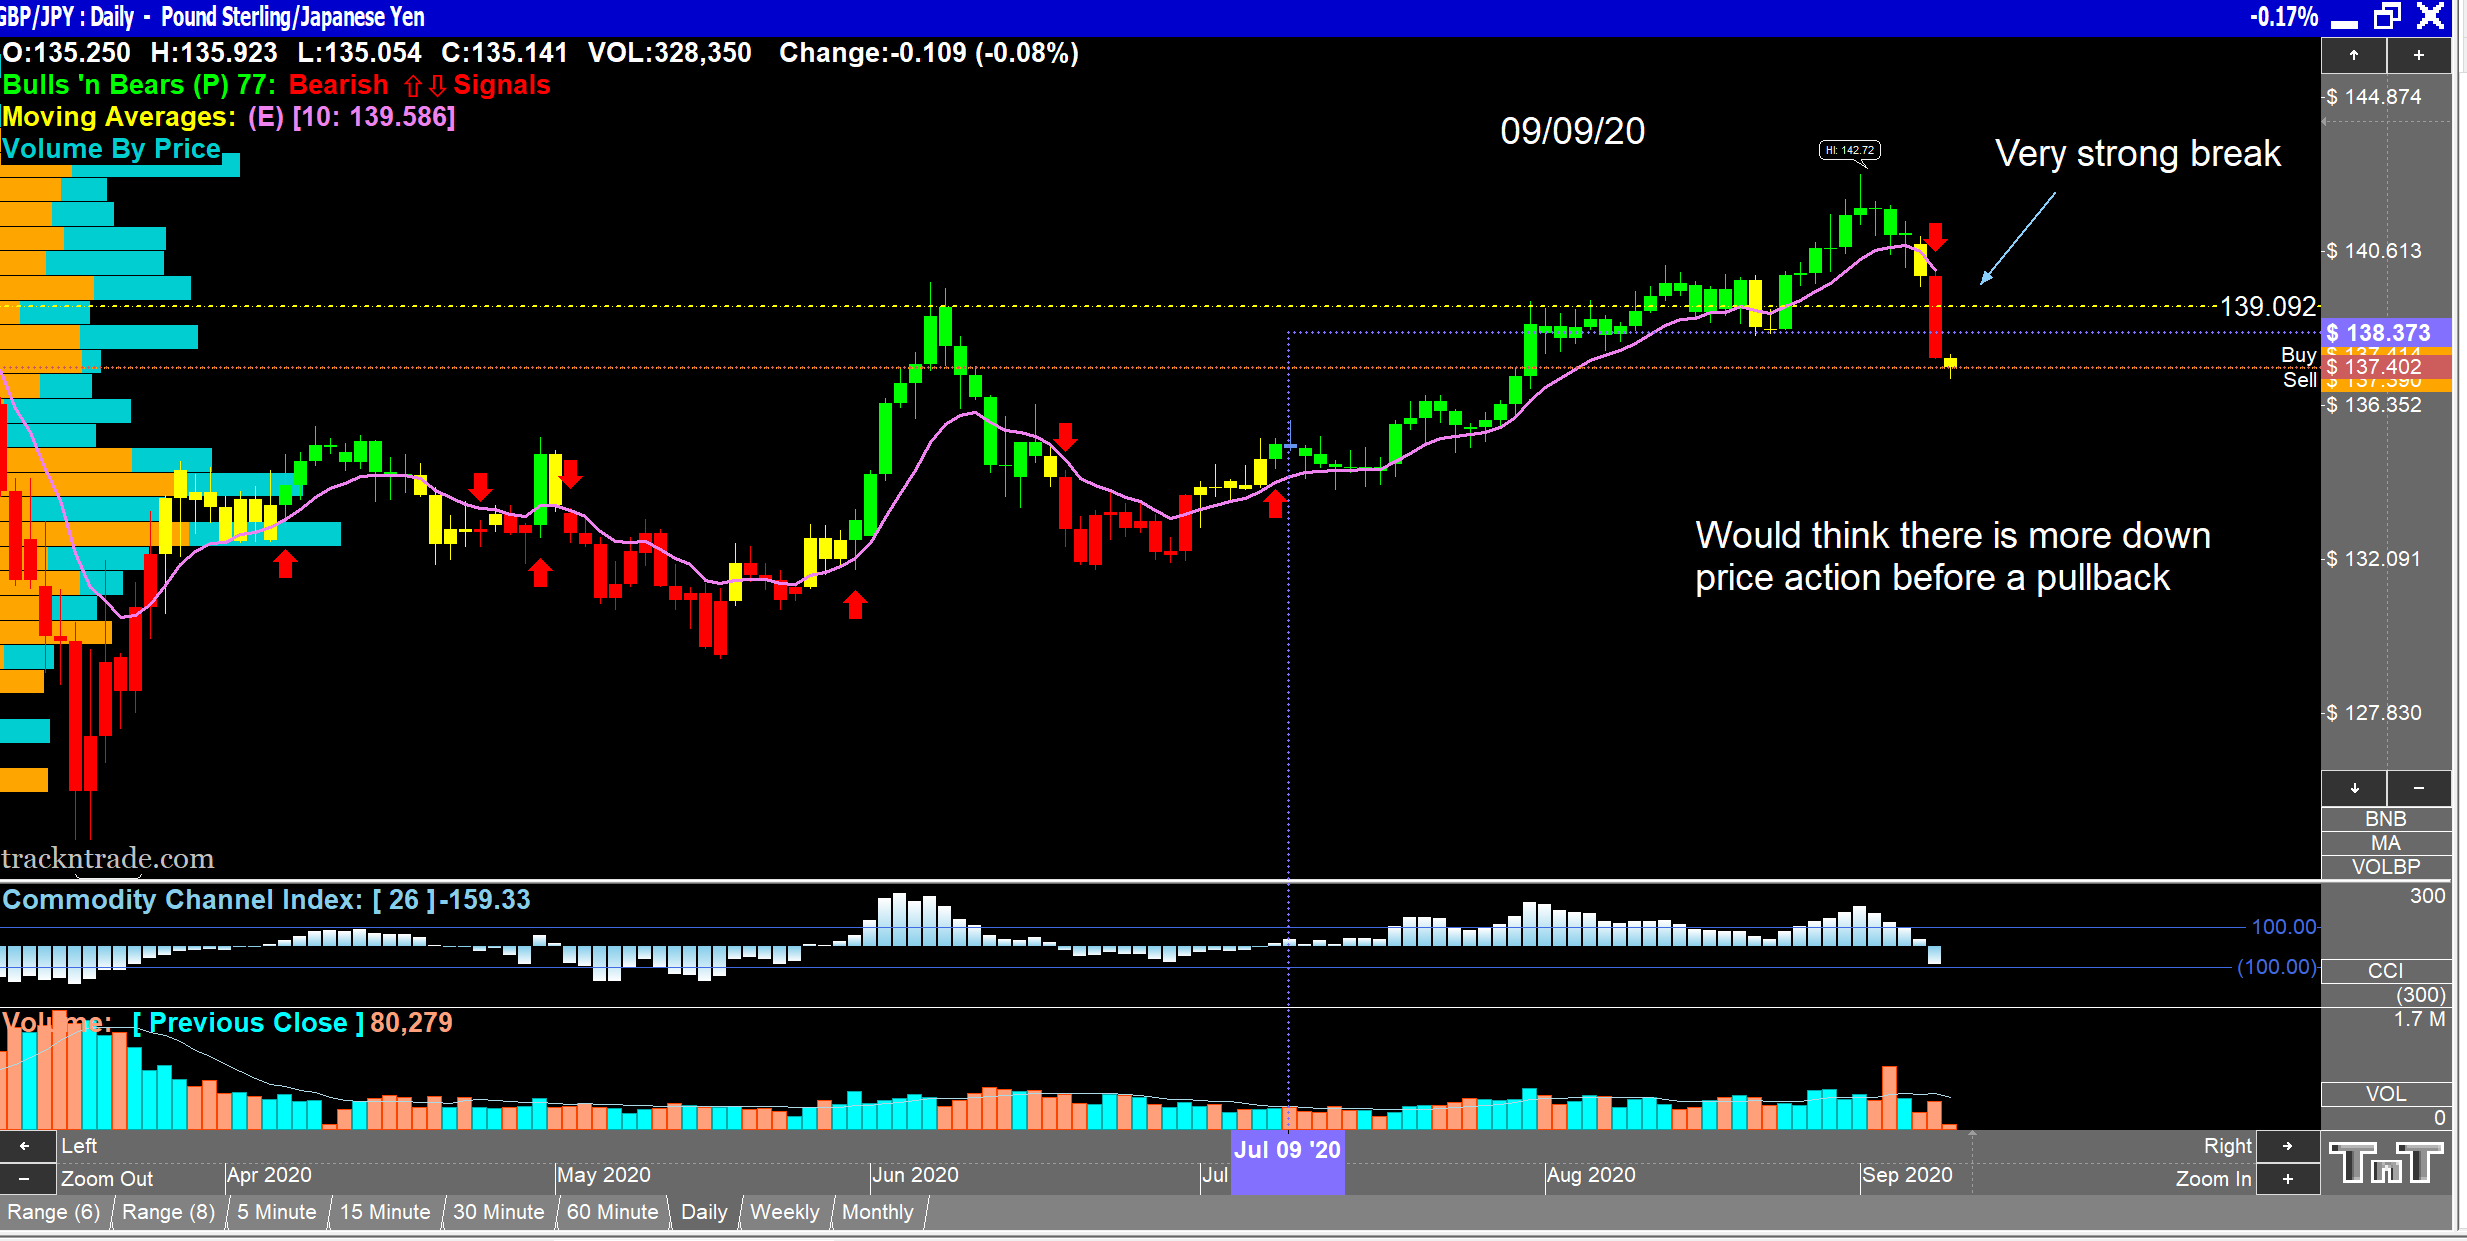
What makes you think that the level around 138.250 will see the price resume the downtrend??
Cheers
Blackduck
Hi Blackduck.its only probability trading is all about putting probability in your favour.so the reason why I think this is because price moves from supply to demand and vice versa so we have come of a weekly supply so technically speaking should travel to a weekly demand.hope that helps.sorry I’ dont reply it not allowing me to inbox me with any questions…@blackduck I cant reply because I’m new here.when price breaks market structure 9 out of 10 times will pullback for us to jump in on the trade.sometimes it doesnt and I dont take it.it could continue down or it will just touch the 4hr grey level and carry on its journey south we will see.inbox me mate.i dont trade what you have on your charts.just pure supply and demand with price action
I have been reading about S&D recently and find it to be a very interesting theory, and have had some success the few times I’ve tested it. Out of curiosity, how do you mark out your S&D area’s?
Hi matty every trader is different with how they mark the zones but for me I mark them wick to wick if it’s not to big of an area.lets say if the 4hr candle is a big bullish candle I will mark body to wick.but just be aware that price sometimes only touches the bottom of the wick and reverses if that makes sense.also I’ve not replied to others on here has I cant I’ve got to wait another 10 hours now
1 Like
Morning everyone.so the 3 pairs I put analysis on here for you all to follow.gbpjpy moved the worst wasnt a very clean move down at all.i caught about 60pips over 3 postions on gj.green lines are entry red lines stops
so today price has broken a 4hr low if I get a pullback to that 1hr 5min level.im in short please keep your eyes out


Hello where did you learn about this? I’m new myself and wouldn’t mind researching seems a topic of interest… Thank you