I see the ND on the 15 min, at 13:45 if I’m not mistaken. But how do those 5 min up bars equate to ND’s if they successively close higher? Doesn’t that invalidate them? And what about the bullish reaction to the highest VOL of the day made you look for shorts? Good trade but I’m just trying to pick your brain because I had a hard time finding a trade today. Only found a bunch of failed setups and lost a minor .6% jumping the gun before closes. Closes really matter.
I think it’s time for a video showing my last two trades. Will do asap.
That’s correct. I don’t look for trades in the middle of ranges, but I look for high Volume rejections off the top and bottom…especially the fake break. E/J has given some good examples of that in the past few weeks, look at 1hr.
And right, the range can’t be 30 pips, A ranging over a period of days. Volume can predict/confirm a range by showing strength and weakness relatively close together. Although the market is still active, buyers and sellers are about even creating an equilibrium, rather than the typical imbalance we look for on trending moves.
thanks for that! so i don´t need to edit  i am sure i listened to that stuff in a video of yours…
btw today was a hell of a day… (luckily demo but nevertheless frustrating) i think i have the stuff in theory but doing it live is just another world. yesterday we talked about mindset, today it showed its ugly face  mark douglas will be my friend for the next weeks
greetings to all 
E/G today with big volume spike on H1 just above 0.8400.
Probable reverse trend.
Let’s watch closely.
Yeah thanks for the heads up. With that down move, it’s looking like accumulation but it’s early. Personally, I’ll be looking for a push thru of that failed AR if not tomorrow, then Monday. Have to see that supply dry up.
Nice post from the first thread, thought I’ll quote it here.
U/J seems ready to jump.
I hope the news in 20 min don’t mess with the setup.
Edit: The news just blasted it…
My ibfx platform stoped working …wats wrong ? …is it same with every body ? Pls I need reply .
Back from holidays this week, first trade today.
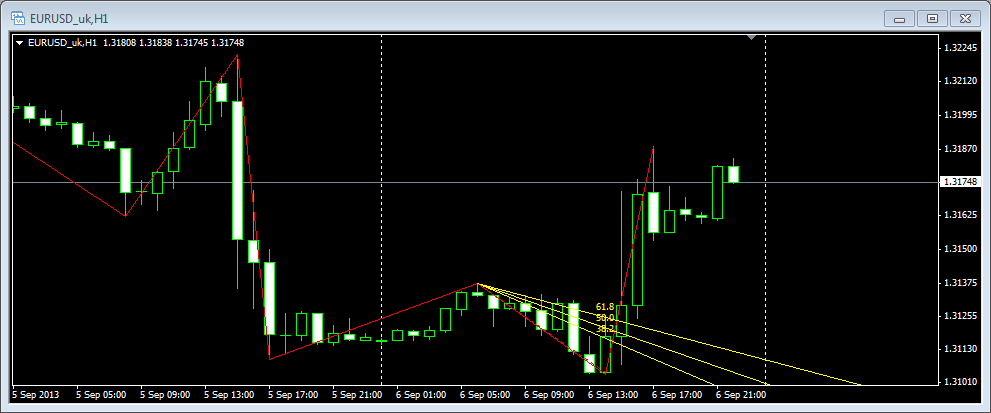
EURUSD in a downtrend, today on news we had a test of the 50-61.8 FIB area on high volume, with a sharp bearish reaction:
I entered on break of the low of the ND bar in the M5 chart, at 1.3134:
I know it’s aggressive, but looks like a picture perfect setup.
Had some problems as well. Opened a new demo account directly from Metatrader and that solved the issue.
Lost a EurAus trade , about 1.1%
I’m up for the week but I need to stop trading these non majors.
I was stopped as well. It was an aggressive trade and it happens.
E/G today with another big volume on the 1H chart.
Just like yesterday but today almost hit 0.8390. Maybe a fake breakout?
Let’s see what monday brings to us.
Warm your engines, fasten your seatbelts and get ready for the take off.
Yeah it still hasn’t had a close above that AR. I’m sort of interested however because where at a serious support, even on the weekly. I’m hoping to stay away from non majors but this could be a very long term trade.
I almost got my money back buying USDJPY at 98.92 on a similar setup. NS bar happened at 14:35 GMT.
Will be here trading and commenting next week.
Look forward to petefader’s video on his latest trades, I didn’t quite understand just like UpcomerFX.
Cordials images.
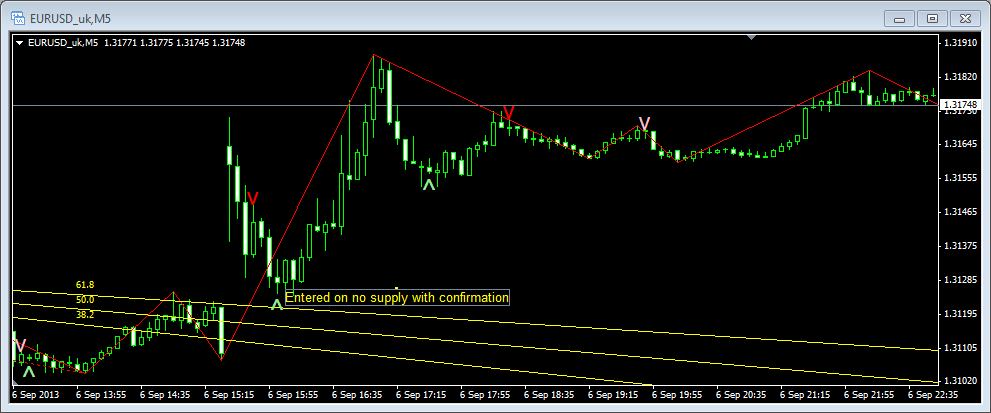
Hi Peccas. I was watching that same trade. I have a feeling you are wondering what happened. This is how I interpreted it. I saw a breakout above the 61.8% fibo fan. (Note that I have drawn zigzags on the chart which I then use to draw the fans. I draw fans when I see the end of the zigzag “hanging”, but in the picture I have posted a new leg has already been drawn. ) Wykoff calls this breakout “jumping across the creek”. ( in vsa it is called selling climax which is kind of confusing for me after reading this thread. ) When I see this, I wait for a no supply with confirmation on the 61.8% fan to enter. ( green arrow. ) This exact setup played out on many of the other pairs, 1hr chart. I always try to remember that true Wykoff is a breakout strategy, Wykoff did not like to pick tops and bottoms. Stay safe.
What is “AR”? A link please.
thx for this interesting thread my brother , 
Beside Master The Market is there any other good eBook ?
I don’t quite understand Master The Market
Can somebody explain this around in page 30
How to Tell if a Market
is Weak or Strong
Buy and sell orders from traders around the world are generally processed and matched up by marketmakers.
It is their job to create a market. In order to create a market they must have large blocks of stocks
to trade with. If they do not have sufficient quantities on their books to trade at the current price level, they
will have to move quickly to another price level where they do have a holding, or call on other marketmakers
for assistance. All market-makers are in competition with each other for your business, so their
response to your buy or sell order has to be realistic and responsive to market conditions.
If the market has been in a bull-move and you place a buy order into a rising market, you may receive what
appears to be a good price from the floor of the exchange. Why are you receiving a good price? Have
these hard-nosed professionals decided that they like you and have decided to be generous giving away
some of their profits to you? Or have they now decided to start switching positions, taking a bearish or
negative view of the market, because their books have started to show large sell orders to dispose of? Their
perceived value of the market or stock may be lower than yours because they expect prices to fall or at best
go sideways. Such action, repeated many times across the floor, will tend to keep the spread of the day
narrow, by limiting the upper end of the price spread, because they are not only giving you what appears to
be a good price, but also every other buyer.
If, on the other hand, the market-maker has a bullish view, because he does not have large sell orders on his
books, he will mark-up the price on your buy order, giving you what appears to be a poor price. This,
repeated, makes the spread wider as the price is constantly marked up during the day.
So by simple observation of the spread of the bar, we can read the sentiment of the market-makers; the
opinion of those who can see both sides of the market.
Frequently, you will find that there are days where the market gaps up on weakness. This gapping up is far
different from a wide spread up, where the market-makers are marking the prices up against buying. The
gapping up is done rapidly, usually very early in the day’s trading, and will certainly have emotional
impact. This price action is usually designed to try to suck you into a potentially weak market and into a
poor trade, catching stop-losses on the short side, and generally panicking traders to do the wrong thing.
You will find that weak gap-ups are always into regions of new highs, when news is good and the bull
market looks as though it will last forever.
Master the Markets 28
You can observe similar types of gapping-up action in strong markets too, but in this second case you will
have an old (sideways) trading area to the left. Traders who have become trapped within the channel
(sometimes referred to as a ‘trading range’), either buying at the top and hoping for a rise, or buying at the
bottom and not seeing any significant upwards price action, will become demoralised at the lack of profit.
These locked-in traders want only one thing – to get out of the market at a similar price to the one they first
started with. Professional traders that are still bullish know this. To encourage these old locked-in traders
not to sell, professional traders will mark-up , or gap up the market, through these potential resistance areas
as quickly as possible.
Chart 3: Locked-in traders (chart courtesy of TradeGuider)
Here you can see that prices have been rapidly marked up by professional traders, whose view of the
market at that moment is bullish. We know this because the volume has increased, substantially backing
up the move. It cannot be a trap up-move, because the volume is supporting the move. Wide spreads up
are designed to lock you out of the market rather than attempting to suck you in. This will tend to put you
off buying, as it goes against human nature to buy something today that you could have bought cheaper
yesterday, or even a few hours earlier. This also panics those traders that shorted the market on the last
low, usually encouraged by the timely release of ‘bad news’, which always seems to appear on, or near, the
lows. These traders now have to cover their short position (buying), adding to the demand.
Note from the above chart that the volume shows a substantial and healthy increase – this is bullish volume.
Excessive volume, however, is never a good sign; this indicates ‘supply’ in the market, which is liable to be
swamping the demand. However, low volume warns you of a trap up-move (which is indicative of a lack
of demand in the market).


