The thing is though, it’s a typical Monday, nothing clear, it’s just meandering along, Tuesday’s are often the same, it’s a good idea just not to bother!
hey guys, just taking a look…I’m not going to try and pick the bottom of this move today. I’m planning to make a video though. 
In the meantime, some of you might want to watch the previous videos again and brush up before getting this new information (new to some, I showed this stuff a bit in the old thread). It shows 2 additional entry types!
It should be uploaded at some point today.
Exactly, nice going stepping back for the big picture. No rush on finding the bottom…take a look tomorrow.
There is also the Oct. 4th low near by.
I’m sure all of us are looking forward to the video. I’ve spent the afternoon fooling around in Alpari’s MT4 platform. It’s spreadbetting, so tax free, but using MT4 for placing and managing trades isn’t exactly easy compared to the likes of Oanda. Do any of you use MT4 for placing your trades?
Question: Is there a way to stop it from scrolling to the most recent candles when you change time frames? i.e. going from hourly to 5 minute on historical data? I then have to search back to find where I was every time I switch time frames. Thanks!
I’ve talked about this setup before, but at this point I’m limiting it’s exposure by not making it available to the general public on youtube. It can only be found from this post, enjoy. 
The sound is delayed by about 5 secs…not sure why, the original is fine. Sometimes I’m pointing at something just before I am talking about it due to the delay, but I think it’s ok for now. I’ll try to fix it, already uploaded it twice.
This one’s for the core group that’s been following me. Go forth and multiply (your account balance lol).
*video removed and reposted.
Thanks for the continued information Pete and Core. On behalf of myself and the rest of the “silent core” who continually follow the thread.
And another great video, thank you for that! 
I did use this approach a while back if you remember? But honestly I haven’t had a thought about it lately, maybe it’s because I’ve been trying out a few other approaches :p… Anyway, thanks for the reminder. Feels so much safer to enter a trade that way.
Excellent video Mr. Fader! Really took a lot away from that. I’m excited to try and spot these situations as they develop.
You mention not trading after 16GMT (ideal as I live in UK), but am I missing other potential trades pre and post 16GMT in other currency pairs other than the EUR/USD? Which pairs do you tend to focus on, and do you only stick to pairs that include the EURO and USD as they are likely to be higher liquidity?
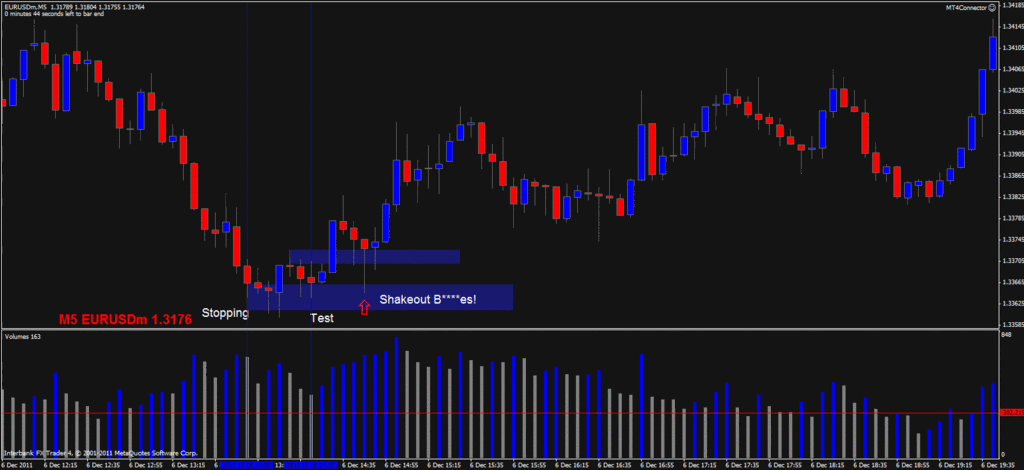
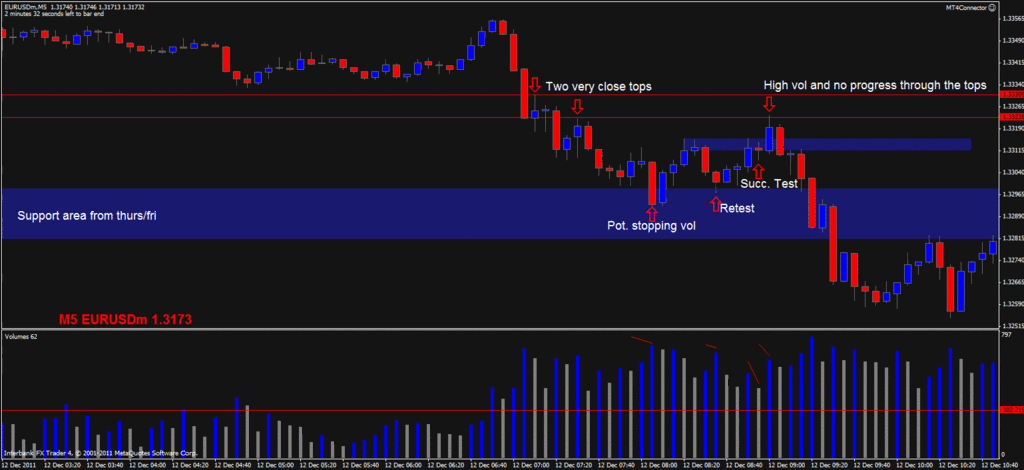
Cool guys…now we have 3 entries to look out for. 1. Simple nd/ns. 2. Push through supply (or demand) and 3. A low volume, nd/ns test of that supply/demand level, with a possible spike into the old range (aka shakeout).
Don’t forget 1hr background, simple s/r and fibs.
For now the video is posted with the 5 secondish delay in audio, but I’ll fix it…so the video might disappear/reappear.
Here ya go. Audio in sync. 
Yep, I did get into this setup a bit in the old thread, but I’ve been waiting to unleash a video until we had some new people that learned the basics. Taken out of context, noobs could be looking for this setup in the wrong places. This requires some more judgement and time spent looking these these reversal points…which a lot of you have now.
Thanks Pete, I think the video is perfect. It is very clear and nicely explained. It’s great that you’ve found so many real life examples in the chart.
It is basicly a strategy how to [B]SUCCESFULLY[/B] pick the bottom/top, am I right?
Then we have some kind of basic S/R levels, and then of course traditional fib entries with ND/NS confirmation. So that makes 3 basic patterns.
As you all can see, it’s important to train your skills in finding ND/NS (because that’s a confirmation) but it is ALSO important to remember and look for the patterns Pete teaches here. And something tells me, this is not the last thing he is gonna show us.  …
…
Thanks Pete for spending all this time on teaching the noobs like me.
whats going on with EU right now in terms of SM activity ? what phase is it in ?
anyone ?
thanks
It’s Mark Down until you see stopping volume.
Yep. Traditionally VSA has been unclear about this (pick tops,dont pick tops). This new video gives a clearer picture of what your looking at after a climax. So you don’t need indicators (Tradeguider diamonds, and Hull moving average etc.) to have a true confirmation for reversal.[I] I would say it’s more VSA than tradeguider is[/I]! The best part is that you have a few chances to get in based on your level of aggressiveness.
With all this reversal talk…never forget that simple ND/NS entries during a trend, on the 5min to 1hr are valid until you see climactic action. It’s just such a simple entry we end up talking about reversals much more.
Today a ND short was given on the EU 1hr at 13 gmt, if one had the Ballz to short so low (I did not lol, plus support to the left).
After watching that video, can anyone spot where the “shakeout” comes in to play now? 
This is pretty much just a guess. But I would say after the second bottom and when it gets back to the top of the automatic rally. They slam it down so people think it got rejected by resistance. Then it returns for an easy climb.
That video is pure gold. Clears up so much. Cant say thank you enough!
You’re welcome. 
That’s correct. The quick pop back in and out of the old range after the push through the auto rally point, with a significant volume increase. Next candle goes in the direction of the trade for entry.
Something has been bothering me about the trade Tassiefx posted this morning. I have no doubt had I been awake I would be right in there as well, and would have taken the same loss. That was a great setup and you should have no shame in taking it. I agree the stopping volume could have been higher and a tail on the bar would have been nice, but I dont think I would have considered that at the time.
Pete’s video came at a great time, and I think it explains why the trade was a loss. Actually, the setup and trade was a success in my book, it resulted in a rise in price. It just hit an area with alot of supply. I didn’t point it out on the chart, but look at the first bar with an arrow. It’s an up bar closing in the middle on high volume, weakness, there is supply in that area. We would have just had to been on the ball and watching how price reacted once it got there, and react accordingly. The exit should have came on the reaction to that area of supply for a small gain or BE. This is a good lesson and one I will keep in mind. Before taking a trade, see where it might run into trouble and be ready to act. Sorry for your loss Tassiefx, Im just glad I was snoozing.
[http://i1090.photobucket.com/albums/i361/Blessed444/whydidthisfail.gif[/IMG]"]
]([IMG)edit: How do I get my charts to be so crisp and clear like Dodges? I use photobucket and use a link. When I save as pic, I choose active chart(as is). What am I doin wrong?
Just wanna make sure I am looking for the right thing. This seems like a perfect shakeout.

