Trading is simple, but not easy
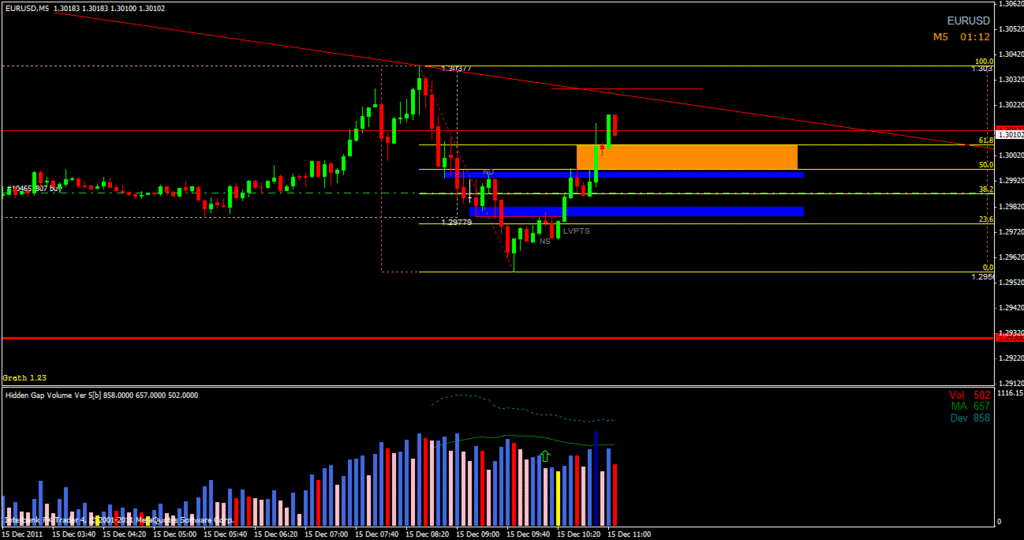
any idea what 's going on with E/U this moment? we had breakout and seem to be rally but then we have 2 pullbacks with big volume…
We are now in mode of selling the pullback, but imo, we’ll be in the range 1.3030 to 1.2950 for a while
Watchin GU personally, hopefully we’ll get more climatic action here
well SM,…here come cheap priece again… just tell me when you really gonna move up ok? LOL :53:
Move up? Why in such downtrend and you think about upmove?
As I recall… Pete said the longs are on… Due to the recent sell climax on H1 which stopped the down move…
I’m not going against Pete, but here is some food for though
2011-12-15_1723 - pkinluv’s library
I’m not going to go against that volume. I’m still lookin to sell the top.
It’s looking very much like Accumulation now on 5m, and a weak down on 1Hr, so imo careful, but longs.
And if I’m not mistaken (which I could well be) we’ve also just had what looks like a shakeout on the 5m.
Long off the No Supply 5m 61.8 Fib 1.2992, I think there’s mileage in it.
i gues its too risky…u are kind of agresive today…lol
Entered long at close of the low volume push through support. Pete, what do you look at to draw your support/resistance zones? The one from yesterday looked really sharp defining the supply zones. Am I close on this?
Entered long at close of the low volume push through support. Pete, what do you look at to draw your support/resistance zones? The one from yesterday looked really sharp defining the supply zones. Am I close on this?
Nope, not much risk in that, nice tight stop, good entry point.
The NS you have marked is not an NS, there was a close below it before the close above, the next one is though, which is where I entered long.
edit: I don’t mean the next candle, I mean the next NS!
and if you’re right… then the trap area has been wider… SM need absorbing a lot before marking up… what a bullish market we have later…
guys,…
i trade live MT4 with my local broker here whilst observing another MT chart, same pair same TF of my demo account with IBFX. it’s quite compelling when i try to notice the volume…it’s just different…so that sometimes i miss the entry… see attached… any explanation and suggestion? thanks
every broker’s tick volume is different, the peaks and troughs and NSND are invariably in the same places though, but as a consensus and for comparisons it makes it easier for all of us to use IBFX.
Hey guys…here’s my take.
1hr showed proper stopping volume yesterday, so it’s accumulation but…
The 5 min shows a decent amount of supply on up moves still. (up moves stopped on increased volume)
So, if you are smart money and you are accumulating, you would let that supply bring price down for you to accumulate (buy) more at lower prices…and ideally a fake break out below support.
In accumulation…the remaining supply is SMs best friend, it allows them to continue to buy low. There is no reason to fight it. Once it gone, then they know they won’t get lower prices, so they “switch” into markup mode.
With all the supply showing up here…I’d bet SM is going for a fake break below support to…
- hit stops on longs
- suck in breakout traders going with the “trend”
- get a better price to TP shorts, still on the books
- Get a better price to add to their buy position
Maybe that will happen today, maybe not, but we know SM is hoping for it. Either way, we know exactly what they are doing now, and so the story continues…
