Yes, there was a ND on the 15m, and then NDS on 5m, so took 30+PIPS, it might go further, but on the whole it doesnt move much more than that in the morning. A combination like that on the 5m and 15m look to be, very good ‘bets’
But that’s looking like a volume spike on the 1HR, so I’ll be looking for it to consolidate over the quiet part of the morning, and a long on the NY Open, now watch it do something completely different.
Thinking [U]once[/U] in a while would be a huge step forward for most. Thinking twice would be awesome. No, I am not referring of anybody, just what went through my head right now regarding crowds and thinking when I read that comment, lol.
Thanks btw. for the webinars, Pete. I’ll watch them if I have more time for it.
Before I came across this method I always wondered why long candles (stopping volume) would almost always reverse even though classic candlestick analysis tells you its a sign of strength. Then my eyes were opened!
I’m about 45% of the way through the previous thread (Tough Work lol) but what I have learnt already is making me a better trader. I’m quite new to trading but soon after I started I came to the conclusion that indicators lag far to much to get the desired effect you crave. Still aborbsing chart after chart but I hope soon I can trade along with you guys very soon! Have a great new year guys especially Petefader!
Have been going through the ‘1500 pips per month…’ thread and one of you guys mentioned something about an indicator that predicts the volume size of a candle as it progresses…is that right? Can anyone point me in the direction of this?
Here are the latest version of the ‘indicators’ I use, but remember to use the ‘prediction’ as a guide only, never it use it to trade off of, only trade confirmations, with very few exceptions.
Welcome to the new year!! May it be a profitable one
Quick question. For this method we are mainly drawing Fibs on 1hr chart right? Also, do we go any higher to identify Phase, like 4hr even though volume is mostly session related at this level?
Actually, I asked because I am sure I read something through the thread recently that said we are not really using 5m fibs so needed to clarify. It would be a huge ask to trawl back through 400+ pages in 2 threads to find that exact point. Thanks for clarification SagiCZ…
Ok, I might be a bear with a very sore head this morning, but at best comments like that wind me up so much, trawl through the 400+ pages and after that we might on this thread just about feel inclined to help you on the journey to becoming a successful forex trader.
Yep … you might have a sore head with a reaction like that taking my comment out of context…considering the amount of times I have also expressed my gratitude to y’all through these threads…So I am prepared to cut you a break this time…;)…cheer up me old mate.
BTW…I regularly ‘trawl’ back through the threads regardless…but did not think it would put someone’s nose out so much asking for a simple ‘clarification’…that is what the thread is for right ?..
No worries me old mate…any and all help always appreciated…for the head…some Vitamin B and plenty of water methinks
This year is gonna rock I am sure…may it do so for you.
We use Fibs for reference, we don’t look at anything higher than the 1hr, Volume can be relevant at a higher timeframe, but you are into a different ball game.
I think if I’m right the basics of the strategy is to trade ND/NS with the trend on the 5min (I really do like the 15m for them too, if I see one on the 5m and the 15m at roughly the same time, I’m ready for action, trend is established on the 1hr, and we look for stopping volume to stop trading with that trend and start looking for possible reversals.
Just a quick question if I may, Would you guys class your entries as getting in on reaccumulation or redistribution? Is it also possible to use VSA to scalp if you haven’t got the time to wait for entries? (Due to university and all that)
Sorry If this question has already been answered I’m halfway through the old thread and it’s gold.
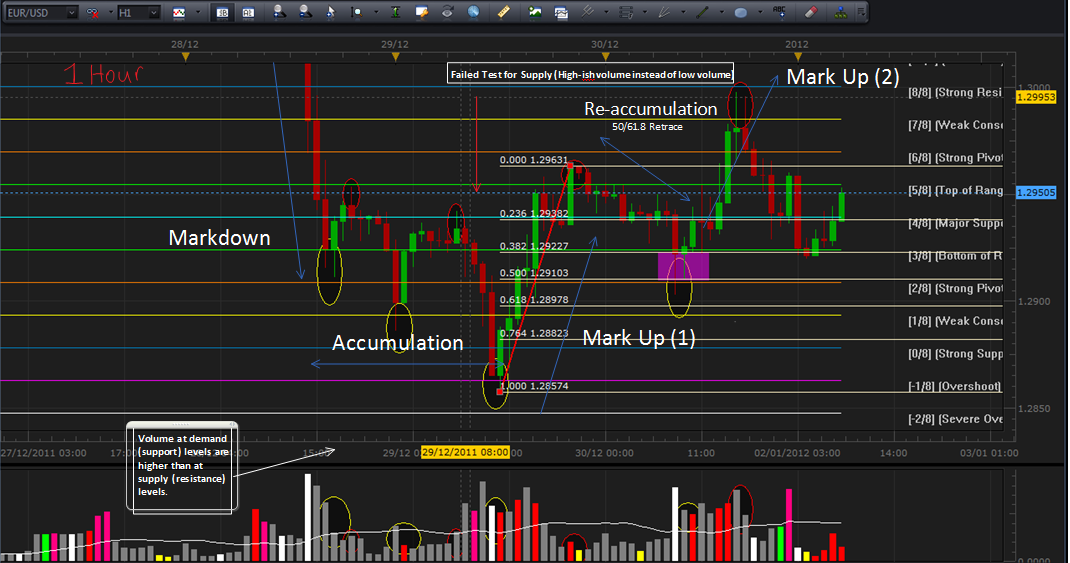
Thanks for the reply. What I meant to say was specifically, are your class of entries where you wait for a retracement of the first markup or markdown on [U]50/61.8 fib area[/U] (reaccumulation or redistribution?) then you guys proceed to profit from the next markup/markdown phase until either another bout of reaccumulation/redistribution or the end of the markup/markdown phase?
I hope this makes sense just trying to apply theory
Ok subs, you need to clarify your No Demands and No Supplies, it look like you are getting them wrong, my NDNSHistory indicator will help you with that, also I don’t think I’d place my Fib where you have done, it’s quite a messy area, higher risk, the last high you have on the chart might well be a safer retracement point.
The first part of my comment is 100% correct, the rest is subjective, but a general rule you can use in trading is, that the simpler and more obvious it looks the better the trading opportunity, the harder you look, the harder it is to trade!