Very true PPF. Need to read this thread and find out that they are trading all the instruments that we do not. Lighten up your chart a bit with plain volume, maybe a daily pivot and use fibs. So much less cluttered and you might see some more in the charts 
Heres for looking stupid.Looking at a reversal at 1.3344. 30 pip stop, 100 down, all the best.
Mike
That’s pretty random, especially because price isn’t even there yet! :30:
Thanks for your response. Weekly pivot, daily fib. Not random. All the best,
Mike
Hi Tassiefx
The reason i entered long is as Traderjoo said ealier, alot of buying yesterday and overnight and every valley has a pretty decent volume increase since after the big rally. I took it as strength. And yes i did know there were news and i believe SM know exactly where the price was going thats why they were long. Maybe it is not pure VSA but I just follow what volume and PA told me.
Did you get any trades in today?
Yes, I wish I hadn’t though 
Quick questions regarding session times -
- can vsa for a certain currency pair only work if its during their trading session?
- traderjoo has mentioned safe trading during 08:00-16:00GMT timeframe, I suspect you mean this is for gbp and eu?
- I also see people mention ‘getting late in the day’ of a certain session, is this because of reduced activity/unpredictability?
In my opinion, eur/usd distribution. Missed the 30 pip drop. Just missed my 1.3344 target. May try to spike out of range. On the side lines till it becomes more clear. Cheers,
Mike
Agree with you mikeytrader1. If you look at 1H eur/usd chart there is much more volume on top which means SM is selling/taking profits.
- it works outside as well, but it’s a bit more painful to decipher fact from fiction, as I say this, don’t dismiss what happens outside of trading hours, there are little hints and pieces to the story that happen in the “off” hours
- yes, biggest action seems to happen 1300-1700, so being around from 0800-1300 you can see what’s being done to lead up to it
- yes, you won’t see the same pins, relative volume is harder to gauge, just less liquidity
Thanks for the vote of confidence. This is my week off, but can’t ignore the charts. 1.3344 is the number. Think there going to kick past it berfore the hard sell.Allthe best
Mike
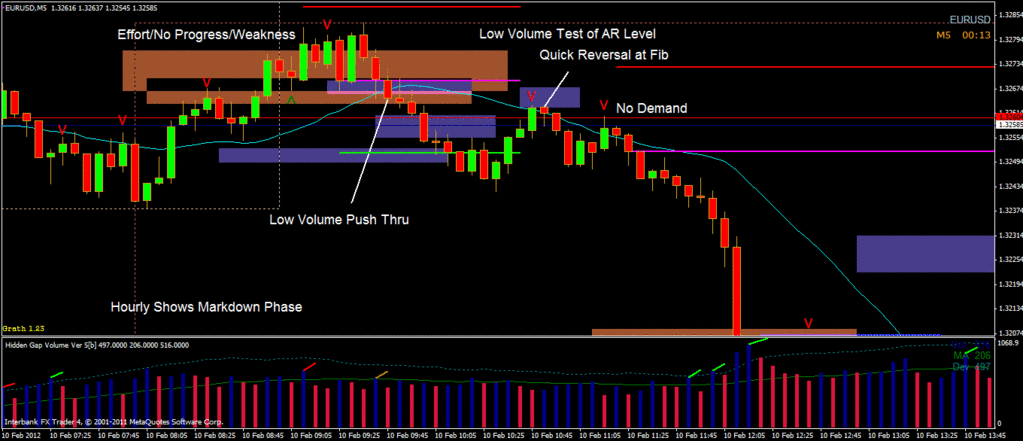
Hope you guys caught the E/U Weakness/ND short at 11:15
Oh yes, and the GBP at just about the same time, they were ripe for it at last, didn’t stay in for the long haul, but took some very nice profits and took the rest of the day off, finished the week off nicely, especially after yesterday’s I need kicking myself for taking such a trade 
Hi Fella’s
Just wandering if my analays of the 1 hr eur/usd chart is correct or not?
Stopping volume marked,a push through supply on low volume (not much interest from sm)into fib zone.
Will probably go into a range for awhile before deciding which way it wants to head.
All responses appreciated,
Thanks
To be honest I missed it completely.
Got a pic?
I didn’t see it as it formed and it (to me) didnt appear to form in a definate zone of relevance.
Maybe its just me, but I look at that and fail to see any sign that says sell, only in retrospect can I say 'ok maybe. ’
That’s the gap up from the buying that occurred after 1500 GMT on Friday. It’s WAY to early to be trading E/U, wait til London open, you’ll save yourself a lot of headache.
Hello, how are you all?
Pete, how are you?
Stick to your guns and take the day off, it’s the best thing to do on Monday’s, I always take Mondays off now, just as a matter of principle, because my previous bosses can’t!

