This is a 1-minute Heikin Ashi chart of the USD/JPY. The green line represents my entry long, the red is my stop loss, and the faint blue line at the top is my initial target based on a 1:2 risk/reward.

Technically, this is a swing trade, even though it is on the 1-minute chart. Determining whether it is a scalp or a swing is not dependent on the timeframe. Rather, it is based on the amount of risk taken compared to the reward. In this case, my risk is about 4.5 pips, and my reward is right at about 10 pips, making it a swing trade. If I were scalping, I would get out quickly with a 1:1 RR or less.
As with swing trading, you often get a bad entry that takes a while to get going. That was the case here:
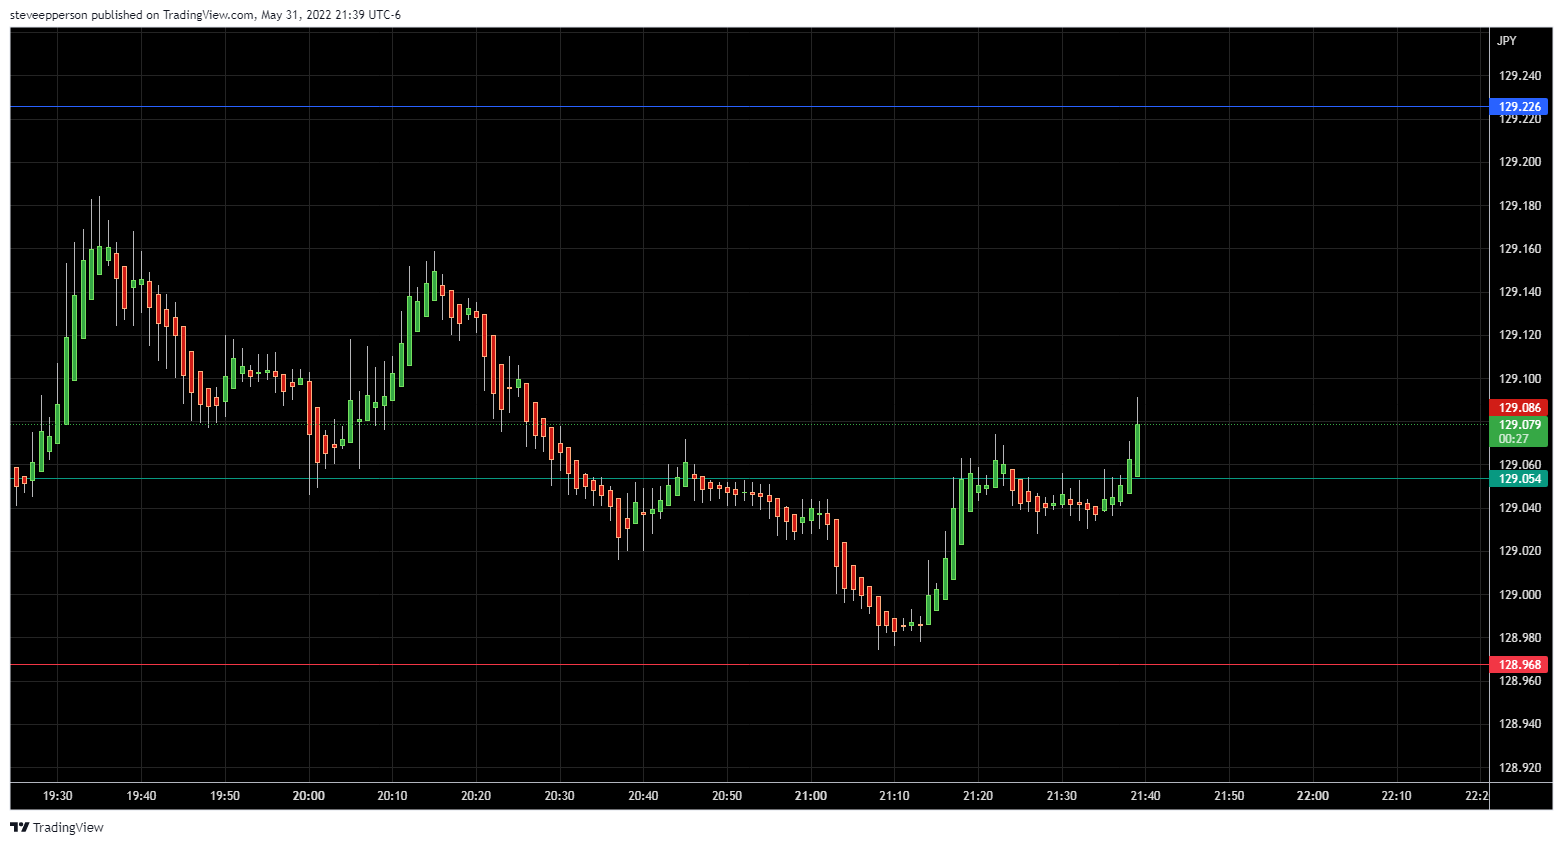
It was an ugly setup, but it finally got going after several bars. Judging from the first two pushes up (motive waves, if you want), I realized that the overall move was probably too weak to hit my target. Instead, I settled for a 1:2 based on actual risk instead of my initial risk. In fact, I was a ble to move my stop to break even and take profit at the next resistance zone:

the Hekin Ashi candles smooth out the price action beautifully. This allows you to see the swing points without the need for indicators. In this case, you can see the higher highs and higher lows developing nicely, forming three small pushes to resistance. But that was just enough to take a swing profit.