One most important lesson in ATT I learned is inactivity is regarded as a “position” in the markets. 
I have no idea Matt.
As DoubleEcho stated, if market conditions aren’t offering us satisfactory or acceptable opportunities to trade based around our usual prep & trade criteria then we stand aside until it does.
Fortunately we’re in a position where we don’t have to adopt or absorb unacceptable high frequency risk exposure on a daily or weekly basis if we don’t want to.
There’s absolutely no future in that exercise. We’d rather hand the elevated risk conditions across for others to absorb.
I guess if your arm was being twisted to take something on this week then the opportunity we highlighted back on Monday regards the 1.3870-90 level on eur/usd would have been a likely candidate?
You missed the first pullback opportunity today if you were in Europe as it played out during the Tokyo business morning, but you got a second bite of the cherry when it pulled back into the late morning London action.
Yes it is here where I saw andre saying to me about if the price not able to be supported at the lows of last Thursday and last Friday then to prapere for sells. and your chart telling us about that zone also. To sell from there on the way down to 13700 area of last week lows
As you say corectly again, the prices fall there and gives the chance for us to sell for the pullback. it is a nice trade for today.
When you’re looking to place your bets, especially intraday positions, it’s critical you ensure that the value is heavily biased in your favor to offset the risk outlay.
2 of the most important factors in that equation are the available upside/downside capacity before price encounters the next supply/demand hurdle & how much of the instruments normal average range coverage is left in the tank to assist in your objective.
You’ll give yourself a lot more breathing room if you try to ensure at least those two essentials are onboard when you’re constructing your bets.
By the time you placed your bet on that Cable long on Tuesday it had already covered virtually 90% of it’s current average range.
Although the set up looked tasty & conformed to the type of technical behavior we’ve consistently highlighted on here, it failed the most critical part of the entry criteria in not offering sufficient forward value v/s risk.
Yesterday’s short opportunity however on eur/usd ticked that critical criteria box & offered up good forward potential in sync with more than acceptable value for those seeking a decent odds intraday bet.
Average current days range across this pair comes in at c150 pips.
From the point of entry at that 2nd pullback opportunity price had only covered 30% of its range, leaving more than acceptable capacity in the tank & sufficient downside to last weeks lows at the likely demand zone around the 1.37 level.
The days high up at 1.3877 minus 150 pips focuses the 1.3725 area as a gauge for booking intraday profits.
As prices roll into that zone into the New York afternoon session & begin attracting bids ahead of the round number/prior weeks lows, that’s your likely signal to start heading for the exits.

I still remember Tess and Co mention about using an indicator to gauge the daily trading range. Do anyone still mention what is that? 
Ray, Since you asked, and as some of you guys know I am an indicator writer junky (Still have the addiction even though I dont rely on them any more  ), and the system that i am trading relies heavily on ATR. Here is a little MT4 screen printout indicator thatwill let you know how much of the weekly and daily ATR has been used thus far. The bottom two will change colors once 65% for the day/week has been reached.
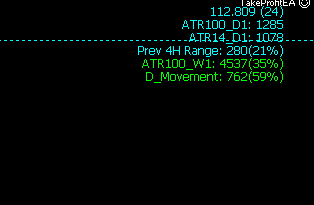
P.S. Pay no attention to the EA, its simply a way to manage my manually opened trades when I am not around.
Husky_FurquadSP1_Data.zip (8.97 KB)
Thank you dancat.
But did you see performance of pound ? Nice moves today
Let’s change our sentiment of US Dollar to bullish.
Also we should wait till Friday NFP news to confirm our perceptions.

You could get another view of the greenbacks colors by dialling into the Index to mark out one or two close quarter upside/downside hot zones.
That might help to cross reference against the mirror levels on your majors of choice
Relevant potential reaction zones were marked out last Friday, which identified 76.75 & .25 as the likely downside pressure levels with 78.25 the clear upper range reaction top.

The buck continued it’s bearish lower high drift on Monday from Fridays (shaded) marker, down to the first support ledge at .75 & by maintaining the bias of buying dips on the eur/usd, the value $ short position still remains the higher odds play until the Index can press back above it’s prior lower high steps.
It now finds itself struggling & pressured at the lower 76.25 range supports & really needs to pump some muscle around here to gain traction.

Failure to put on the brakes & generate some positive action at this secondary support zone opens up the 2008 summer lows of 71.5-72

Thanks Tess for so detailed review of US Dollar Index.
In previous post i made prematurely conclusions, even not waiting for the close of the day.
Tess, do you pay attention to correlation between US Dollar, Oil, S&P, Gold, when you’re analyzing bias and global flow of money?
Thank you
Yes we do.
It’s not a bad idea to be aware of & conversant with the potentially reactive levels & zones on those instruments.
gold @ 1315, oil staking claims @ 82.50 & 1195 on the S&P are all psychological focus zones for the market players.
Money is interconnected right through the investment engines & what impacts one unit will filter through & influence another.
Thank you Sean P for your clear answer.
Today buy scenario on EUR/USD

eur/usd weekly resistance.
Time to take some profits from buying positions.

If you’re trading purely intra-day moves by going long on dips then keeping an eye on the average daily range would be one option, & the level you’ve indicated on your chart at the 1.4250-60 area more or less covers todays range on eur/usd.
However, when strong influences or psychology are evident in the market such as recent events, prices can get stretched way beyond their limits & carried along on extreme bullish & bearish sentiment.
Given the reaction to the Feds quantitative easing rhetoric, & should the $US be unable to absorb & defend the negativity, then traders will have this next channel in their sights, which can be viewed clearer by zooming out on the daily chart.
The lower swing levels are clearly identifiable on the hourly charts for reference as prices react to profit taking or changes in short term bias.

Good explanation carll.
So, we can enter a trade as intraday trade, and hold it as position trade.
You got that right.
Cable has so far put in 150% of its average range & if it wasn’t for the fact traders will be squaring off & booking profits ahead of tomorrows payroll numbers, New York might have considered shouldering this a little more.
Still, another day another dollar huh!
God bless the Fed & all who sail in her – or should that be sink in her?!
New week new setups)

The Dollar does give the impression it’s gotten a bit extended to the downside, & there’s not much data this week apart from the G20 meeting to whip up volatility.
Below last weeks 1.3863 lows, I’ve marked out the 4 hour swing levels of 1.37 – 1.3750 for the heavier supports attracting fresh bids underneath the current price.
Low data weeks have a tendency to drive price action into range type conditions, so I wouldn’t be surprised to see a repeat of that until the next major market influence pops up to drive the sentiment.
I also assume we’ll now be entering into year end position squaring where traders will be content to book profits up at the top end of some of these large runs.

Nice setup. But i saw it post factum.

Be careful you don’t get stranded in no mans land trying to trade support & resistance exclusively off those small micro timeframes Ingvar.
They can signal quite a lot of false starts down at that level, resulting in frustration & anxiety, particularly if you get on the wrong side of a longer timeframe trend.
You would have been quite safe today on eur/usd as it reversed off it’s average days range at 3970 so your highlighted entry more or less confirmed the reverse short.
As catcher mentioned yesterday, prices are bouncing around in range mode so far this week & euro, as with Cable have covered their average daily ranges in both upside & reverse downside moves today.
Tess & her colleagues tend to advise flagging up potential opportunities from the larger timeframe support & resistance levels & then dropping down to a smaller timeframe & using that as the trigger entry if that’s your preference.
I think you’ll find that will yield potentially higher success averages than focusing exclusively on micro timeframe analysis.