You’ve got the structure of your plan in place – that’s to be commended! 
How is that type of filter working out for you Jimmy?
Does it stack up ok in regards computing acceptable risk v/s your end reward results?
You’ve got the structure of your plan in place – that’s to be commended!
How is that type of filter working out for you Jimmy?
Does it stack up ok in regards computing acceptable risk v/s your end reward results?
Too early to tell. I have noticed that price usually spends most of its time on one side of the open. It seems like a reasonable filter to add to help keep me on the right side of the flow. Of course I take into account avg daily range, so even if price is below the daily open but close to its daily range, I am less interested in selling, and vice versa for longs.
But I also don’t want to be too rigid in my approach. I guess right now it’s a balancing act, more structured / specific rules while I learn the ropes VS being able to take advantage of all opportunities as they present themselves?
I’m not at a place in my development where I can look at the market for what it is and be ready to jump on all opportunities. Like Tess mentioned once, it’s a process, as I go, I add things and drop things, working towards the point where I can earn my living from my trading activities.
On a side note, I have been reading [I]The Alchemy of Finance[/I] the last few months, and it has changed the way I am approaching my trading. I’m no longer in it to [I]make money[/I], I am now viewing it as the perfect self development arena. Like Soros says in the book, it’s easy to deceive ourselves and others in almost every other situation in life, but our results in the market having a tendency of showing who we really are. Right now my focus is on becoming a more self disciplined individual, and I am using my trading results to gauge where I am at on that journey.
Interesting that the move down today stopped right close to the EU average daily range. Food for thought.
that’s right, you’ll catch some good entries at those types of price edges. You’ll also be able to get a hold of some bargain basement risk stop placement areas too.
Are you tracking the smaller timeframe in step with the higher timeframe using this type of price action model quitter? Kind of like using a 30 or 60 minute as your leader & entering off a 15 minute timeframe?
I have an easier idea. Let me just jump into a long here. Price will drop like a rock once I’m filled 
Ha ha ha 
Here’s our irritation for the moment.
Dollar requires an oil change & a new set of tires.
A drop below that 79.5 trapdoor opens up a trip back to 76.5
Lot of gas being burned over the past 4 weeks.

A clearer view of it on the Hour chart

That’s probably one of the most welcome & important additions to my everyday trade planning Jimmy. When I first lurked here before joining & read Tess & the guys comments continually referring to it, I began plotting & watching it.
It really is amazing how regularly the price action gets pulled to, & pushes away from, the outer limits of it’s average range so often.
So many uses for it too.
Any of you using a metatrader indi for average daily range? You don’t calculate it manually surely? Also a standard day is 17:00 to 17:00 EST right?
You could just plot a daily atr. 100 or 50, that’ll give you a close enough read out of what’s going on across a typical quarters price motion.
You’re only looking for a gauge to put a track on the markets potential journey. Sometimes price will get pushed well in excess of it’s average range on the back of a one-off event.
And occasionally the market will suffer by struggling to track 60-70% of its range for a few days on the bounce if there’s nothing driving it.
That’s the recognized international open & close of the Foreign Exchange business day, yes.
That’s pretty close JJ, only I like to keep a little more distance. I wouldn’t map the battlefield for pivot zones on anything lower than 4H and I observe priceflow on the 5m, occasionally on the 15m.
I found that this kind of MO offers basically a more detailed insight on how the high-frame candles are printing, hence I’m not always looking for a bargain, but to see how balanced a Supply->Demand transition or continuation is. Of course, I will trigger obious signs of exhaustion/rejection on counter-swings, but my main focus is on the structure of waves as a whole.
If the distance from your template time frame is ample, its never late to enter once the picture is christal clear. This might sound a little too conservative for some, but I’m willing to sacrifice returns for a more relaxed day.
The shot of nitrous from the nfp couldn’t keep it on the road:D
On another note, how did you arrive at the 76.5 number over 78.5?
There are solid lines in the sand at both points. What is the deciding factor to you that puts focus on the lower number?
Fair enough. Whatever works best for you.
When all said & done, it’s your money & you know your own limits & comfort levels.
Sounds like a man with a plan!
Wherever possible I like to watch & see how area’s of balance get whacked around, especially as they rotate back & forth between visible supply & demand channels.
Upper level drop a whisker below 1.38 on 16 & 17 February is a good example. Sharp decline out of that 4-5 hour zone of agreement between buyers & sellers will have me eyeballing a return to that level next time around.
Jocelyn has already touched on the reasons for looking out for this sort of behavior in a previous post, but essentially that’s a prime level of likely supply in my book & a definite area I’d want to be considering shorting if the signals pointed to red.
Same story down below at that demand channel. Impatient breakout traders will be looking to front run that area & they’ll be bid interest from intra-day longs mixed in amongst short covering.
That order build up will be sufficient to signal momentum triggers via the smaller timeframes to match up with this larger timeframe leader.
This type of supply, demand behavior can be planned out on most timeframe combination charts. But it’s just another version of the same idea.

I suppose those levels will stay on your charts until they’re either confirmed again as main price influencers or they get ignored totally by the market traders?
jjay, anyone - do you go through the same scenario for each new week/day & readjust trade entries & targets, or do the main price zones of interest stay up on your charts until they’re confirmed as valid or invalid?
Just open up your workstation, take a clean view of proceedings & look objectively at the price map without any preconceived notions.
What do you see?
Where’s the recent bias
Where are your near term upside/downside potential reaction levels.
Where are the next stage potential profit zones located.
If you got recent bullish momentum, then where would you look to engage long if price pulled back.
If you got recent bearish momentum, then where would you look to engage short if price pulled back.
If it pulls back & fails to hold at the nearest support or resistance step, then what are you going to be looking for in order to influence your positional view.
If it gaps up or down, what are you going to be looking for in order to get you aboard the fresh weeks momentum.
Make a few notes & prepare a scenario of the possible alternatives.
You’ll already have your structure (strategy rules) laid out with your set-ups/triggers/risk & management model ready to roll, it’s just a case of filling in the usual blanks about where price is now & what you’re going to do if it rears up on your radar & signals you in.
It should be the same story for every trading session across every instrument you trade.
What’s it doing, is it doing something I’m interested in & fits my usual criteria for a trade….if it is, where best am I going to obtain maximum potential value for minimal risk outlay.
Here’s an example of what I’ll typically have on the radar for something I’m watching…
Eurjpy broke up thru an area of visible resistance into Fridays european close/mid NY trading shift. That 121.60-90 acted as a support floor during late February & flipped to a resistance ceiling for the best part of a week, repelling price on a couple occasions before it busted thru on Friday.
So, if this thing wants to grow legs on a return to ‘risk acceptance’ then I’m going to want to see a little conviction & upward intent.
A gap up into Tokyo on Monday morning will have me long on a pullback.
A pullback into the possible bid zone will also have me seated long should I receive appropriate confirmation.
A drop & fail thru this lower channel, particularly the 121.9 line will have me switching hats, waiting to see whats driving & influencing the price action & looking for confirmation of a short flip option.

Scan your favored pairs & look for opportunities that fit your set-up criteria & trading style. You want familiar (to you) technical scenario’s that offer you decent odds of your set-ups & triggers playing out with acceptable risk.
If you can’t spot a scenario that you’ve tested out & traded often enough to get your taste buds working, then you have to sit tight until that opportunity comes knocking.
Only engage when all your ducks line up. Don’t trade for the sake of it, & don’t trade without a solid, tested & extremely familiar plan locked down tight.
Scanning through my charts and want to try out some new ideas on the GU
GU weekly shows a pinbar.

From the daily, price seems to find support on 1.4950 region which had acted as a support and resistance zone in the past. Last week, price fails to move and close below this region which indicates sellers are not aggressive after a sell in pounds since beginning of the year.

Price will meet resistance at 1.5300 a region which is also a round number.

If on monday, price breaks the weekly high, it will see me enter a long position.
If price decides to continue to move south and breaks 1.4950 region, I will switch to the bear side and look for a retrace and short opportunity.
If price decides to stall between my two drawn out levels I will sit on sidelines.
I took a long off the H4 timeframe which is my trading timeframe. On the H4, I saw formation of a HH and a HL.

In addition, price is trading above a zone which I was interested in. 0.9000 a round number and a area which price has regularly come into contact with since last year. This trade was taken at the NY session, price managed to stay above the round number for most of the London session which give me confidence that bears were not strong enough to break that region. Entered at 0.9028 sl at 0.8990 TP at 0.9090.

The trade managed to work and gave me a good risk and reward. 
This trade in progress. The IB allows an entry for a run back at the 5000 round number. We now have our seat at the table but can expect a rough ride through this area
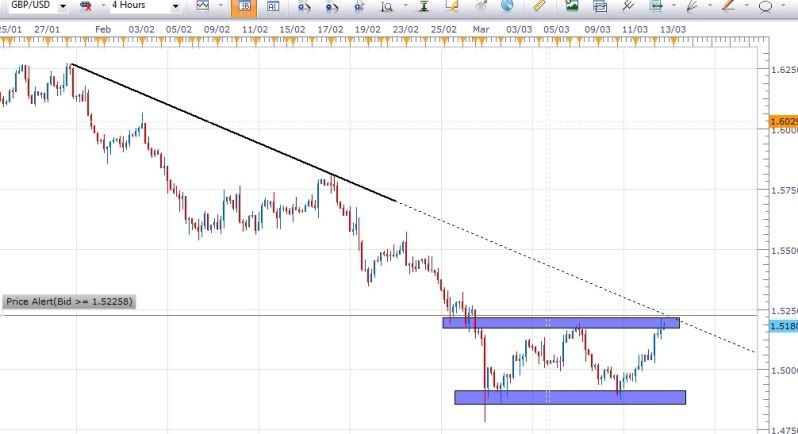
Could someone have a look at the chart below and say what your immediate thoughts are when you see something like that. I think I am able to identify zones on my charts where i expect something to happen but I seem to predict it wrong most of the time 
My initial thoughts are that I would look for some reversal pattern near where the trendline meets the upper area of resistance(roughly where we are now) and/or look for a breakout of the lower support zone and enter short on a pullback.
I know there are endless scenarios but I’d like to know what ones you expect to see happening over and over in a situation like this.
what type of reversal pattern will you be looking for & how do you plan to trade it?
that’s approximately 350 to 400 pips away.
what are you going to do in the meantime if price deflates, you miss the initial reversal & it stalls out 200 pips from current level for a period of time?
would you also consider trading the flip side of that possibility?
price moves back down to your highlighted support zone & begins to exhibit reversal long potential?
[U]there are actually 3 main scenario’s.[/U]
as the guys have suggested, it might be to your benefit to either have a very specific plan of action for tackling just one of those scenario’s & ensure you’re well drilled when opportunity comes knocking, or have something in place that will influence you to make a positive decision about trading, or not trading price action as it encounters this situation again in future.