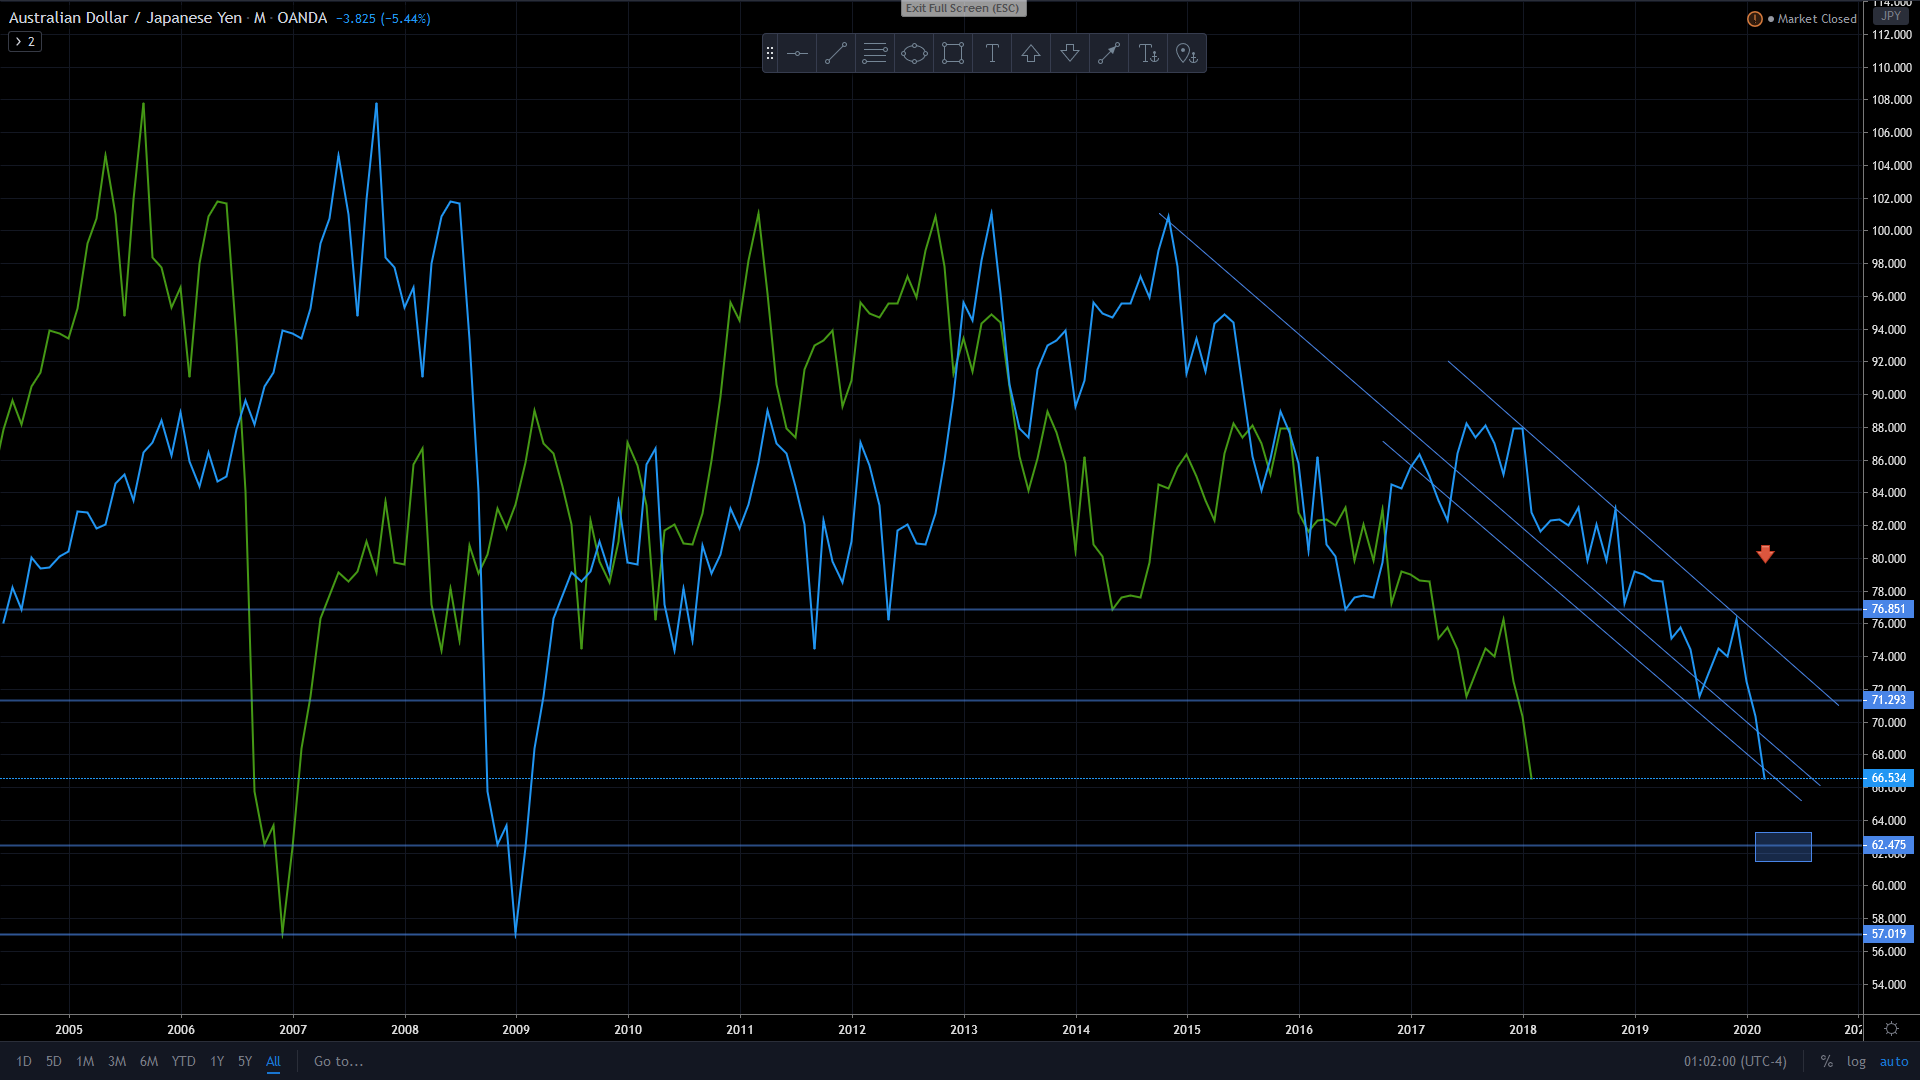
EURCHF is still in a nice long term trend. Be aware though, the pair might be near a line that the Swiss Central Bank will not allow it to cross. And in a situation like this, the CB will always win from the market.
I kind of disagree with you on this.
See, the market will always either be ranging or trending.
Similar to life, it’s all just a cycle.
Whatever happens, its either we being the hunter or being the prey.
The hunter will always hunt and kill the prey. They will always win.
And they do this over and over and over again.
In times of uncertainty like this, I choose to be the hunter.
I believe this is the most versatile trading plan available regardless of the changing market conditions whether its ranging or trending.
And bro @The_Baller you’ve proven and tested this method for some time.
I strongly believe numbers don’t lie.
Its just a matter of time. 
You’re right bro.
Just for newbies who are just entering the world of Forex for the first time, this climate isn’t the best on bigger time frames - especially without the risk appetite.
Nevertheless there is money to be made.
1 Like
Hey
I’ve spent about 2 weeks on and off reading this thread from start to finish. I’m completely new to trading and I’ve made my way through about 3/4 of the baby pips course.
I pretty much understand how the strategy works, but there is just one thing I don’t get. What exactly do you use the lagging line for? I know you said previously that it’s just for plotting support and resistance, but why can’t you just use the price/candles for that? If the lagging line is just old data I don’t see how it’s useful?
This is probably a really stupid question with an easy answer, but I guess that’s what being a newbie is about. Thanks for any help 
I might be wrong but I believe it gives you a clearer view, gets rid of some of the noise. Just makes it easier to see really. At least that’s how I’m using it.
3 Likes
@ The Baller
Thanks for posting this topic.
I found this thread last Tuesday and it helped me to collect 1400 pips by Friday, with 13 positions still open, 9 of which are in the green.
I’m not doing what you are doing but this thread helped me figure out better entries and exits.
Anyways, much appreciated. 
2 Likes
I second this. My thanks are greatly overdue, been following this thread for now a few months.
I took on board a lot of your advice and integrated them into my trading, which resulted in a massive increase in positive trades but also a huge decrease in my stress level!
If ever you are down Canterbury way I owe you a pizza and a drink!
1 Like
Like eatstocks said, it cuts out the noise, or the wicks from the candles to show where it closed for that time period. It depends on your strategy, but when trading on higher time frames it’s good to know where those wicks are to determine where you want to put your SL, as you want it away from the ‘noise’.
Alternately, you could just switch your chart from candles to line graph. Here’s the lagging line with candles:

Here’s the lagging line with a line graph:
You can see it’s an exact replica, but can be helpful as a visual aid to find S/R levels.
1 Like
Thanks for the reply. That’s basically how I’ve been using them so good to know, thought there might have been some trick I was missing.
Just passing by. I greet you boss @The_Baller . It’s pass 5 months I came about this thread devouring all it’s contents. I’m impressed there is still much live in this thread. Newbies take this thread serious, it changed my thought about trading. You might not trade the way he trades but it will help you build a solid strategy that does what @The_Baller strategy does. He commanded the force to be with me, You know what that means  . Bless
1 Like
Hi, sometimes it can also be used to confirm a trend, if the Chikou span is below the current price = bearish, if the Chikou span is above the current price = bullish.
1 Like
I believe this has been answered, better than I could have myself.
No tricks here, just pure and simple stuff.
Spot on. Couldn’t have said it better.
Much respect.
Wishing you all the best.
Nice to see you again @Regan64 - simple concepts don’t go anywhere, they stand the test of time.
Wishing you all the best.
1 Like
Thank so much for the incredibly useful info here! I’m a total newbie making good money on a demo account at the moment, but we all know that means nothing! Just wondered if you’re still doing spreadbetting? Also being UK based, it’s my focus, as I may as well take advantage of its tax-free nature
1 Like
Isn’t spreadbetting essentially the same as a CFD ie, what everybody on here calls trading?
Wishing you all the best, we all have to start somewhere.
Yes purely for the tax-free benefits.
If the old Majesty’s minions ever get on your case, they’ll soon be straight off it, if you can prove you were spread betting.
1 Like
The key difference between spread betting and CFD trading is how they are treated for tax.
Spread betting is free from capital gains tax (CGT) while CFD’s require you to pay CGT.
Spread betting is also only available in the UK or Ireland, while CFDs are available globally.
3 Likes
Thanks! I’ve read and re-read your post and made notes and started today trading off your cloud breakout strategy on the ic markets ctrader demo… Tried lots of spreadbetting accounts but actually like the functionality of this platform the most, eve though it’s only for CFDs…
I’m really struggling though - I find what i think is a good trade on the daily but when i look on the 4 hour, it’s totally different and no longer looks like a good trade! I placed a few trades today but whilst some of them did well earlier, currently they’ve all lost money and I’m sat there glued to my screen all day watching them! Is it partly the market at the moment or am i missing something crucial?!