A trend in a given timeframe is:
A price sequence heading from a significant point (which we will call point A), to a second significant point (which we will call point B), with point B being greater than point A for an uptrend, and lower than point A for a downtrend.
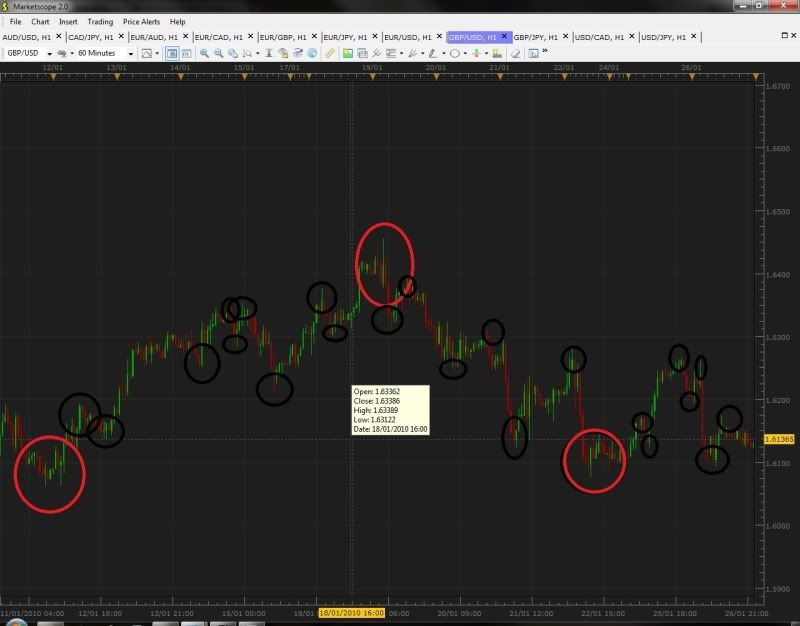
A significant point (as would be found at point A or point B), would be the point at which price reached its lowest low, or highest high. To illustrate my point, a picture!

As you can hopefully see, there are a whole bunch of circles on this picture. The three red ones are, for this selected timeframe, the highest highs, and the lowest lows (the “significant points” I was talking about). If you look at the candles to the immediate left and the immediate right of the highest point, you can see that both of those candles are either EXACTLY equal to, or lower than it is. If you look at the lowest points, you can see that the candles to its immediate right and its immediate left are EXACTLY equal to or higher than it is. This is what makes a point significant.
We also have minor significant points in between the major ones - identified by the little black circles. Each of these fills the criteria of a significant point, and indeed each one creates its own minor trend (usually just a few candles, 5-10 or so), but none of them signal as great a trend change as the significant points circled in red.
So, to kind of sum things up nicely:
A trend is a line drawn from the one significant point, to the next consecutive significant point, as it is impossible for two significant highs to occur without a significant low between then, and vice-versa. But, there are two different trends; which I will call “major” and “minor” trends.
Major trends are trends drawn between two VERY significant points (those would be the points I have circled in red). There will be many periods between these two points (probably 30+, I haven’t done any research whatsoever into this though, so don’t take my numbers as gospel)
Minor trends are basically any retracement that last longer than one period (one candle on my charts, because I trade candlesticks). They will only last for a few candles before continuing in the direction of the major trend (less than 30 candles, most likely between 5-10. Again, I’m just making these numbers up, I don’t really know).
I hope that’s clear for everyone. Now, to Tymen’s questions!
-
What about retracements?
Retracements are basically mini-trends that occuring in the opposite direction of a major trend. If you can identify the retracement points, you could probably trade them as you would a regular trend.
-
How many candles allowed in a retracement?
This depends entirely on how many candles are in your trend! If you have a 30-40 candle trend, a retracement of 5-6 candles would be huge, but if you’ve got a 300-400 candle trend, a 5-6 candle retracement would be nothing more than a bump on the road.
I’d probably say that if the retracement lasts more than 1-2% of the length of the trend, it is probably a fairly tradeable trend reversal. I don’t have any evidence to back me up on this though.
- How big is a retracement allowed to be?
A retracement can be as big as it wants - you have no control over it! (Man, am I ever funny.)
But in all seriousness, this depends on your risk tolerance and the size of the trend. If you’re expecting to get 1000 pips out of the trend, then a 30-40 pip retracement probably won’t bother you that much. If you expect to get 100 pips out of it, you might have to jump out if it retraces by 30-40 pips.
-
Consider trendlines.
Lines drawn from one significant point, to the next consecutive one!
-
What could constitute the begin of a trend?
A significant point, as defined earlier in my post
-
What could constitute the end of a trend?
A significant point, as defined earlier in my post!
Hopefully there aren’t too many holes in my definition!


