you are correct N Forex in what you say. Although that extreamly long bearish candle that stretched from the mid BB to outer BB would have kept me on the sidelines.
Does anyone know how (is it possible?) to convert the black backgrounds on posted charts to white backgrounds? I like to study the postings off line and my printer does a horrible job of printing all that black.
"Quick question on this one:
Since the candle before your extreme candle was NOT bigger you should have included it into your drawing of the CBL, right?
Am i wrong here?"
NForex, As I understand, yes, you used the 1 candle CBL for entry but the body of the candle previous to the extreme was smaller, so you should have used the 2 candle CBL. This time it worked out in your favor so no big deal.
You might make more pips lots of time just using the 1 CBL, but I suspect Tymen has extensively tested his method, so I’m trying to use it just as designed so I can get an idea of consistent results. Entry forming on 1H EUR/USD right now.
I’ve decided to concentrate demo trading on majors and comdolls 1H charts for now. I get lots of good trades and lots of pips to evaluate system on those. In three trades and one more on watchlist right now. Great fun!
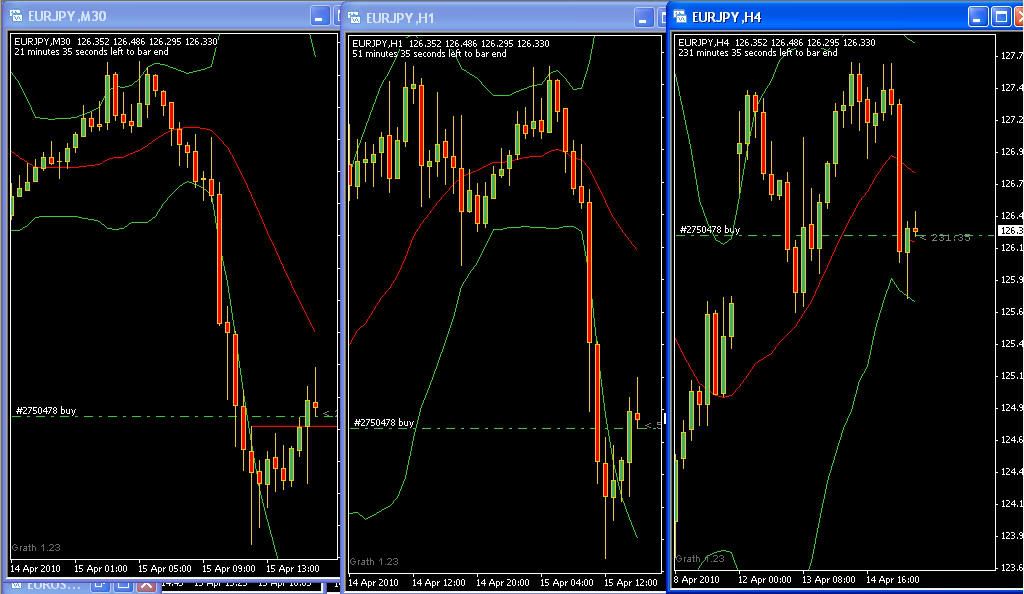
4Hr shows the price action touched the lower BB…going to 1 hr to look for reversal.
1 Hr shows a stall and beginning of contraction.
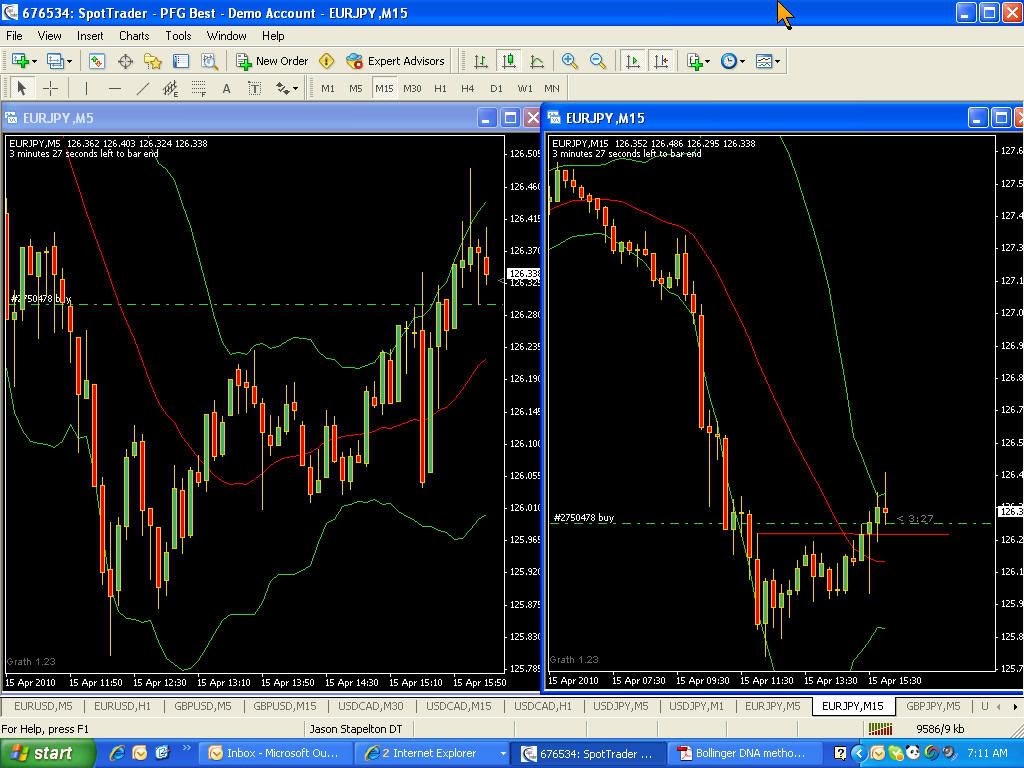
30 min shows contraction and reversal.
15 min show TP 1 & TP 2 reached but still plenty of room to go up on 30 min & 1 hr.
5 min has reversed and is in a up sausage…which is good.
The primary thing I want to illustrate is that all of these time frames are saying the same thing…do not trade down…only trade up. We’ll see how it goes. I’m learning a lot by doing this.
What is a comdoll? Not familiar with that term.
Thanks all for the quick reply.
I also did some Demotesting today. Those are the results so far:
[B]EUR/USD on a 30m chart.[/B]
[B]USD/CHF on a 30m chart.[/B]
[B]EUR/JPY on a 30m chart.[/B]
[B]USD/JPY on 30m chart.[/B]
Too bad it was stopped out :-/
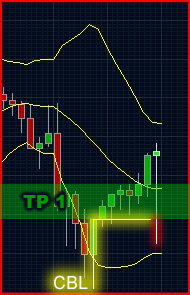
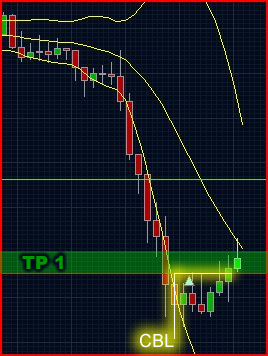
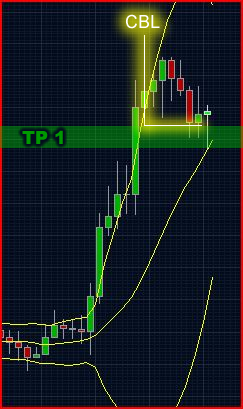
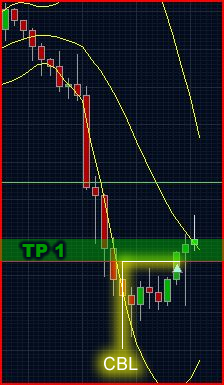
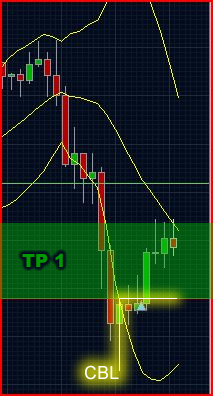
[B]EDIT:[/B] I notice now i should have used the 2 candle CBL here since the candle before the extreme candle is slightly bigger.
Pleas take a quick look at the CBL’s (i think i have drawn it correct).
So overall:
5 out of 5 trades went into profit.
4 out of 5 made it to TP 1 and hit the SL later.
1 trade is still going on and i’m hoping for TP 2. (next post)
And finally GBPUSD on a 30m chart.
This trade is still going.
PTB, I entered long on that bubblicious 1H EUR/JPY setup you just showed.
Making good pips. My demo is now in 4 trades, my personal Money Management max at any one time. comdoll is commodity related pairs, like USD/CAD is highly inversely correlated with oil price since Canada exports lots of oil. Discussion of ComDolls in Forum.
Since I am confident that the trade is up I could have been trading the 1 min every time it retraced back to the lower BB. The red vertical line marks the entry point where pa triggered the trade on the 30 time frame. Had I been brave I could have entered much earlier on the 5 min. The red trendlines show the trade that could have been made on the up moves…nice and safe.
I just exited my trade at TP2 for +32 pips. I should have used two lots and moved the other lot to break even. I’ll wait for a pull back on the 1 min and see if I can re-enter at a lower price.

For MT4 pull up any chart and R. click on an empty area. On the pop-up menu go to the bottom and click on “Properties”, then click on “Background”. You can select none, I prefer “Snow”, bottom row, 2nd from R. Hope that helps.
Sorry, I didn’t read carefully enough. Short of some type of photo editing software I don’t think you can chage the background color of a posted chart.
PTB, I’m trying to follow system in demo just as layed out by Tymen. He covered most all cases. Anything he didn’t cover or looks strange, I just don’t trade. Eating pips like a cookie monster. Working like magic on 1H majors and comdolls.
Nforex, you are kickin’ ass. Keep it up!
Once the chart is posted on the thread I don’t think you can change the color. You can copy the posts…put them in a file for study later when you are not able to be online.
:D:D:D:D
Haha, you couldnt have said it better!
Hi NForex,
Are you using Oanda as your broker? If so have you got your Bollinger bands settings on their default which is 14,2. My understanding is that Tymen said to set the BB settings to 20,2. It’s just that I also use Oanda and I noticed some discrepenacies in your BB layout. On at least a couple of the above charts, the price action gets no way near the mid BB line (never mind actually hitting it) with a setting of 20, 2 but it is if you change it to 14,2.
Mickeyl177
Hey Mickeyl177,
Youre absolutely right! I was thinking the default-settings of oanda where like we need them. Just checked it and changed.
Thanks very much for your tip!!!
You got eagles-eyes 
Dobro and PTB,
Thanks. I guess it’s not possible.
Oh, well…:rolleyes:…
Changing the Backgroundcolor of these charts. Hum. Actually I can do that.
Just pick the ones you like and send them to me via email. (write me a p.m. please)
I’ll send them back with white Background if you like.
But well, would be nice if you dont choose like 200 charts
Yes, after watching a few live trades, the trick is to watch the expansion/contraction of the BBs. I use the BB bandwidth and %B, BB derived indicators so I can get an objective figure as to whether it’s contracting, expanding or just level. Not essential but if anyone is interested, the code for these can be found here,
Bollinger Bands - Wikipedia, the free encyclopedia
Actually watching the PA moving from one extreme BB to another, reminds me of a game of Ping Pong. The mid BB being the net and if the ball doesn’t go over the net, then you lost that point. However if the ball is smashed way over to the outer BB on the other side of the net, that’s a winner, especially if you put some topspin on it and it walks the BB!!
However the most difficult ones to trade are the sausages. The problem being when to exit the trade and enter the other way. It seems sausages present the highest risk of losses if you enter the other way but it goes back and touches the extreme BB again before reaching midpoint. Tymen mentioned this. More advice on this area would be really great!