The price action at point 1 clearly goes thro to point 2.
This was an OO price action type. (pink).
With the mid BB against us, the TP1 is set at the mid BB.
We smile as the price action goes thro the mid BB to hit the upper BB at TP2.
Then we get an OM price action (green) and a TP1 trade starting from point 2.
After this, the price action fails to hit the lower BB for TP2 and retraces instead to the upper BB where it goes for a long BB walk.
This walk is in a BB sausage.
The trick is to find where this walk ends.
It ends at point 4.
We then enter at point 5 with the mid BB against us, thus setting TP1 at the mid BB.
The price action goes thro the mid BB (collect TP1) and reaches point 6 (TP2).
This is an OO price action type (pink).
Now, the question is, do we trade the BB walk in the sausage of the above chart of Tymen’s, or do we ignore it??
I was almost wondering about a 3 lot strategy. The first profit would be taken at TP1. The second profit would be taken at the opposite outer BB. The third would be left to run wild during the BB sausage…
Tymen, please pardon my spelling of your name wrong in my other posts. It was not intentional…
amosfella, yes, that long bb walk is a heart breaker to miss. I’m finding that the vast majority of times that the price starts walking down the bb, if you had been following Tymens system you would have gotten in on the opposite band and would have an OBB type trade. With this odd case however, trading Tymen’s system, the bb walk is missed.
There are many things you could try, but I imagine Tymen tried most of them and in the long run they create more loss than gain. The fact is there is no system that will catch every good move. The problem is, if you start trading away from Tymen’s system, you’ll never have confidence that it’s the best balance overall.
I can suggest that if you want to try to catch the bb walks that you are missing, set up a separate demo account for discretionary trading, and test if you can do that reliably over the long haul. I have several demo’s going right now, including one for Tymen’s system. I’d be very interested to know the results, because I’ve seen many bb walks that I missed just because I wasn’t trading when they started (we all sleep sometimes).
My only concern is that bb walks are very clear in hindsight, but it may be more difficult to catch them real time. Someone earlier suggested that if you see a bb walk you want to get into late, move to a very short time frame, like a 5M, get an entry under Tymen’s system, then somehow work your way back up to the time frame of the bb walk. I haven’t a clue if it would work, but it would be interesting to test. If you decide to give it a try, let us know if it can be done, OK?
I noticed something earlier today that you may want to take a look at. Post #2156, I posted 5 different time frame pic on the EURJPY. I noticed that in the higher TF the price action was moving in one stage or another from outer to mid or outer to outer or mid to outer, but the 5 min was in a sausage moving upward.
So I’m thinking that after a lower time frame completes its bubble…if there is still movement that needs to be completed on the higher time frames (to the next mid or outer)…the lower time frames go into a sausage (BB walk). Whenever a retracement happens on the higher time frame, we will then see the sausage end and a bubble start on the lower time frame. After the bubble is over on the lower time frame and the retracement resumes on the higher time frame, the lower time frame will then go into a sausage again.
So if my thinking is correct, the BB walk will start and end with the retracements of the higher time frames.
So if this is true, then when we see the bubble end on the lower time frame we should also see the retracement end on the higher time frame and we could then decide to stay in the trade on the lower while it goes into the sausage…thereby raking in more pips.
Whew…I hope this is clearer than mud!
I note that I have been using BB walk and sausage as meaning the same thing. My understanding is that they are not the same thing. As I understand it, a BB walk may occur in both a sausage and a bubble. In a good bubble the pa will walk down or up the side of the BB until the contraction starts of the opposite BB…which is a signal that the walk may be about to end.
A BB walk may often occur in a sausage but from what I have seen the pa usually bounces back and forth within the narrows confines of the low volatile sausage. I find it interesting that when I see a sausage on the 30 min or 1 hr, I can drop down to the 5 min for a better entry.
Very interesting PTB! It takes a bit of getting the eye in between charts but, a quick look through cable - needs to be a bit more thorough i admit - it seems to work in a number of instances. I found it’s a case of marrying the right time frame charts though. Using the 20min as home chart I found the 120min chart seemed to correlate a little better than the 240 - which took a little too long to come on line… will look a little further and see what happens…
Also, being tuned into always glancing at higher TF trend movements, I just did a quick scan adding entry filters of taking 20min signals based on being inline with the 120min mid bolinger line being up or down (order of hi’s and lows could also be looked at). Looks like a higher proportion of trades go to T2 - only when trending though. It could still be used as a bias for position sizing maybe…
Am sure Tymen has been through all of this and then some before - so I could be barking up the wrong tree of ideas…
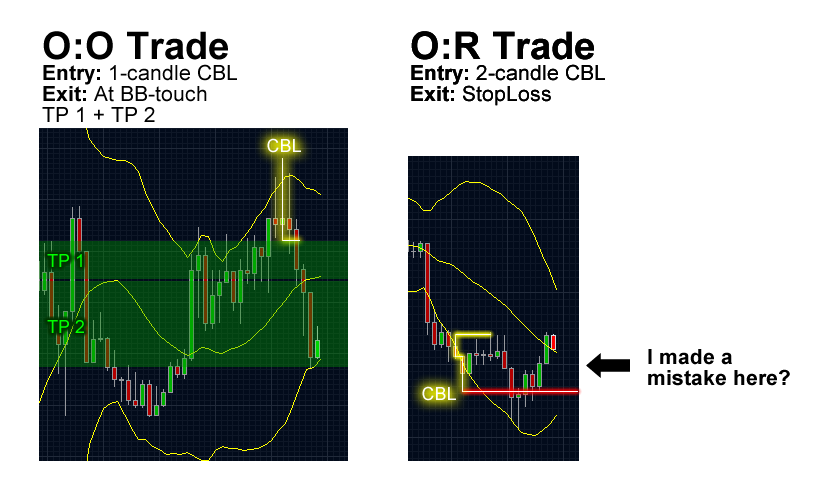
Question on the lost trade:
Did i made a mistake or is this just one of those trades you just loose?
Would you have taken this trade tymen? (or well: question goes out to all)
Oh yes and of course i missed the CBL-entry-signal right after i lost that one
I feel the impact of those losses is high, since you get a full 2-contract-punch in the face ^-^
The opposite band was still very much expanding, not contracting.
The second CBL entry which you missed happened after the band began contracting, and would have been a more appropriate point of entry.
Although, at that point, the bands were looking more like a sausage then a bubble, so I wouldn’t have taken the trade myself, potentially missing out on good profits!
I agree with Iron heart. Contraction is the signal to look for an entry in the opposite direction but not the only consideration. I always look at all the other time frames to get a feel for what is happening. If the higher TF show that it is bouncing off a mid line or an outer then that plays a factor in whether or not I would want to take the trade on the lower. I am really learning that the lower time frames give me a better entry for what I see on the bigger time frames…with a much smaller stop loss.
Remember…bigger time frames rule…they are the boss. The dog wags the tail. The tail does not wag the dog.
For those of us who followed Tymen’s Ultimate Candlestick approach with great interest, I am just wondering if there might be an application of STARC bands to the question of when to take profits. I was mildly profitable using the UCTM but blew my account on a rash bet on the XAU/USD pair. (Loss aversion psychology is a killer isn’t it)
After following the current discussion since inception, I have started experimenting with a double STARC band overlay on my timing charts using H3 & H1 as the home charts and M30 & M15 as the timing charts respectively. I’m trying to see if it helps when gauging whether a trade is going to walk the BB or retrace.
Just a thought, but we will have to wait and see what is in store…
I must admit, that i am a little bit confused about the “higher Timeframe (TF)”.
I trade on a 30 min TF. And at the moment im not sure whether i should use the 4-h or the daily TF (or even weekly?) as my higher TF, since many times they give me different signals.
Im just not sure which timeframe is like “too far away”.
Sry if this is off-topic, but i think its a good moment for me to ask.
Hey hachiko, I’ve actually been doing the same thing, except that the STARC is on my 5m chart.
It helps to see when a potential BB-walk may occur.
I do remember, however, that Tymen mentioned keeping everything on 1 chart only - I’m sure there’s a new technique around the corner that may help recognising a bb-walk without looking at the lower timeframes.
I’m guessing that it will involve checking whether the bollinger bands are beginning to trumpet.