The finest in trend trading

Wow, very informative, you did a great job here Sir!
I agree that learning via pictures is the best. One day I will put together a complete tutorial (when I have made lots of $$$ and can retire on a beach :P)

I wrote an article about forexhabits.com/why-i-dont-trade-against-the-trend

I dont want to spam so if needs be ill take the link down, just thought it can help some people.

Cheers
Diggy

Maybe after “X” amount of lower highs during an uptrend a retracement is occuring which may lead into lower lows or a downtrend? As for how long a retracement should last I really have no idea. Maybe we could treat each retracement as its own trend? At the end of each trend (signified by lower highs in a bull martket or higher lows in a bear market) we look for the trend to reverse? So the end of the previous trend would infact me the begining of a new trend?

could you use some kind of linear curve fitting formula? Along with some method of determining slope to guage strength of trend?

A trend in a given timeframe is:

A price sequence heading from a significant point (which we will call point A), to a second significant point (which we will call point B), with point B being greater than point A for an uptrend, and lower than point A for a downtrend.

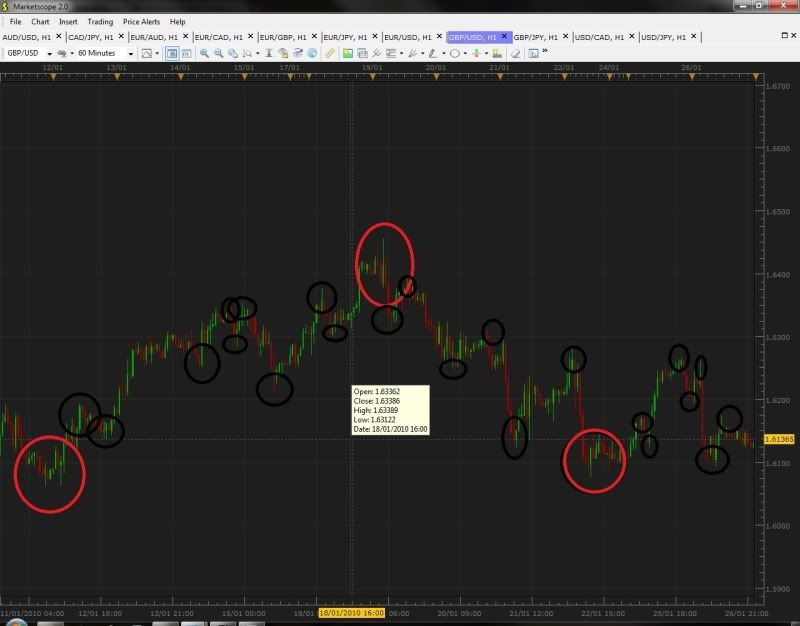
A significant point (as would be found at point A or point B), would be the point at which price reached its lowest low, or highest high. To illustrate my point, a picture!

As you can hopefully see, there are a whole bunch of circles on this picture. The three red ones are, for this selected timeframe, the highest highs, and the lowest lows (the “significant points” I was talking about). If you look at the candles to the immediate left and the immediate right of the highest point, you can see that both of those candles are either EXACTLY equal to, or lower than it is. If you look at the lowest points, you can see that the candles to its immediate right and its immediate left are EXACTLY equal to or higher than it is. This is what makes a point significant.

We also have minor significant points in between the major ones - identified by the little black circles. Each of these fills the criteria of a significant point, and indeed each one creates its own minor trend (usually just a few candles, 5-10 or so), but none of them signal as great a trend change as the significant points circled in red.

So, to kind of sum things up nicely:

A trend is a line drawn from the one significant point, to the next consecutive significant point, as it is impossible for two significant highs to occur without a significant low between then, and vice-versa. But, there are two different trends; which I will call “major” and “minor” trends.

Major trends are trends drawn between two VERY significant points (those would be the points I have circled in red). There will be many periods between these two points (probably 30+, I haven’t done any research whatsoever into this though, so don’t take my numbers as gospel)

Minor trends are basically any retracement that last longer than one period (one candle on my charts, because I trade candlesticks). They will only last for a few candles before continuing in the direction of the major trend (less than 30 candles, most likely between 5-10. Again, I’m just making these numbers up, I don’t really know).

I hope that’s clear for everyone. Now, to Tymen’s questions!

  1. What about retracements?
    Retracements are basically mini-trends that occuring in the opposite direction of a major trend. If you can identify the retracement points, you could probably trade them as you would a regular trend.

  2. How many candles allowed in a retracement?
    This depends entirely on how many candles are in your trend! If you have a 30-40 candle trend, a retracement of 5-6 candles would be huge, but if you’ve got a 300-400 candle trend, a 5-6 candle retracement would be nothing more than a bump on the road.

I’d probably say that if the retracement lasts more than 1-2% of the length of the trend, it is probably a fairly tradeable trend reversal. I don’t have any evidence to back me up on this though.

  1. How big is a retracement allowed to be?
    A retracement can be as big as it wants - you have no control over it! (Man, am I ever funny.)

But in all seriousness, this depends on your risk tolerance and the size of the trend. If you’re expecting to get 1000 pips out of the trend, then a 30-40 pip retracement probably won’t bother you that much. If you expect to get 100 pips out of it, you might have to jump out if it retraces by 30-40 pips.

  1. Consider trendlines.
    Lines drawn from one significant point, to the next consecutive one!

  2. What could constitute the begin of a trend?
    A significant point, as defined earlier in my post

  3. What could constitute the end of a trend?
    A significant point, as defined earlier in my post!

Hopefully there aren’t too many holes in my definition!

I ignore sideways trends because

A: you can’t earn pips off of them (by definition), and

B: perfect sideways trends (where close price = open price for more than a couple of candles) pretty much don’t exist. There will almost always be increases or decreases in price (maybe by only 1 or 2 pips, but that’s still not a perfect sideways movement), and those increases and decreases can be used to make profit.

A trend is defined as a period of higher highs or lower lows for a given timeframe with minimal retracements of less than 50% of the total directional move, whether in the positive (+ pips) or negative (- pips) direction.

I like this idea except for me the kiss of death would be a 62% retracement. At that point I would say the movement is begining to fail. I would also suggest that when candles start looking rounded off then the trend is running out of steam.

[I][B]So I am going to go with higher highs and higher lows over time represent an uptrend where the greater the distance between the higher highs and a greater distance between the higher lows would represent a stronger up trend and reverse for down trend. As the higher highs and higher lows start printing closer together then the trend is slowing down and eventually when the higher highs and higher lows stop being higher than we have a consolidation or reversal.[/B][/I]

I have tons of ideas but I would like to wait to see what tymen has in mind.

Since I posted this in another thread, I feel i should also post it here:
Actually as long as a trader who is profitable is good enough. A trend trader can be profitable, a non trend trader can also be profitable. I prefer to be on the both sides and use setups for a trend trader and a non trend trader to profit. The forex jungle is so dangerous why stick to our old conventional way. and not think out of the box to survive. Jacko is a trend trader and he is profitable and james16 is not a trend trader and is also profitable.
[B]
A trader should learn about trend trading and non trend trading.[/B]

I like that. seeing the whole picture

Demand is a FORCE upon price.

Supply is a FORCE upon price.

I look at the market with these principles in mind and don’t clutter my brain with much else. I know when the forces of supply and demand are equivalent that price is at equilibrium and will range until something changes. When demand is in excess of supply, price will move up. When supply is in excess of demand, price will move down. The passing of time, the changing of prices, and the creation of news events will all change supply and demand.

As a trader, I study supply and demand in the marketplace and look for opportunities to join in on a wave of supply/demand. Sometimes the forces of supply and demand are self-reinforcing, and this is what I would call a TREND.

That’s my bad, I misinterpreted the question - for some reason I thought you were trying to profit off of sideways markets, not use them as an indicator.

In that case, yes, they’re quite important. Coupled with indicators (I’m a big fan of bollinger bands in sideways markets myself) you can make a lot of pips coming out of a sideways market.

I love sideways markets (unless they are created by a holiday) because then I know the resulting momentum from the break can be worth a lot of profit, and is generally trend-setting, simply because huge positions were built-up during the tight consolidation range. I just imagine a spring getting pushed ever tighter. Sometimes there can be a bit of a fakeout but to be honest it’s pretty easy to spot and can be a great entry point (very low risk) for the REAL break in the opposite direction.

edit:
I can explain it pretty straightforward but when you’re actually trading it, it’s pretty tough actually. When your mind is expecting a huge break, you can tend to jump the gun. Also the tight range can trick you into being cheap with your stops and put them right above the consolidation zone.

A trend is defined as a period of higher highs or lower lows for a given timeframe with minimal retracements of less than 50% of the total directional move, whether in the positive (+ pips) or negative (- pips) direction.

i like this also, i’d like to wait for tymen’s opinion in all of the input here. :smiley:

subscribing…

Ah, so many posts since I was here last night!! :slight_smile:

[U]We have a lot of ground to cover [/U]and I must do it carefully - there is a sequence.
This sequence must be in correct order or else there will be confusion.

The pressure is also on me greatly as my time is shared between here and my own trading.

So bear with me at this very beginning of this thread!! :o

[B]Lets look at the new gems of information that you have all generously posted…[/B]

Originally posted by [B]Ruilima22[/B]

higher lows and lower highs is the only thing i use in trading

Originally posted by [B]kockneerebel[/B]

up trend begins with the lowest low and ends with the highest high

Originally posted by [B]Wrtm 19 [/B]

I’m thinking here of trend corrections, that themselves brake the main trend structure…

Originally posted by [B]Soul786[/B]

[B]A trend is defined as a period of higher highs or lower lows for a given timeframe with minimal retracements of less than 50% of the total directional move, whether in the positive (+ pips) or negative (- pips) direction.[/B]

Originally posted by [B]SDC[/B]

An upward trend is when the average highs are higher than the average lows in any given time period …

Originally posted by [B]Hellogoodbye4201[/B]

Maybe after “X” amount of lower highs during an uptrend a retracement is occuring…

Originally posted by [B]Talon D (Hon FX Member)[/B]

[B]could you use some kind of linear curve fitting formula?[/B]

Originally posted by [B]Aarnog[/B]

[B]Major trends[/B] are trends drawn between two VERY significant points…

[B]Minor trends[/B] are basically any retracement that…

[B]4) Consider trendlines.[/B]…

I ignore sideways trends because

A: you can’t earn pips off of them

Originally posted by [B]Johnnykanoo[/B]

I like this idea except for me the kiss of death would be a 62% retracement.

Thank you also to Akeakamai with your answer to what basically causes a trend -

Demand is a FORCE upon price. Supply is a FORCE upon price.

[B]Analysis please see NEXT POST.[/B]

[B][U]Analysis[/U][/B]

If we study the above quotes carefully we see that we agree upon…

  1. The higher highs or lower lows.

  2. That there are breaks in our trend which we could call “retracements”.
    (much will be said about this later - [B]most important!!)[/B]

  3. Some sort of curve fitting or “trendline” could be used to aid our definition.

  4. A division between “major” and “minor” trends may be needed.

The definition by Soul786 seems to be the one that is enjoyed by all at present and it contains the above elements.

These points then, lead us into the next topic which will further increase our understanding in our quest for an [B]ultimate trend definition.[/B]

[B]TOPIC 3
CONTINUING THE DEFINITION SEARCH

TRENDLINES[/B]

Here I am going to introduce some stuff that we all know and some stuff that could just be new and unexpected to you!! :smiley: :smiley:

OK, lets look at a trendline >>>

Here is a 20 min timeframe of the Cable. (the timeframe and chosen pair are entirely arbitary).

We have an “uptrend” - no definition yet and nothing to tell us when the trend begins or ends.

Note the trendline placed underneath the price action.

In order to maintain accuracy we try to make the trendline touch the price action in as many places as possible. Sometimes we may need to cut thro a low price in order to achieve this.
One of those cuts is shown towards the bottom of the blue line.

Trendlines are very useful to our trends as you will discover.
They do not lag as indicators do.

In an uptrend the trendline is always placed underneath the price action.

In a downtrend the trendline is always placed above the price action.

>>>

This screenshot is a 1 hour timeframe of AUD/JPY
(timeframe and chosen pair entirely arbitary)

No definition as yet.
No attempt as yet to tell when trend starts or finishes.

Parabolic Trendlines.

Have a look at the following chart >>>

This chart is a daily one of EURO/USD.

Sometimes price action is not linear (straight line) and a curved (parabolic) trendline is needed to describe the price action.

This type of trendline is also very useful.

[B]TRENDLINE CONCLUSIONS[/B]

  1. We note that drawing a trendline is somewhat subjective since we try to curve fit the line to touch as many points as possible. Different people will put it in slightly different places.

  2. The trendline does not touch every point but should start with touching at least 3 points.

  3. Additional price action data added later could change the position of the trendline.

[B]Now we have an important point… [/B]

We have stated that and uptrend consists of [U]higher highs and higher lows[/U].

However, since the uptrend trendline is placed underneath the price action, it does not matter too much how the highs behave - as long as we have higher lows.

The same is true for a downtrend.

[B]Therefore our pending definition can be modified…[/B]

[B]In Technical Analysis from A to Z, Steven Achelis[/B] states that an uptrend consists of successively [U]higher lows. [/U]
Note that the higher highs have been missed out.

In a downtrend then consists of successively [U]lower highs.[/U]
Note that the lower lows have been missed out.

(Bit twisty this - you can get tongue tied!! ) :smiley: :smiley: :smiley:

In the end, this simplification will be useful.

[B]We have yet to see how a trend starts and finishes.
This must be included in our definition in order for it to be useful in any way.[/B]

Here is a screenshot of daily EURO/USD showing an uptrend with higher lows but erratic higher highs >>>

tymen…by my own experience in forex i´ve noted that higher lows and lower highs are more importante and more usefull to define a trend than lower lows and higher highs…

do you think this is true??