Clanck, (the sound of the VIPER throwing down the gauntlet), Ok T, I have never ever done this before, (not that anyone really cares :p). Butt, I will be in the “office” all next week and I will be setting some charts to follow your basics, and I will give a report. Of course fills will be on a Sim platform and account, y’all didn’t really think I would risk mine or my clients money live did you? :eek: So there it is in all its nekked glory.
Personally I think there is promise with this, so lets put it to A test.
Hello everyone,
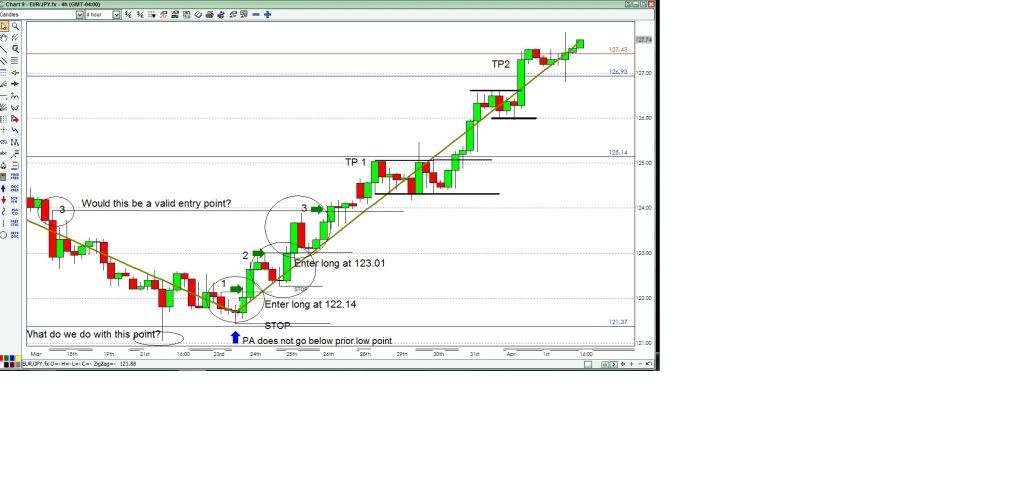
Practing CBL on 4h chart.
Some questions.
On my chart see #1. Looks like the best entry…but the low of the candle was not the lowest price about 11 candles back was the lowest…so is where I marked the entry the correct entry?
See #2 If I missed the first entry is it valid to enter here?
See #3 If I missed the first and 2nd entries would point 3 be a valid entry…see how far back the CBL takes me?
And last question for now…where I marked my Take Profit 1. Price is ranging and at a S/R line…Would I be drawing CBL for a reversal to go short…or both a CBL for short and long and be ready to go either direction?
Thanks
Happy Easter
Jack
Well, there is the problem already, “Sim platform demo account”.
You will never trade the same way on a Sim then when your money is at stake, even a few pennies.
Sorry, your testing will be useless, except it sounds so “important” the way you are writing it. :rolleyes:
I would have made my entry using the bear candle you circled in your diagram with a very long wick.
Making the CBL line from it, would give an entry point that is midway between your circled entries (1) and (2). Not the earliest entry, but not the latest; not to mention it follows the rules Tymen set out.
Is one of the ways to improve the efficiency of this method, using the CBL Line as a trailing stop, by redrawing it as the PA goes in our desired direction, and then exiting when the PA turns and closes above/below it?
I haven’t tested it out or anything, just my late-night ramblings.
Hi
The most relevant S/R are the strongest ones either side of PA. However other strog S/R may well come into play at a later time so it is useful to identify any
Hi Jack
your best entry is drawn with hindsight. CBL’s would be relevant from the lowest low and you would already have your entry line drawn. Tymen may well have some improvement to enable us to take your better entry. Once the move has started we don’t know how long it will continue, so additional or alternative entries may be risky. Currently the strategy is to stay in a trade until either TP2 or S/L is hit, which should be at B/E when TP1 is achieved. By drawing CBL’s at the first S/R line you are creating a situation where you could have opposing positions ie. both long and short or you may be tempted to exit your first trade early, neither of these sound good to me
Let me rephrase. Tyman says to pick out only “two” S/R lines in the daily for our exercise. In chosing two I am asking if the most “recent” two with a few touches (3 or more) of the PA is more relevant or looking back (possibly months) there are numerous touches of another S/R line.
Generally, the more times a price is hit, the more significant it becomes.
Personally, I would place greater importance on an SR line that was hit, say, 10 times in the past 12 months than a more recent SR Line that was only hit, say, 3 times within the past 1 month.
For the purposes of this exercise, my initial instincts are to choose the more historically significant SR lines on the daily chart and choose the more “recent” SR lines on the 4-hour chart.
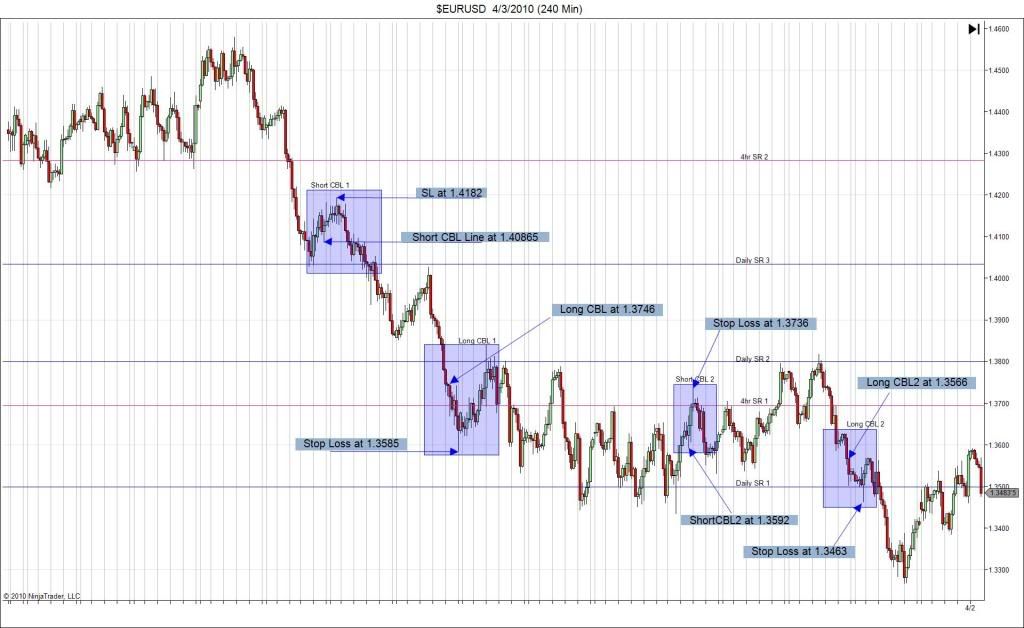
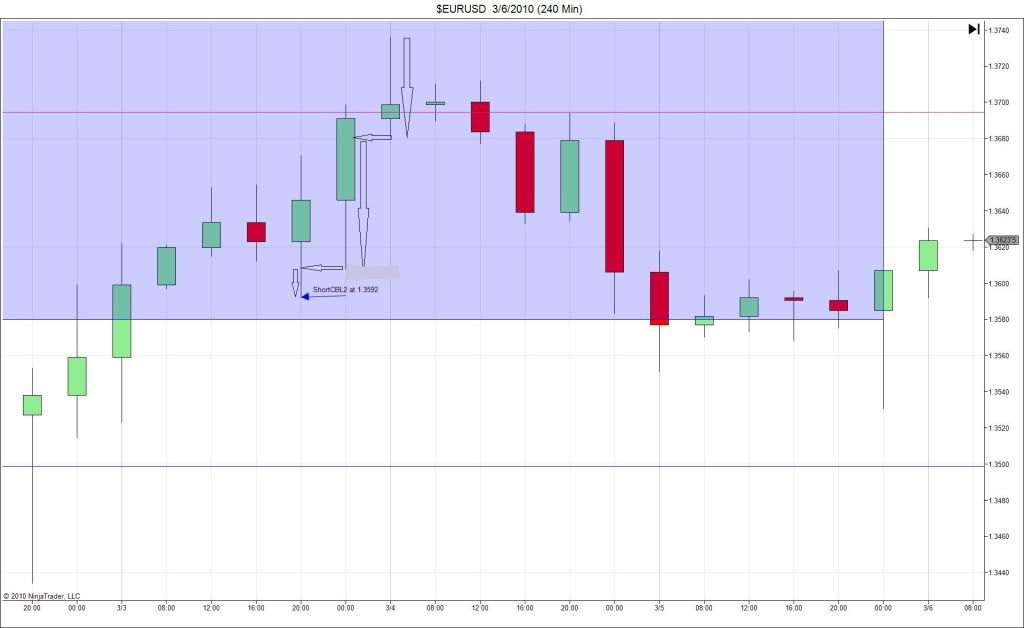
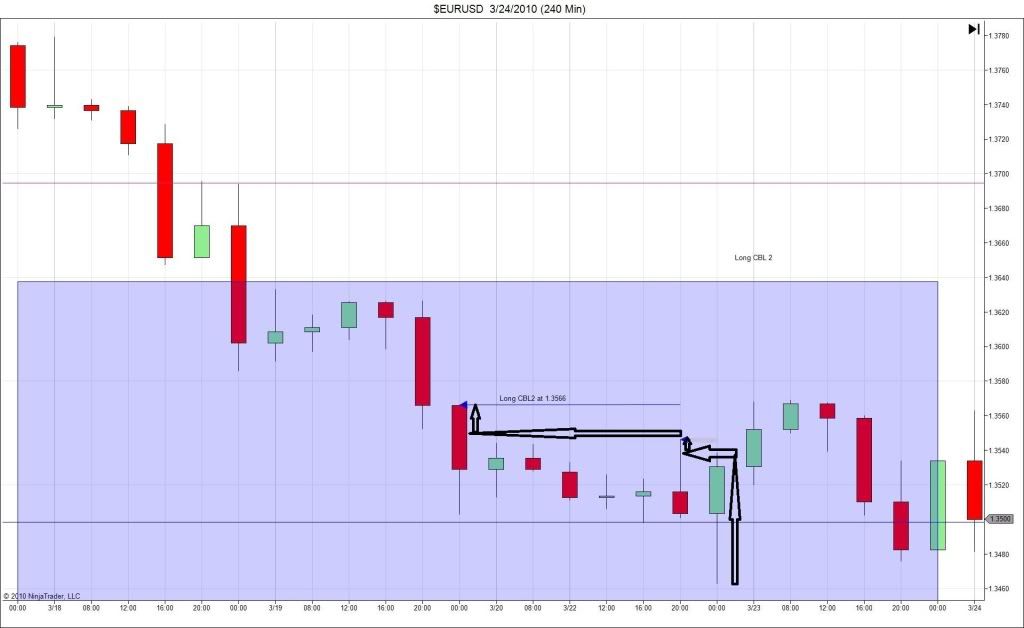
Just learnt how to use Photobucket! Not sure if I did everything correctly but here’s my take on the SRs and CBLs for the EUR/USD with daily and 4 hr trendlines. 3 daily SR and 2 4hr SR lines in all. I did a CBL for 2 short trades and 2 long trades with corresponding Stop Losses. Therefore 4 CBLs and Stop Losses all on the main chart shown here. I zoomed into the 4 instances where I had to calc the CBL.
1) ShortCBL1 Trade: Makes a good profit hitting both 1st and 2nd TP SR lines.
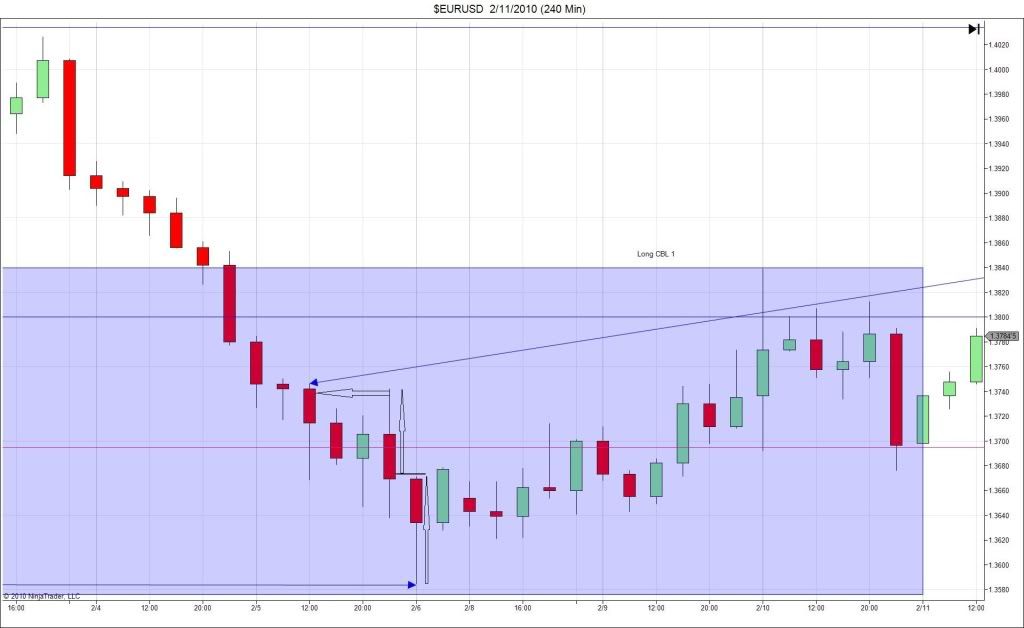
2)Long CBL1 Trade: Only hits the 1st TP SR line before coming back down to hit the Stop Loss moved to the breakeven CBL line.
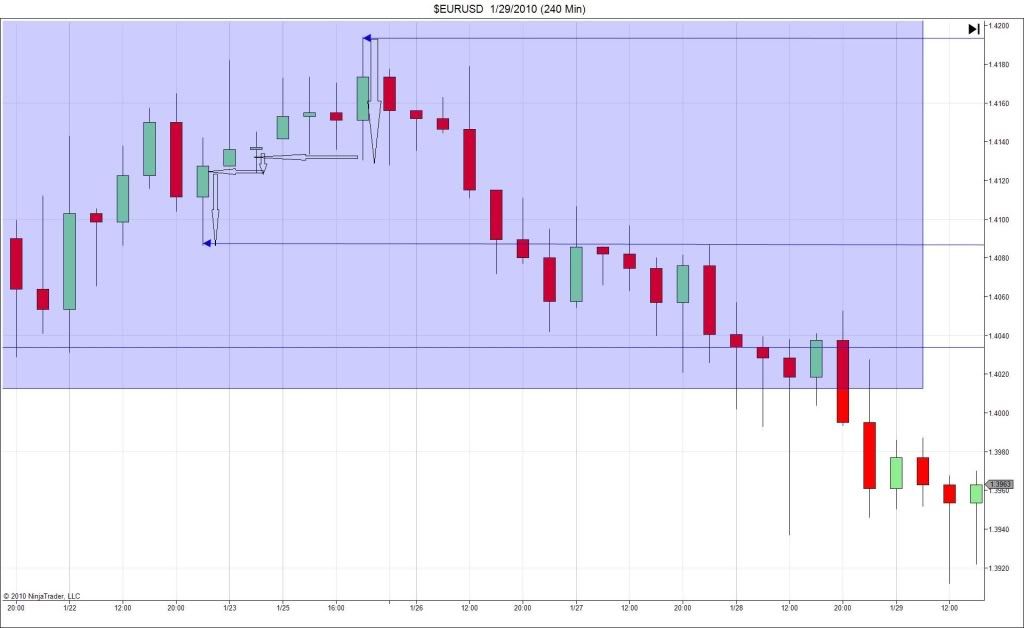
3) Short CBL2 Trade: Doesn’t go to reach the 1st TP SR line so goes back to hit the original stop loss.
4) Long CBL2 Trade: Doesn’t go to reach the 1st TP SR line. It hits the CBL long entry and then almost immediately reverses towards the original stop loss.:eek:
I will post the zoom ins for the 4 CBL calculations in my next post as I can only have 4 max images in any post. Please let me know if I have done something incorrectly.
Mods and Tymen sorry I just can’t resist, you can delete this post, no hard feelings
99, you would make Beau Diamond proud buddly
“Dear shareholders, this is to inform you that I have lost all of the funds in trading activities”
New System, Demo good, live trading Bad.
So anyway, I am a bit heretical here, Tymen is suggesting Daily and 4Hr, and I concur, but I am using Daily & 1 Hr. Just going to post the results maybe once a week so I do not derail or distract.
Looking back at the sequence of charts that Tymen produced he does, on a number of occasions, use the wick of the candle if the projected horizontal line meets at that point.
Thanks for taking a look at my chart. I wasn’t trying to do anything fancy. Tymen popped in for a bit over the Easter and asked us to calc a CBL as the PA is approaching an SR line, so I kinda just picked 2 long and 2 short using only that requirement just randomly. I didn’t use any other additional criteria when picking them.
As a sidenote, I been catching up on the earlier candlestick thread and you were actively involved there also. Respects to a very experienced trader. I only started learning 6 months ago on a spare time basis, so hope I can learn whatever I can from successful traders such as yourself.