One thing I learned with this is: stick to the ORIGINAL plan, no matter what (in terms of taking profit that is, in the long run you’ll be thankful you did)!
SanJ,
do you watch the bond market? It is one the the best indicators on market direction ICT has given us. Even though market flow was down, all signs- stoch, AD & %R pointed up. It was risky going long today but enough signs were there. If anything, this should have been a day to sit on the sidelines until a clear signal was given
I am getting confused with kill zones and their use.
I have heard ICT say that we should aim to take trades in the kill zones and also to never limit our entries to being only inside of them.
I can clearly see the significance of these areas and how they clearly show the sentiment of traders in those continents starting up and exiting their trades for the day. I’m just lost how to apply them in regards to the OTE swings entries and getting inline with the trend.
Should we aim to take trades for the moves inside them or are we trying to catch the moves after their moves? I am confused!
What are the rules put forward by ICT in regards to their use?
Any insight is appreciated! :57:
Hi Sageone, I’ve briefly looked into audusd and its using the ICT moving average method looks great on this pair the MA’s are pointing down and it put in a fractal high today I think(havnt had a chance to. Chack the charts today). Could give a chance of a position trade will wait and see.
I am most interested in learning about bond markets, other indices, and risk tolerance and aversion. I am certain it will bring my trading to the next level…
but first kill zones baby I’m gonna watch that video now  I hope everyone is doing well. Looks like we have some buying pressure but I wonder if it has any legs. At this point I will wait and see what the market tells me. I know one thing Monday is a bank holiday in the USA so I anticipate markets to be thin tomorrow NY and non existent on Monday so likely no trade days for me.
Hey woolo,
Very briefly you want to be looking to [I]enter[/I] within the kill zones. The setups can begin to occur outside of these times and over the course of hours and hours (example - an OTE from 1hr timeframe), however the actually entry point of the setup will usually occur within the killzone and usually at a key S/R level with some SMT divergence. This is how I view the setups anyway.
Michael,
I have just finished reading the COT book of Larry Williams and i visited his website after. I’m curios what do you think of his opinion on technical analysis, cause i remember you saying something in the lines of “he was/is one of your Trading mentors” :
His website:
“If you are not yet making money, what do you do? Go back to the basics! My bet is that you have not learned what moves markets… you have looked at charts and indicators, but those things (Technical Analysis) by and large are mumbo-jumbo, which is why you are not making money”
His book:
“These poor deluded folks think that markets find support and resistance at certain places on their charts. There are many supposed systems for identifying where a market will turn based on price or time ratios. I don’t have the time, space,
or inclination to demolish all of them, so I will just attack the most popular— the arcane notion that markets move according to something called Fibonacci ratios.”
I could give more examples but i think those are explanatory.
GLGT!
Which video did ICT talk about using the bond markets as an indicator?
Hi,
If you have the whole archive, it is found in the “Top Down Analysis”. The video “Major Market Analysis”, which is availaible on YouTube, may help you also.
In case you don’t have the archive, here are the notes from the Top-Down Analysis video:
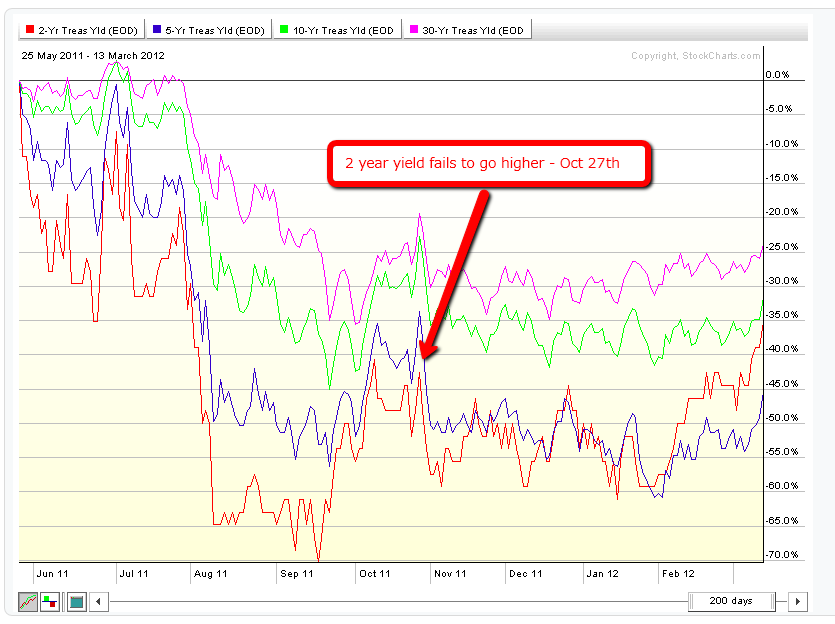
- Monitor the 2Y, 5Y, 10Y and 30Y Treasury yields
- You need only one yield put in a failure swing and it doesn’t matter which one fails to confirm a lower low or higher high
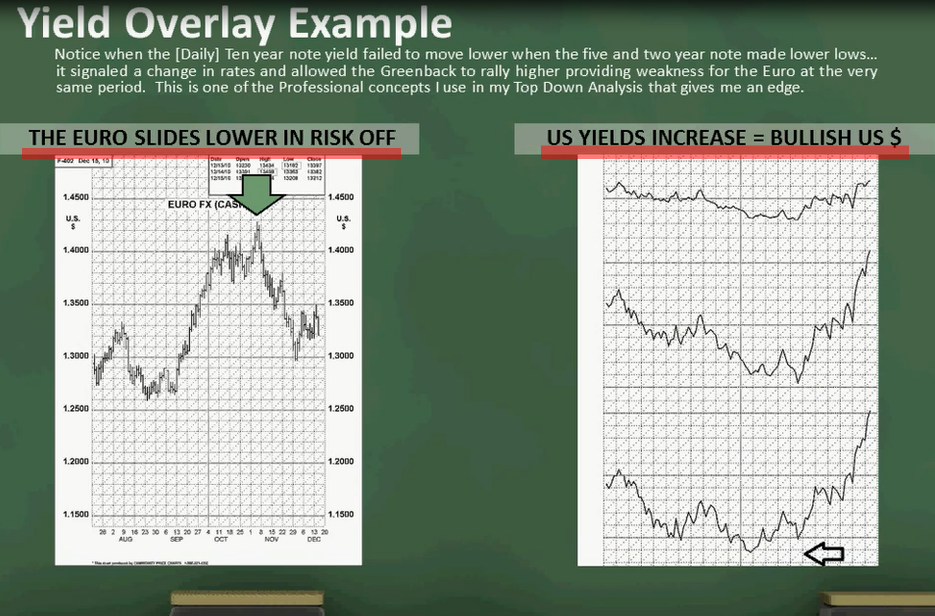
- As the yields move lower and one of the yields fails to make a lower low, this is a signal that the USD is poised to rally.
- As the yields move higher and one of the yields fails to make a higher high, this is a signal that the USD is poised to slide lower.
You can monitor the yield movements for free at this website, I have already set up the settings you need:
http://stockcharts.com/freecharts/perf.html?$UST2Y,$UST5Y,$UST10Y,$UST30Y
Notice how the 2Y Treasury yield failed to post a lower low at the beginning of the month, announcing the recent USD rally.
Happy trading
Hey lazydogs
Hey lazydogs
Tbh i cant say ive got around to it yet…
I really need to get cracking on looking at it this weekend if its proving to be this important. That said, my mindset has only been set to take shorts - as my current [I]“success”[/I] with going long recently hasnt been so great…
Imo, i saw nothing wrong with my Aussie trade this morning, it was good for 60/70 pips and i would have definately taken 3/4 off if i was there to see the wicks forming on the 15m, but unfortunately, work was in the way…
Guess you win some you lose some… to find the next setup… :57:
Another Golden Nugget covered by thick layer of dust I’d like to bring to this thread:
GLGT!
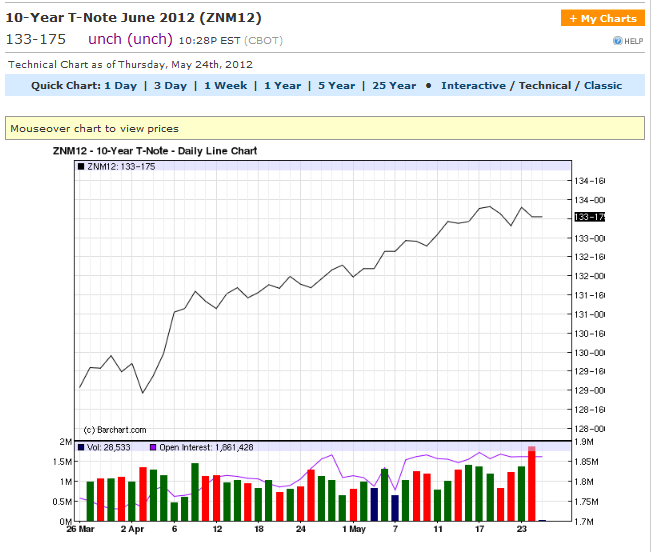
yes, you are right. I should have said it differently because today both bulls and bears could have made money. But the main point I was trying to make is, start wathching the bonds, it has helped me immensely with my daily bias, as well as when to expect market reversals. I use barchart.com. When you bring up the t-note, make sure you click on end of day prices. I then look at the bar chart to see what the days action looked like, then I draw the line chart. When I draw a line chart, I use 2 months. This looks at a shorter timeframe so I can use it for a daily bias. The numbers this site gives you is price rather than yields
I think its pretty amazing that a individual is willing to spend his time(For free) and try and help those that
need some guidance.It’s not all about the MIGHTY DOLLAR
Its about helping those, and the feeling that you get.
ICT you are truely a Great Man.
THANK YOU
I can see how divergence between bonds can help point out tops or bottoms in the market every couple of months or so (like the bottom in january on the dollar pairs), but how do you use it for day-to-day bias?
kubio thanks for posting that.
Michael is the real deal and if someone can’t see that or constantly accuse him of contradicting himself or whatever than maybe they should try something different!
If you can’t see Michael is the real deal than you must be blind! I have never met anyone so sincere and who cared so much about COMPLETE STRANGERS! that he would share his time and his wealth of knowledge with us and the only thing he wants in return is to see some people get it. I’ve been trading since 06 and I can tell you he is presenting a very comprehensive method. It’s not a system it is a method. If you don’t like fibs drop them.
If you don’t like pvots get rid of them or if you feel it is better to start the day at 7:00 instead of 12:00 go for it! The beuty of forex is that you can succeed in any of a number of different ways. there is no wrong or right way.
Lesson number 1. Take full responsibility for your trades. I trade with robots and I still take responsibility! Yo u have to. The person who says its Michaels fault his favorite author hates fibs is going to FAIL. Maybe you should consider waiting tables or something else. Seriously don’t try to drive Michael away just get away from our thread!
There I said it. If however you want to learn and you want to become a professional (which will take years) than by all means join us and be constructive. Please I’m begging you if your looking for someone to blame than look in the mirror and leave the accusing questions and remarks out of this thread please.
Thank you,
John
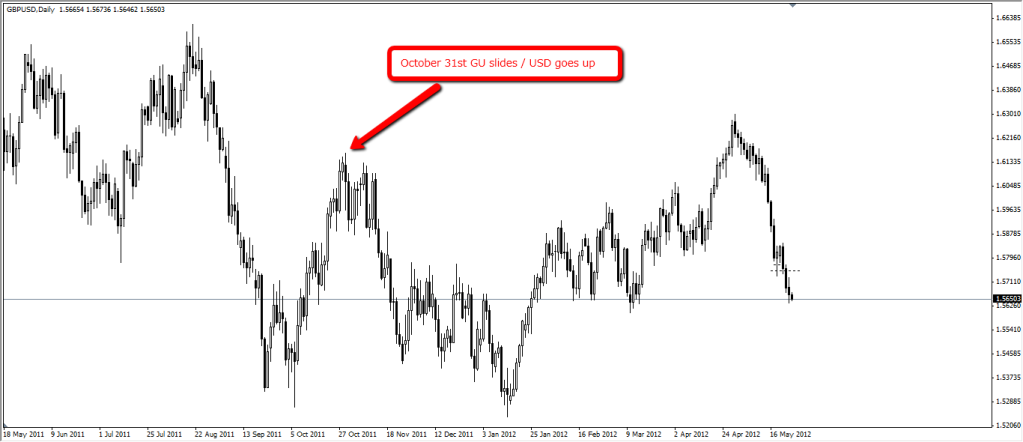
Finally someone who understands! I have been trying to reignite discussion on this area of ICT’s teachings for some time with little success. I just get mixed signals when I apply the methods, and judging by the quality of his other work, and your comments here, I have to believe that the fault lies squarely with my analysis. Could you please take a few minutes to outline how you use the bond market for influence in your trades? Are you using EOD yield data? Which source are you using? Do you see a lag in influence? The most prominent signal I see in the last year is on October 27th when the 2 year yield failed to go higher. This equates to a BEARISH USD does it not? But all I see is it pinning the high on GU to within 3 days, and a 720 pip slide from there.
Regards
Ali
EDIT: I have been trying to post this message for some time, and finally this morning Babypips accepted it. I didn’t see that there had been recent discussion by you and other members, and so i will follow up on that now. Thanks.
you haven’t missed anything…we’re all waiting for lazydogs to teach us his wisdom :59:
It seems to me that Lazydogs is looking at the Futures contract ZNM12 on barchart.com. This shows the T-note price, and not the yield. A move up in the bond price will equate to a strengthening of the USD. ICT taught that a move up in the YIELD will equate to the strengthening of the USD, and as the yield and bond price have an inverse relationship…:33:
Anyway, Lazydogs…can you confirm that this is your source…
Regards
yes Ali, this is what I am referring to. barchart seems to be the most accurate for my analysis. It seems as though every website that reports the bond prices have different closing prices so I’ve been using this one. I would love to dive deeper into this discussion right now, as I believe bonds are what drives every market, and I thought ICT had said at one time that bonds are about as close as you can get to a forward indicator. I am admittedly no expert in this area, but I would love to be one. Unfortunately for this discussion, I am getting ready to head out of town tomorrow morning for a long weekend with my family. I’ll check back next week and we can continue the conversation.