Sorry for the loss HOG it did look like a solid trade yesterday. I to was looking to get in around there but I never got an entry and price just kept pushing higher. Well I am not sure what the bobmaninc is doing today so I will stay out and enjoy my weekend. Think I will go fishing
[B][U]£5.31[/U][/B]
WWWW…IYB
Sorry I’ve been MIA today gang, stayed up waaaaaaaayyyy tooooo late Sunday to watch …
THE MIRACLE IN MEDINAH and then had to nurse a poorly Mrs HoG today, but managed to take +10 from a EU long that was +32 up at one point.
EU covered it’s daily pip range (approx 140) almost to the pip today. So anyway, no analysis done so far, so I’ll kick my week off with this.
[video=youtube_share;1lDNlwk6Tc0]http://youtu.be/1lDNlwk6Tc0[/video]
EDIT: For various reasons, which I won’t get into just now, today marks a bit of a change for me. Therefore I have changed my Avatar to a taxi sign (as you may have noticed). It’s time to use the things we hate the most to motivate us to a better life.
Lol the Medina Meltdown, the Chicago Choke. I didn’t watch all of it, but having a father-in-law who is a professional golfer, as well as his twin brother, kind of meant that I had to watch some. Amazing stuff, the Americans just didn’t turn up on Sunday. Bizarre.
Anyway, back to trading - I have a new computer this week, so have only today managed to get email, internet, eSignal etc working and configured properly, hence my absence over the last few days. But I just wanted to say thank you for posting that last video - I love boxing and film, so it pushed my buttons. Rocky and Snatch are both in my collection…
Anyway, inspiring stuff, hope that the run etc went well, and I will be back in the saddle more properly for the rest of the week. Have not even looked in on my trades, but aside from my Lazarus-style AUD/CAD Short it doesn’t look like I missed much…
ST
And I like the new avatar, for what it represents.
I agree at first I was wandering why you would have that as an avatar till I read your post. Makes sense and hope it helps inspire you.
Anyway I was able to get short on the “bobmaninc” last night in anticipation of the rate cut. Not sure how much I am up at the moment but its quite a bit. Hopefully we can break and stay below the 1.03 fig.
Evening chaps and chap-ettes.
Ok, so I guess Support and Resistance is pretty much covered, at least, we’ve covered it as far as we can without adding something else to the mix. I reckon that something else has to be price action really, and how it reacts to S&R and swing highs/lows and therefore the placement of stops and targets based on all of that
Trouble is that there has already been a few good PA threads including Niki’s (the noisy girl) and 2ndskiesforex has one running just now which I have promised myself to read more but never got to it. SO., I’m wondering what is the best approach to take with it all.
I’m currently reading Steve Nison’s candlestick course, and I am trying to bear in mind that I’m supposed to be going through all of this from a beginner’s point of view, but I just don’t want to regurgitate the info that is already available in the school or on other threads…so that’s tonight’s puzzler.
Now I’m off to look at charts for tonight’s second puzzler.
EDIT:…Ok, thought about it for …oh…must’ve been nearly 5 minutes, and here is what I’m going to do. It’s actually a little selfish in a way, as I’ll explain in a minute, but this is the plan.
When I started this thread the idea WAS to go back to basics and build from the ground up right? Well I think that is the way it should continue, but (and here is the selfish part) the way I’ll do it is like this.
As I mentioned I am reading through the Steve Nison book and as I have mentioned before I struggle to read things. Again not because I can’t read, it’s just that I have a shockingly bad attention span for reading, (pity I don’t have the same thing for writing I hear you say).
So to kill two birds with one stone, (cater to the beginners and help me get through the book) I’m going to drag you all through it with me. Obviously I can’t re-type the book word for word, but I’ll go through the topics as Mr Candlestick deals with them and hopefully dig out some actual examples of each pattern on actual charts.
Yes, I know this may be boring to some, but hey, it’s either that or I talk about…
THE MIRACLE IN MEDINAH for the next 6 months, which I could do :), EASILY :D, but I’ll go with the candlestick idea. 
The actual book was written with equities in mind as far as I can make out, and not for forex. Difference being, and I’m sure there are more than a few people amongst us who can correct me if I am wrong here, is that unlike forex, where one candle’s close level is the next candles opening level, candles for other things can have different open and close levels for consecutive candles.
But I’m sure the majority of the principles are the same. Just before we start though, I have no intention of dragging everyone through the history of candles, nor how they are constructed, for that information IS available in the school and very well written it is, so if anyone wants to know that info, feel free to visit The School Of Pipsology
IYB…HoG
So, first thing Mr Candlestick (Steve Nison) reckons needed discussing is “Reversal Patterns”. These come in this order:
Hammer and Hanging-Man Lines
Engulfing Patterns
Dark Cloud Cover
Piercing Pattern
After that we get into the “Stars”
Morning Star
Evening Star
Morning and Evening Doji Stars
The Shooting star and Inverted Hammer
The Inverted hammer
Following this we get into some more complicated Reversal Patterns but I think we have enough to be getting on with just now, so we’ll go back and start with The Hammer and Hanging-Man Lines.
HOWEVER, there is a point that should be made right from the get-go, which I suppose is worth mentioning to ALL levels of traders.
Before Mr Candlestick mentions a single word to describe ANY of these Reversal Patterns, he takes TWO pages to stress home this point.
“Reversal Patterns” by their very name, create the idea that as soon as these patterns appear, the previous trend of the market will come to a sudden halt and price will go off merrily in the opposite direction, but this is NOT always the case. A Reversal Pattern indicates that the previous trend is likely to CHANGE, not necessarily reverse.
For instance, say we have an established UPTREND, and then a Reversal Signal appears, the price of any pair could well REVERSE into a DOWNTREND(same would hold true for a downtrend changing to an uptrend)

BUT, again imagine we have an UPTREND (downtrend) and a Reversal Signal appears, since this “Reversal Signal” by itself only implies that the prior trend is likely to CHANGE, price could move into a sideways action for some time. This sideways action is the CHANGE, after which price may well resume it’s UP (down) move.

(Come on, you have to admire the artist if nothing else ??? LOL )
There again, if a Reversal Signal appears after an UP (down) move, price could move sideways for a while (the change in direction) and THEN Reverse and move DOWN (up)

Picasso eat yer heart out !!
So keep in mind beginner-lings, NOTHING is written in stone that says the appearance of a so-called Reversal Signal automatically means things are going to go in reverse. We need confirmation of the change in direction to act. I guess that confirmation is something we will deal with as we go through each topic. First topic then is Hammers and hanging-Men
Speaking of reversal patterns, I’m long EU tonight off 2911 but don’t see PA breaking the recent high of 2967 in the first attempt at any rate. So will be looking for a decent place to go short before then. But getting ahead of myself.
Like the new avatar hog and reason for it! 
HoG, just remember PA is about what “the big sharks” are doing. How price moves sets S/R levels. You can use japanese candlesticks or like RC just a line… The good thing about the candlesticks is the OHLC info that can give good entry levels.
I actually took a short from the same level last night RC. Didn’t see price getting to 1-2930 last night so that was where I placed my stop. Only targeted +20 pips (1:1 risk) so put my target at 1-2890.
1-2880 ish seems strong just now.
4 Hours on EU and FXCM Dollar index are both pointing towards EU going up, at least towards the 1-2970 ish you mentioned
Was finding it difficult to talk about S&R by itself yunny without bringing some sort of price action in and how price reacts to certain levels. Due to a lack of knowledge on my part about anything other than candlesticks, i thought it would be as good a place as any to start.
But the good thing about this place is that the conversation tends to find it’s own path so who knows where we’ll end up with it LOL! So the starting point of candlesticks is really just the nudge for the stick floating down the river, now that it’s been set free, it can go anywhere:)
Morning all. Just to add to HoG’s artwork-heavy candlestick posts, I have often wondered whether trading would be easier for many beginners if reversal patterns had instead been named hesitation patterns, or even ‘pause for thought patterns’, as that is really a more accurate reflection of what they are. Price generally stalls and ponders whether it wants to breach or reject the next level, or if it wants more time to think about it then alternatively it might want to range for a while. This is why Entries out of reversal patterns that depend upon an actual reversal often work well being based around the break of the low of a bar (for a short Entry) as that gives some indication that the reversal pattern might lead to a reversal. Others consider the whole reversal pattern a mini-range and place orders under the low of the entire range (which could be only a few bars).
I’m not sure that that is clear, but I’ve said it now!
I hope you are still short the “bobmaninc” bobmaninc. Seems to have moved down nicely even from last night. Well played Sir!
I actually even call it the “bobmaninc” now when I am talking to myself :D(that happens a lot recently, is that a sign of something?)
I’m thinking 1-0165 ish seems to be the next support level ???
Lol I call it the bobmaninc here now, too!
My AUD/CAD Short (finally) hit TP overnight for +115 pips, so I am free to join the AUD/USD party. Currently in an intraday short, looking for 1.0194. Now that’s not being greedy is it?!
ST
I think you’re right ST, the term “Reversal Pattern” in itself probably leads to trouble for many beginners. I think one of the most frustrating things in forex, and one of the hardest concepts for people to grasp is that NOTHING is certain, there is no fixed recipe.
And thank you for noticing the artwork, it’s a bit of a hobby of mine. My other Forex inspired efforts include:
If YOU get good at trading, YOU can get a load of chicks too !

Trading without a stop loss

And my personal favourite
Smug girl who shorted the Euro/Dollar in May

They’re a bit rough but I haven’t been doing it long.
Ok, it’s now official, the AU has now officially been re-named the “bobmaninc”.
And apparently greed is good ST, …well, maybe not good as such, but it certainly allows for a better family holiday.
Yep mixed bunch across the tf’s today, but as mentioned… was looking for a longer play short. Think I might have found it @ 2911? LOL!!! Well thats where I’m at… 2911 short.
EDIT: Don’t expect support to hold @ 2885… tested too many times and a nice head and shoulder’s (‘M’ pattern) forming on the 1h.
Yes I am still in the bobmaninc short.
I am going to post a chart of how I trade reversal patterns. This is an old trade I took but I feel the overall chart will work well for this explanation.
There are 2 types of patterns I look for when trading 1 was mentioned by HOG and the other I am not sure if it has been named but I find it to be a strong signal.
The first which is covered alot on my thread is the inverted hammer. Since I like to short of course I look for inverted hammers. I try to stay away from names of candle patterns because there are just so many of them its hard to keep up. I just call them pinbars.
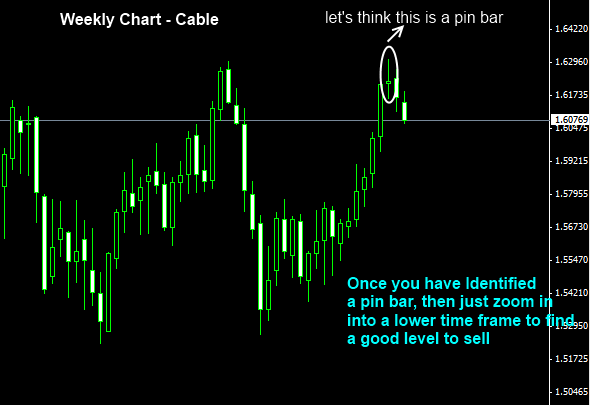
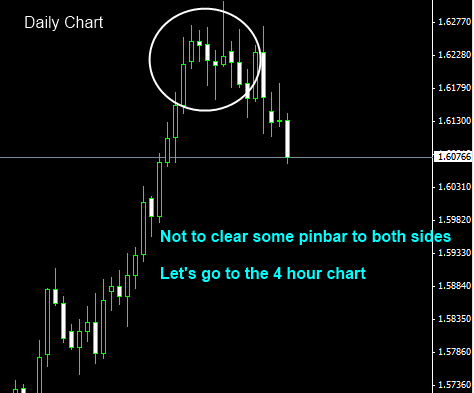
On a pin bar I trade them very simply. Not sure what time frame the chart was below but I like to start with the daily chart (judging by the 100 pip intervals I would have to say this is the daily). Now when I see price run up into an area of resistance (the further price has run up with no interruptions the better) and forms a pin bar the longer the wick the better) I will wait to enter on the 50% retracement of the daily candles wick. When price (if price I should say) reaches this area then I will drop to a lower timeframe (1hr, 15min) and look for another pinbar to from and try to get that 50% mark on that candles wick as well.
The reason I use 2 timeframes for this is once a pin bars forms on the daily and price is reaching the 50% mark of the candles wick it can be a little intimidating as you have no clue that price will in fact stop and reverse. Takes a lot to be able to enter on a bullish candle (at the time of entry). This is why I use the lower time frame to confirm the run up the daily candles wick has indeed run out of steam. The other reason is this level tends to give you an entry at the high of the day and if you are like me shorting the bobmaninc the high of the day is your moment to shine. In the chart below I have highlighted these possible entries with a yellow circle (keep in mind I can not look to the left on this chart so I am assuming these are S/R levels.
This method works sort of like a slingshot. In order to fire a slingshot you must pull it back. This will give the ammo in the sling shot enough to propel to the intended target. Well price must do the same it must pull back to get enough momentum to hit the intended target. Keep in mind though if it pulls back to far it will break and thats not good for anybody.
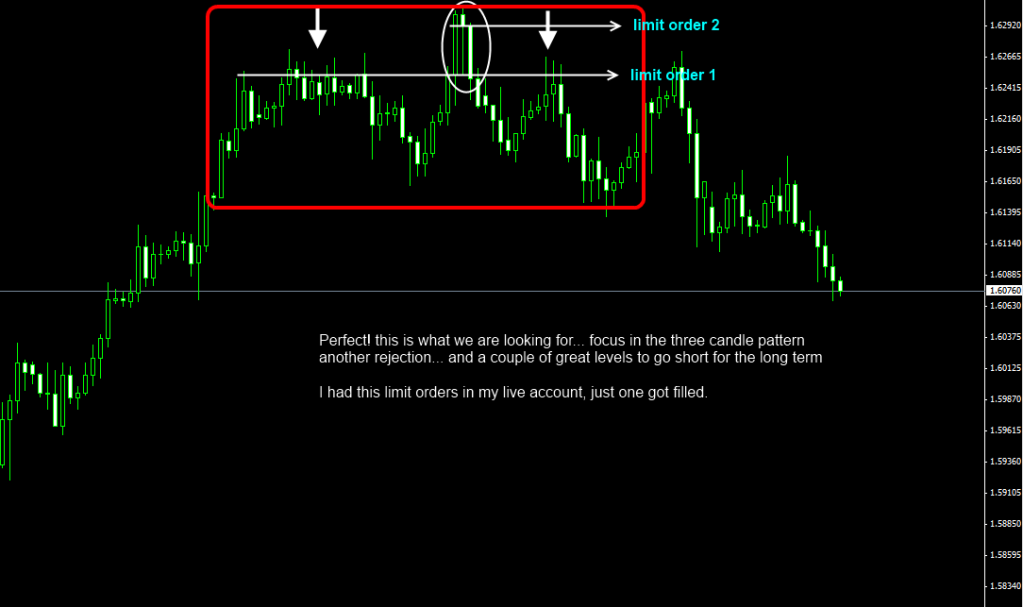
The second formation I use (not sure if it has a name or not) is based off a doji. After getting my butt kicked trading dojis last year I came up with this concept and it does not form to often but when it does it is a very probable setup. Assuming price is running up to one of those horizontal lines that price bounces off so perfectly on your chart. I must see a huge bull candle. I mean big and I want it to break that resistance level by a little bit. This signals a breakout since it is such a huge momentum candle. Well if a doji form immediately after that huge momentum candle. This signals to me its a fakeout and big money manipulation. They are running price up to get out of there long positions. Again I must see price reach the 50% retracment of the diji’s top wick for the same reasons stated above. In the chart below I highlighted these setup in white.

Good post bobmaninc, enjoyed reading it mate.
First don’t forget what Munehisa Homma tried to identify with candlesticks is the human behavior of buying and selling, so the best time frame to apply is the daily… of course it works on lower TF but latelly I only pay attention to the daily patterns 
Japanese Candlesticks are mainly about reversals, there are some good continuation patterns but in my opinion they are harder to trade.
Ok they are reversals… reversals of what?.. of a up or down move… this is the first thing to look at.
About the hammers (pin bars)… they are good signals, easy to identify, but not the best to trade if you are looking for a reversal, I prefer two or three candle patterns… they form much better S/R levels that can defend a trade.
Now I trade pin bars only if they bounce off a good S/R or if something fundamentally has changed.
The way to trade a pin bar is either you jump into a trade as soon as the candle is formed or wait for a retracement.
But a retracement where?
Here is an example of a live trade… it is NOT a pin bar… more like a doji, I used it here just to show how I enter a retracement:
http://i1086.photobucket.com/albums/j449/yunny11/eurusd131.png
http://i1086.photobucket.com/albums/j449/yunny11/eurusd132.png
http://i1086.photobucket.com/albums/j449/yunny11/eurusd133.png