I like it Yunny - and agree…
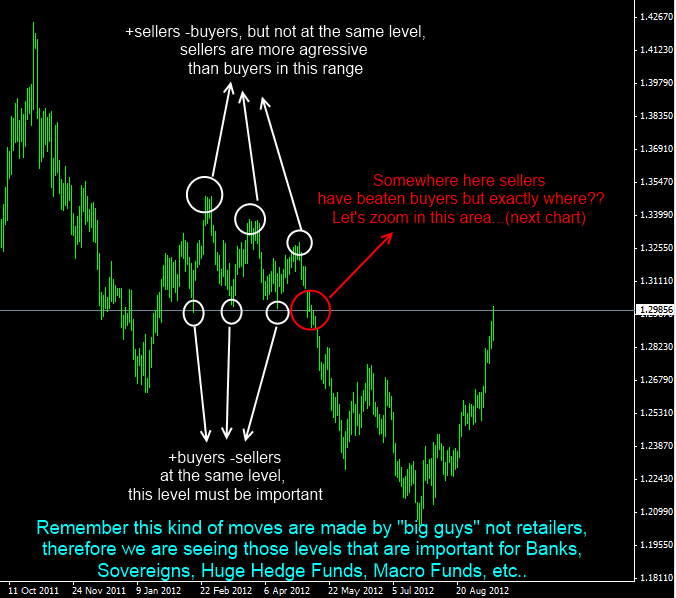
I always thought of it as basically price is moving because it is trying to find its equilibrium - its balance. Simply, price will move up when there are more buyers than sellers, and price will move down when there are more sellers than buyers. Being able to identify where buyers and sellers may be laying presents good opportunity for entries and exits…
In terms of the daily chart, id mark my next line of resistence as the 1.302/1.303
I dont look at each one as an exact level - but then i dont use as a wide area as you said you do - but i allow a fluctuation of about 10/15 pips before or after this level to say its tested it. Id expect to see some reaction in price at this level - be it a bounce or a break through and retest as support…
Good to see you upstairs RC. As long as I know you’re still lurking in the back ground that’ll do for now LOL!!
Anyone else apart from me and Iya wanting to do the S&R experiment let me know. I will be missing for the rest of the evening guys as both HoGettes are unwell this evening.
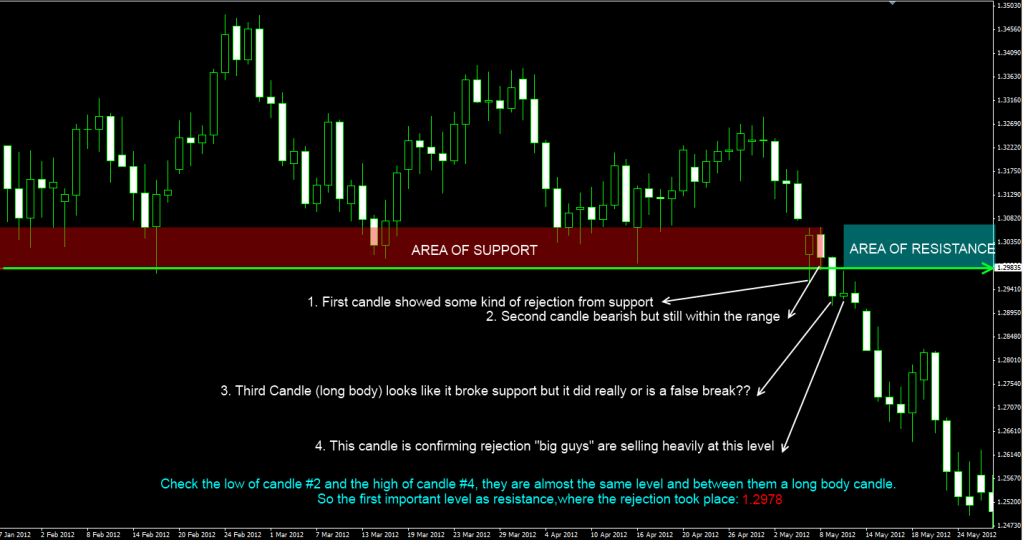
Ok but how to trade this level?? Under “normal” conditions I would have sold small positions just few pips ahead 1.2978, but today Helicopter Ben turned on the printing press… so I will wait for some PA confirmation
Notice that I have shaded an area, is the last daily range comprised of two daily indecision candles… that area is where I expect to see some price reversal
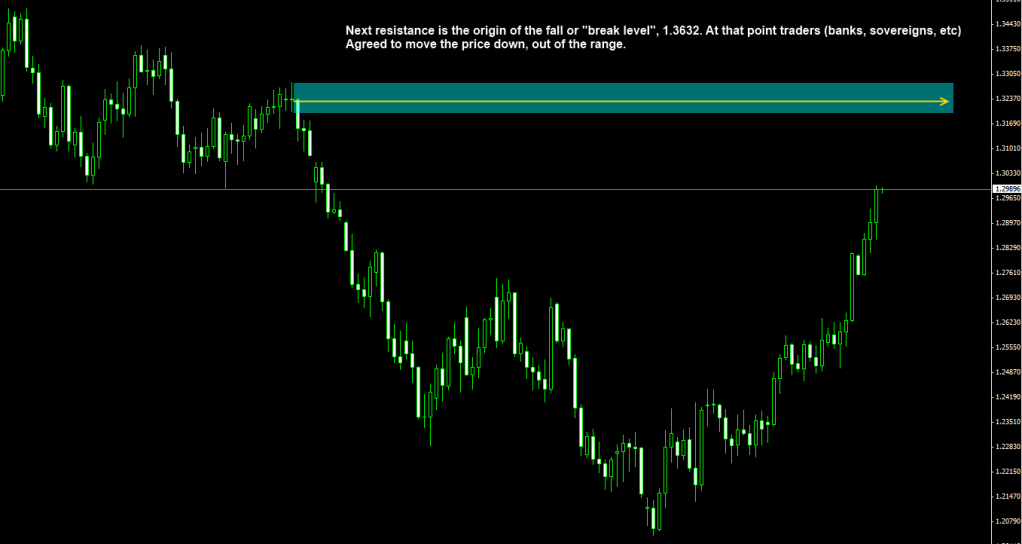
There certainly isn’t that much in the way of hard Resistance before that level. I have a soft level on my chart just shy of the 1.3300 level which I put on ages ago, and fundamentals can turn this Pair around for little technical reason, but from a TA perspective if we run up to 1.36ish that’s certainly where I would be looking for a reason to short.
(Sorry pressed the wrong button and submitted so this is not so much an edit as a continuation!)
It does depend on trading style, though - looking at the Daily, Price is very overextended away from the EMA’s, so under normal circumstances we could expect to see some retracement which could present as a short-term downtrend, so although that would be counter to the overall uptrend, some traders might look for the odd intraday countertrend short while we’re on our way up. That is more discretionary stuff and not for everyone but it is certainly something I will take if the market looks good for it.
Good morning all (or at least, it’s morning here in a windy Peak District),
I am very late to this thread, sorry - lots going on this week and then the thread moved on so fast that I never seemed to have anything pertinent to say. Anyway, personally I am delighted to see the old crew porting across to a tighter, more trading-focussed thread, as trading is why we are all here at the end of the day. With that in mind, I thought that I would presume to repeat my post from the other thread here, bringing the ‘trading basics’ video into this new thread. Not because I think that it is particularly wonderful or new, but because I like its focussed simplicity so thought it suited the new, stripped-out ethos of this new thread.
Personally, I like the approach being taken here, focussing on one aspect of trading at a time, but the trouble is that they overlap so much. S&R and PA are the two things I could not trade without, so S&R makes a good starting point, however it encompasses a lot of territory that might deserve its own billing. I use EMA’s, trendlines (sometimes), Fib levels, and all of that is really just forms of S&R. So it’s a pretty blurred area, unfortunately.
Anyway, I don’t have anything particular to say, I just realized that this thread was scooting away from me so thought I would dive in with a video and a ramble about S&R which would get me subscribed and in the mix. I’ll try to make future posts a little tighter around the middle.
But I’m liking the new, focussed trading feel. As well as the Eric Thomas video - HoG: rewatch it daily, each morning when you sit down to trade. It’ll keep you in the zone and remind you of the stakes.
No, I closed all my E/U longs last week Now I am looking to go short or long in a good pull back, but not today, maybe on tuesday when all the QE3 stuff already had settled down…
I’m not bothered which pair. I usually trade EU, GU, or AU so I would prefer a pair that none of us were particularly familiar with, definitely not EU as that is the pair being used as example on the thread right now anyway. But other than that, I don’t mind, you decide if you want.
Just pick a pair, and any time AFTER close of trading tonight, we can post our S&R levels to watch for next week. Just thought it would be interesting to see how the “predictions” worked out.
Funny you should say what you did about S&R taking in a wide array of subjects, I went to write a post about it yesterday and to be honest I didn’t really know what to include and what to leave out at the start.
hence the reason for the picking a pair and posting charts of S&R levels to watch for next week. No trend lines, or fibs or anything else, just straight forward, horizontal S&R levels. Thought that might be a good addition to the great stuff yunny is putting in just now. And as good a place to start as any.
As for Eric Thomas video ST, I’ve downloaded it on to my phone. Watching it about 5 times a day now, mixed in with this;
Trouble with it all, as you said, is that it is pretty blurred. On one hand you have RC’s point of view who isn’t too enthusiastic on tradition S&R levels. On the other you have the traditional view. Regardless, I think it is ALL reaction points and trying to identify them as best we can.
I believe you need to find a zone which to work with for that day…
Something to set the tone, if you will…
For this reason, I cant forsee the future with my type of system, because I need to have the highs and lows from a certain hour… I have been using 11:00-12:00…
And so far, its great, but thats just me…
Sorry fellas for intruding on the thread, I;ll take my ramblin else where…
That’s a good point. As far as I trade from the Raw price action I always look on Cross and exotic pairs. It worked very well past. So I will post from these pairs with possible entry areas. I’m a newbie, so I have no clear idea about other technicals, fundamental factors and indicators. (I can understand only stochastic). So my chart will plain with two or three lines.
I hope pros can help me on my mistakes and ofcourse it will be a great learning curve.


 Now I am looking to go short or long in a good pull back, but not today, maybe on tuesday when all the QE3 stuff already had settled down…