Did not mean to snub anyone T. I looked at your post above and thought ‘that’s cool’ I scanned several posts that Yunny had made about a pair I’m watching, and thought 'golly, it’s nice that he is following this pair through and adding charts. Any posts discussing trading, or that are just nice, I find great reading - so no offense… And also I don’t really ise the word ‘golly’
Sent you a PM.
When you click the brainev site you need to scroll down to download the free mp3.
No matter, it appears I misread it… Sorry… Yunny still on the right track. And when my thought becomes true, you guys may have a new trade setup available…
Got it DD, thanks again
Let’s see if I own a Crystal Ball
Then…
Now…
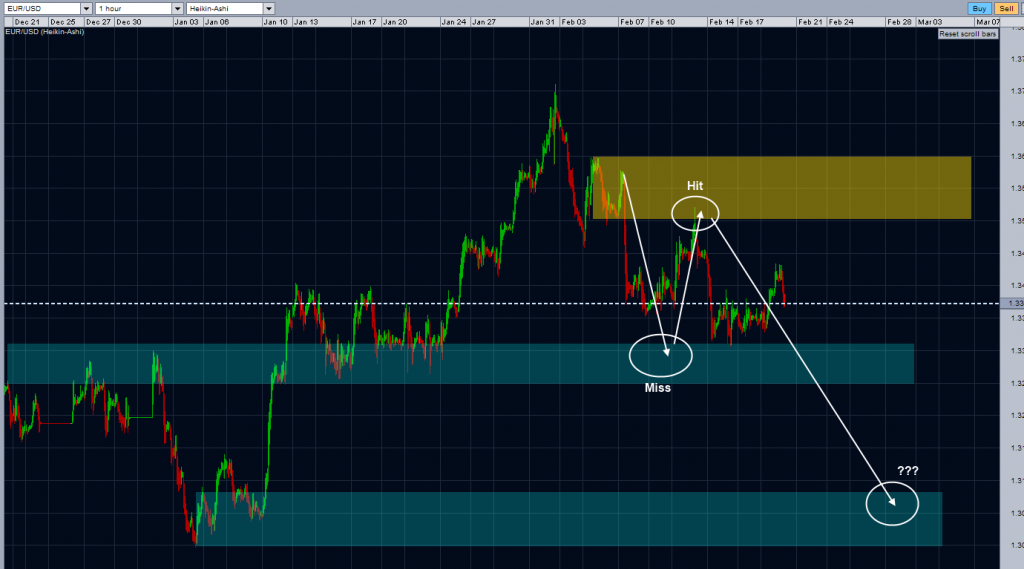
http://i1086.photobucket.com/albums/j449/yunny11/eurusd191_zps7c64e521.png
Then…
Now…
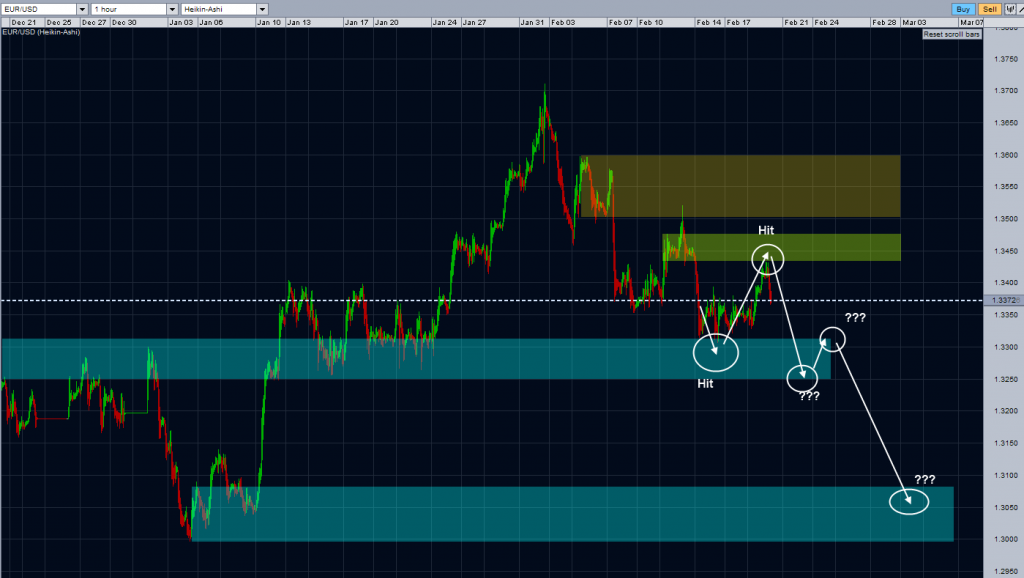
http://i1086.photobucket.com/albums/j449/yunny11/eurusd192_zps8420ba11.png
You won’t hear me complaining when that happens Yunny1…  According my method the current SL of this leg lies on 1.33023 for the H1 chart.

 Still holding the E/U short but a bit concerned about the latest consolidation area…
Before I write what I am about to write, I would just like to say that I have absolutely no intention of letting this turn into an ICT discussion, and if it does, I shall abandon this place forever. This is what it is and anyone is free to use, or ignore this information, as they see fit.
That said it would also be appreciated if anyone has a valid opinion, or correction, of how I have used, or indeed mis-used, the information or concept. [B]REMEMBER THOUGH[/B], we are discussing a possible trading strategy here, [U][B]NOT[/B][/U] a person.
Ok then, here we go.
A couple of weeks ago a thread was started in Newbie Island by SteveB called ICT London Open. This was the first post of it:
I apologise right now to SteveB for stealing his post!
This was the first answer to that thread:
Now, before I start, I’d just like to say that I NEVER watched any of ICT’s video’s, so what I have done may well be wrong according to the methods that anyone was supposed to use.
But these two posts had me wondering why no-one had actually ever tested, live, and recorded the results of that test, any of the ICT concepts, and since the London Open was the concept that had been brought up in this thread, I thought I would go ahead and test it.
This is the parameters that I used, like I said at the start, I ay well have done something wrong and if I have, please feel free to tell me. Also, I would appreciate any comments as to the worth of this research of “strategy”
I went back to the start of 2011 and in that year there was 260 trading days. I back-tested the 7am-8am Hourly candle (on EUR/USD ONLY) and the 8am-9am Hourly candle.
Whichever direction those candles were broken (long or short) I tested to see if price then moved 10 pips in profit and also 15 pips in profit, so 4 tests in all. I also used the opposite end of the candle broken to place my stop loss. So the question really was, "Once the candle was broken, in either direction, did price move 10 and then 15 pips in profit, before price, at any point of the day, reversed and moved above or below the opposite end of the broken candle? Got that? Didn’t think so LOL!!
I will also over the next week or so test 2012 and add the results but for now this is the results of the 2011 test.
[B][U]7am-8am Candle:[/U][/B]
10 pips = 78.5% win
15 pips = 72.3% win
[B][U]8am-9am[/U][/B]
10 pips 85.8% Win
15 pips 78.8% Win
It should be noted right now that using the opposite end of the candle broken sometimes gives you a risk of 50 pips (sometimes more) to make 10 pips profit and I’m also working right now on what the average risk was before it can really be determined whether overall the strat would have been successful, but I’ll get back to you all on that one.
I have also set up an Oanda demo account and I’ll try to work out how to link it to Myfxbook and test the strat (probably only on the break of the 8am-9am candle for 10 pips), next week.
Hi Hog thanks for the stats on the strategy… Good win percentage there mate but whats the reward:risk on the trades? If its 1:1 minimum then its all good.
Been a boring week for me but I am currently stalking a GU long.
Trade reached target 2 @ 1.0200.
250 pips gained.
R/R 1:5
Strategy used: Yunny’s Paper, Pencil and Ruler Deep Analysis 
Hahaha I like this one :). Well done
I’ve got the paper and pencil part down. The ruler part still gives me trouble but I am working on it.
Hi Aesthetic
Off the top of my head I would say that I would be surprised if ANY of the trades offered a R:R as good as 1:1. Some of them, if I remember right, we’re even risking 60 to make 10.
But if you give me half an hour, possibly an hour, I’ll come back and edit this post to show what was risked, won, lost and overall profitability of the method.
PS, you’re looking great in the new avatar, been working out???
I wanted to let the 5 hour energy drink kick in a little, but nothing happening yet. Let me make sure I understand the parameters, when you say waited for the candle to break, you mean that if the 7-8 candle was a bull candle, you wanted to see if 10 pips (in one test) and 15pips (in the other) would be made prior to the low of the candle being taken out starting entering exaclty at 8:00. This means that one would enter every day 8:00? Is that correct.? Versus saying that there was a bullish candle from 7-8, but you waited until the high of the 7-8 candle was taken out first, and then entered. The difference is that in the first case your test population would have 260 items times the four tests. In the second case, there could be times where the entry candle never breaks the hourly test candle, and your population would be smaller.
Same for the 8-9 GMT candle, except you would not enter until 9:00, and if the 8-9 candle had been bearish, you would enter short at 9:00, with stop loss at the high of the 8-9 candle, with the first test to see if 10 pips could be made and the second to be if 15 could be made, prior to this high being taken out.
I think this could be a valuable test, and I do have several ideas, but want to be sure I understand it. Is my question clear?
Hi Hogarste
I don’t think I have explained things very well. Try this…
Get in your mind a picture of the 7am-8am candle. ie opens at 7am GMT and closes at 8am GMT.
Right then, WHICHEVER direction the 7am-8am candle range is broken by the 8am-9am candle, whether it is a bullish break or a bearish break, I’ve tested to see if price continued 10 pips passed the break AND 15 pips passed the break.

In each case, since there are 260 tradings days, each has 260 tests as sometimes price WILL go 10 pips passed the break but reverse and take out the other side of the 7am-8am candle range (where I put my stop loss) before it moves 15 pips.
You’d just reverse everything for a bullish break. As soon as the 8am-9am candle breaks above the high of the 7am - 8am candle, you’d go long and put your stop loss at the bottom of the 7am-8am candle.
I’m working out right now the risk/reward for all 4 tests. I’ve only done the first 100 trades so far of 2011 and the results are not really what you’d expect from the percentages given above.
All 4 tests are in profit (from +297 to +455) but some of the R:R are shocking. Highest risk so far to make 15 pips was 79 pips !!.
Will post the results when I’m finished though.
Let me know if I’ve still not explained it properly
Edit: forgot to say, you only enter when the candle high or low is broken
OK, I understand better now. So in theory if the second candle we’re looking at to break the tested candle winds up being an inside candle, we’d wait until the next and so on, until the period being tested had it’s high or low broken, and then the test is for 10, and another for 15… (two tests, times tow different hourly periods) OK got it.
There are two seperate thoughts that come to mind, 1) is this what folks call that fellow’s methodlology? 2) What is the value of the test? I think it’s more important to focus on the second question then the first. However, I’m in an interesing position, becasue, I understand and utilize a good number of his methods and concepts, but not all.
In my opinion, this test takes one of his concepts (time of day regarding London Open) and tries to build a method out of it. My trading (or lack of trading this week) has two starting points, which are a) bias and b) entry. First I determine a bias (weekly,daily…) then I see if I can identify an entry taking place. This study is something I would use in terms of trying to find entries.
Did you track these numbers in Excel, or on paper? I ask, because while I would start with what you’ve put together, I think the next step would be to filter the data, to find out when the advantage is at it’s maximum, or if there is a way to minimize risk. For example, if we look at the population you have, do we increase our chances for being right (and or reduce potential loss size) if we filter on trades that are in the direction the market has been moving in; and or when there is some type of price divergence taking place, does this help bring us towards a profitable stratedgy? Are there specific days of the week that have a higher potential for succeeding than others? I think this test could help lead to an edge, but am wondering how best to exploit it.
My concern is that you’re now thinking with a Scottish dialect: “Laddy… Explative you… Do you understand how much time it takes to compile the data that I have? Let’s see you do some of the work mister question man…” which is a valid point.
I guess what I’m saying is, the winning percentage is pretty good, though I’m sure a part of it has to do with the risk you mentioned. Now that you have this starting point, what ways would you use to point this towards an actual stratedgy for testing.
HOG, if you’re looking for a good London open strat, and don’t want to reinvent the wheel, IMO here’s a very good one. The always charming and recently mia RC posted it up a few years back.
http://forums.babypips.com/free-forex-trading-systems/29863-london-breakout-1-a-25.html#post139152
It’s a different twist than the 7:00 & 8:00 hour candle strat you’re working with, might be worth taking a look at.
The 5th candle 04:00-04:59 EST = 09:00-09:59 in London.
.
PS I don’t know about it being “90% effective”… I would just humbly say it’s good.
As you said Hogarste, the million dollar question is once we have the information, what on earth do we do with it?
I suppose the next logical step would be to try and filter it out someway to give yourself some kind of edge. Obviously I could be wrong, but I reckon if you were trying to trade for a living, and you were slogging through it all yourself, you’d go through a whole raft of these kinds of tests.
This info is a starting point, where you go with it, whether it’s useful, or whether it goes in the mental bin, I don’t really know to be honest, it would take some looking in to.
Thanks for the link d-pip. Also served to remind me that I miss Mr Carter.