As far as I can make out JCP, MyFXBook only exists to prove to other people that what your doing either works or doesn’t work. And d’you know what? I’m just not that interested in proving anything to anyone anymore.
If it serves a better purpose than that, then I apologise for I don’t know how to use it to it’s best effect.
Here’s one, although I ain’t taking any of them as a trade tonight. Euro, Dollar and Aussie all showing pretty much the same chart against the yen right now:
Dollar and Aussie still showing “proper order” while the 10 has dipped below the 20 on the Euro chart.
All 3 4Hour charts all printing the same hammer as the dailys but all 10 EMA’s are now below 20’s for all 3 charts. Still think it’s a pop up and some pips to be had, but not taking anything
Or on the other hand, is the EUR/JPY a better SHORT when it pops back up to previous resistance??
Now that may be the better move,
The 200 EMA on the 1 hour EUR/JPY is 127.491 as I write. I’m going to leave a short order over night at 127.550… target will be at the bottom of the 1 hour chart hammer 125.000. Stop will be 2% of balance (2% of $147 =$2.94 or 29 pips above entry)
may not get hit by the morning, nothing lost then.
Looks as though I got took into the EUR/YEN trade during the 5am6am candle
Thinking for getting in was price had reached a previous resistance, still had my proper order.
Looking at the economic calendar there are some news reports out this morning that could potentially make price pop up through my 29 pip stop, if it doesn’t get there before it, so a lesson learned there anyway.
Levels for the trade are noted on the chart.
Oh, BTW, good morning all.
EDIT: Trade just went +10 pips. Tempted to move my stop to break even already. May seem very premature to do this but the news releases which I neglected to check for before the trade opened are now weighing on my mind.
However we are just before LO and a pop could take me out looking at the 4hour and the daily. All part of the learning curve now gang
EDIT 2: Yep, pop 20 minutes after LO took me out. Have a look back at it later today.
Looks as though the above trade is now going the way I had hoped it would, just too late for my trade that is. Don’t have time for a post mortem right now. Talk later
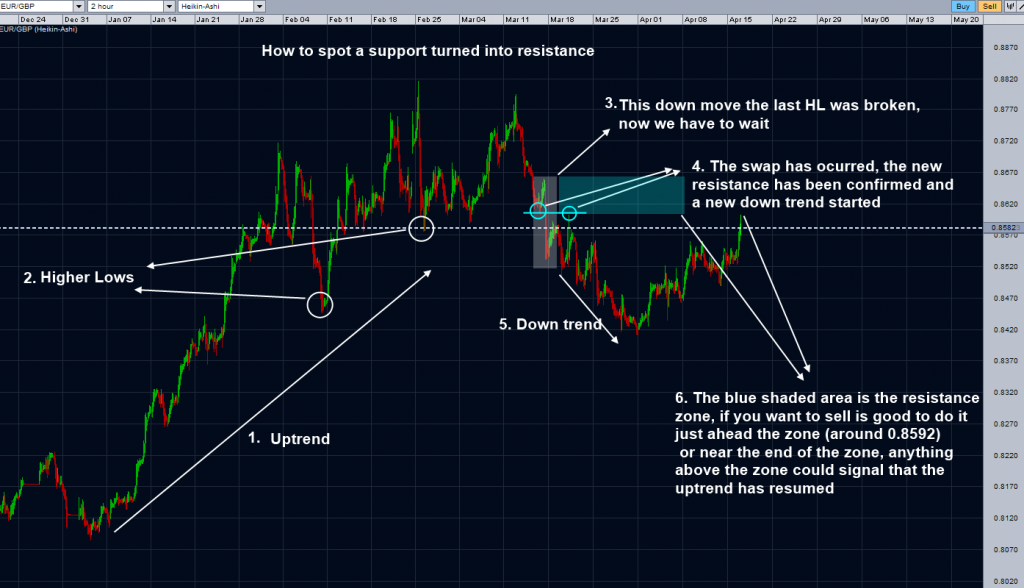
Just shorted EUR/GBP as price has reached previous support now looking for it to be resistance, and price has also reached midway point of R2 and R3 on daily pivots. Short at 0.85757, gave myself a stop of 25 pips and targeting 25 pips for 1:1 risk.
Looks like a wild ride Hog? I’ve been short GU these past two days off the 4h, but this morning went long. I can’t figure out if its a counter trend trade against the daily or with trend with the weekly? LOL!!!
4 hour had reached previous resistance/support at around 0.8580 so I took the short. It HAD started to retrace, as you can see on the daily also, but the euro seems to be on a bit of a rampage right now so I’ve lost this trade also.
Both trades today were taken against the “proper order”, which confuses me a little regarding the eur/jpy trade from this morning cos I thought it was with that trade. I don’t know what I’ve done there but I’ve made a bit of a backside of it somehow.
This mornings trade was also taken against the hammer which had started to form last night.
I guess neither trade was a good entry, trading against the direction of the move at the time so lost a bit today, no more trades for the day then.
I’ll start again end of New York tonight and see where we get to from there.
Their worth a peek… pick a single TF, try out 4h to begin with and disregard the wicks and concentrate just on the candle bodies. Enter long on an up candle body and short on a down and see how you get on. Try 10 trades on the cross of your choice if you like, but I’d try it out first on EU or GU. Let me know the total pips of the 10 trades, I’d be interested to see how HA compares with your current system.
Can I be maverick Hog and suggest purely for the purposes of testing HA you not use a stop? Simply select either EU or GU (I’ll be tracking GU) and enter long on a green candle. Close on a red and start a short. And the opposite. OCO i.e. you’ll always be in a trade dependant on the candle body colour. A stop will effect the test. Stops are dependant on TF, the type… fixed, traling and personal tolerance. I’ll gladly go into detail on how I run my stop, TP is reversal candle body.
So then, for the sake of conversation, please see below chart. The pair is not important to the question RC. To be totally honest, I didn’t even look to see what the pair was anyway:
4 Hour chart pictured above, would you simply wait until the open of the next candle and trade the opening colour (long for white and short for red in this case)??
Or is is enough to enter the trade right now in the direction of the existing last candle?
Here’s the dilemma for the unknowing with the HA candles. These two charts have been withing seconds of each other, again pair not important, but both charts are of the same pair.
4 Hour:
Same 4 Hour chart:
It’s the exact same chart, but if you ask me it’s a different story being told. God I love a good mystery. Some research required methinks RC !!
As I said in a pm to you HOG I am going to put a small wager on this but I am going to wait for the color to turn. Meaning if price has been going up into resistance and the HA candle closes as a red candle I am going to short. Seeing as how I dont have a demo at the moment (had one with forex.com but I guess they got pissed when I pulled all my money out of them and they deleted my demo lol) so I will enter as small of risk as I can. Right now the bobmaninc according to my plan is looking about right for a short later tonight.