The Trader's Arms - Now Open for Business

This is my Technical Analysis for next week

Daily Chart:

Weekly Chart

The daily down trend has been broken and we have set a temporary bottom, in the weekly chart there is a Morning Doji Star (a reversal candlestick formation), and price has bounced off monthly demand zone, the weekly down trend channel and Monthly S1.

TA screams bullish, but as SanMiguel pointed out we are depending on next week news about the Greece deal.

I think we are approaching the days where we will see daily volatilities like in 2008, 250-400 pips moves either up or down

SanMiguel,

It’s been a while, good to see your smiley head this morning! How have you been? Any skiing yet this winter? Tomorrow morning I’m heading up for a quick day on the slopes.

Here’s my take on Greece and the next big EU move. If the Greek debt talks fall apart the feeling will be that Greece will be finally getting the boot out of the Union, that will be bullish for EU. If the talks come back with good news and positive progress that will also be bullish for EU.

How’s that for some advance analysis? LOL

Been skiing for a weekend but hoping to get to the Alps in the next month or so…will see.

OK, so new week just about to get under way and I though I would just add this.

While, as the guys quite rightly mentioned over the weekend, the techninals are probably pointing to a further up move, we are still at the mercy of the Greek decision. And as it stands just now, some 20 minutes before the open of the week’s trading, we looked to be opening with a gap down at the moment, since no decision seems to have come at all regarding Greece.

Obviously any levels we are watching could be blown out of the water pretty quickly if a decision was to come out one way or the other, but in the meantime I’ll add the figures according to the recent research into the Daily pip range averages I did the other week. Again these figures are taken on the ASK price.

One thing I would note just before I add the numbers is that I have seen PipBandit recently add daily ranges, and the figure he seems to be using is around the 130 pip range for the day. Well interestingly enough, my research is giving a daily pip range since 13th Septrmber 2010 of 157 pips, but as I say, interestingly enough, this number has been falling slowly but surely from 161 on 9th Nov. 2011 to the current 157.

So I wonder if the two figures will eventually come together If you do read this PipBandit, could you tell me the source of your numbers please. I would be interested to keep an eye on it to see if the two do eventually come closer together. Thanks.

Anyway, here goes:

Since 13th Sept 2010 until Friday 20th Jan 2012;

Daily Range 157 pips
Daily Av. upmove from open 76.5 pips
Daily Av. downmove from open 80.5 pips

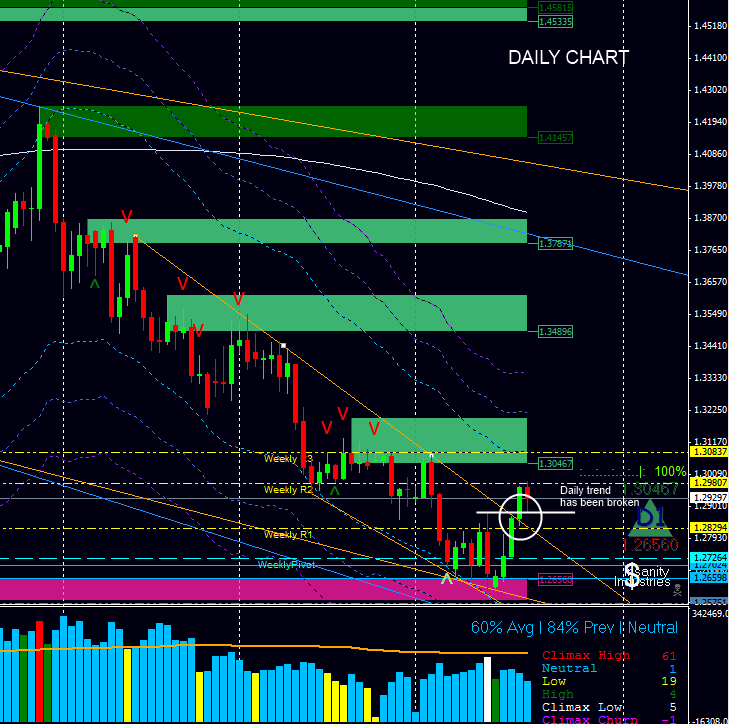
So given Friday 20th Jan 2012 ASK close of 1-29346, we would be looking at extremes of;

HIGH 1-30916

LOW 1-27776

The average upmove would take us to 1-30111, while the average down move would take us to 1-28541

Now obviously, on a Sunday, these numbers would have to be adjusted to allow for any gap, so I’d just add 157 pips to the open to find the high extreme, and add 76.5 to the open to find the average up move.

And subtract 157 from the open to find the extreme low, or subtract 80.5 from the open to find the average down move.

Or, on the other hand, these numbers may well be completely meaningless. Time will tell.

Good luck to all this week in their trading.

HoG

EDIT : Open gapped down 54 pips at 1-2880 so levels would be:

Extreme High 1-3037

Av up move 1-29565

Extreme Low 1-2723

Av down move 1-27995

I have average range for the last 20 days 120 pips. I don’t look further than that as I’m only interested in fairly recent action.

I just use the ATR (Average True Range) function that’s part of all charting packages. I use ATR with a 15 period which equates to the past 15 days or 3 trading weeks as Netdania doesn’t have the weekend bars on the daily charts. Gives me a rough guide of around 130 pips for a daily range and about 85 pips for the 60/70% area where price can stall.

bullish euro. boom shaka laka

Those shorts are getting crunched. My first TP has been reached @ 1.3030 :slight_smile: (from 1.2738) SL already below daily range, TP2 at 1.3190, TP3 at 1.3330

I am being very optimistic with this trade but what a heck… let’s see how it goes :51:

Excellent trading yunny, for those of us that missed the start of the bullish week, do you think there could be a retracement back to 2976 ish on the cards?

EU 15M


GG

The market is all rumours and crowded trades at the moment.
It’s actually an excellent lesson in how the manipulation works to squeeze people out of trades.
Almost every day for the last few weeks it has been bail out rumour followed by refute. It’s quite funny to watch really.

Looks like 1.3075 will hold for a while, I am “guessing” a range between 1.2800-1.3050 next few days.

There has to be a lot of buy-stop orders above 1.3075 that big guys would want to trigger.

at this stage I am only playing PA, S/R in my 8H and 1H charts with a little bias to the upside

There is a lot on your charts for that!! Not knocking by any stretch of the imagination. I’m in awe of the analysis that is going on, and makes me think I need to revisit the school of baby pips once again.

GG

With all due respect to yunny, I wouldn’t try to replicate yunny’s charts if I were you GG. Yunny uses things that have taken time to learn and trust. At our stage, keeping things as simple as possible would be the best road to go down, imho.

Yesterday’s average pip range maximum high (1-3037) wasn’t a bazillion miles from today’s high (1-3054) maybe tempting fate a little by saying that.

My best bet would be for a down move for Tuesday, albeit nothing coming from EU leaders. Just home from work and eating my dinner just now so will put averages up later.

If nothing else it’s an interesting little experiment for the time being

:slight_smile: you are right HoG, I watch anything that can give an edge, but don’t be fooled by my charts… 98% of my trades are based on the most basic concepts of Price Action and Supply/Demand… the other 2% on volatility… :slight_smile:

It’s saying on my trading platform that the Greek debt swap proposals have been rejected by Euro finance ministers. If true, is the Euro in for a tumble ???

I find that horizontal S&R lines drawn where price has shown strong reactions in the past along with previous high / lows (session, daily, weekly, monthly) are a good start for finding good areas to enter. Couple that with some PA to give you a trigger into the trade and you’re good to go mostly. All pretty clean and not complex at all. I use a stochastic on the 15m sometimes as an extra confirmation to get me into the trade. Start off simple and then experiment with bits and pieces to find what works for you. If something works keep it, it not just bin it.

All part of the back and forth going on at the moment - I might be wrong but I don’t think it’ll seriously impact E/U tomorrow. The deadline for Greece debt deal is Feb 13th so we’ve weeks more of this nonsense unfortunately. I think the market believes that a deal will be brokered in the end and that the LTRO is going to keep banks liquid for the next while so rally on while the going is good and squeeze out those shorts. Think we’ll be headed back down again before too long so waiting for the catalyst.

Anyway, todays open is taken for the Eur/Usd at 1-30154.

Looking back over the data I have collected, I would have to be honest and say that the average daily up move and the average daily down move doesn’t really relate that well to what actually happened over the period of 16ish months. In fact they only really have any resemblence to what actually happened 12% and 14% respectively.

However the avrage daily range I have taken runs along side what actually happened reasonably well, shocks to the system aside that is.

Anyway, as you can imagine, not much would change in a day and the Average Daily Range remains the same as yesterday at 157 pips. Yesterday’s Actual range was a fraction over 176 pips.

  • move = 76.8
  • move = 80.3

Although as I mentioned, I’m not really paying much attention to the last two figures now.

So since the open open was 1-3015, I’ll look for an extreme high of around 1-3172, and an extreme low of around 1-2858.

These figures assume no major shocks, well, after all, it’s not as though we’re living in uncertain times now is it ???:15:

As I mentioned in an earlier post, my best ‘bet’ would be for a down move for Tuesday, just on the basis of the three tall wicks on the 4 Hour.

Should probably mention that I am not trading just now as a few personal issues are taking most of my attention at the moment, but I’ll keep throwing my 2 cents in anyway until normal service can be resumed.

If I was to have a go for Tuesday though I’d probably be looking for a reversal of Monday’s action. Also think GU has stalled aroung the 1-5580 area and may be good for a drop as well.

Good hunting gang !!

HoG

Appreciate the advice, I am drawn to the indicators that are transparent of timeframe. S&R, pivots and such like. I don’t like the idea of a strategy based on moving average crossovers or similar. I’m sure it works for some, I just believe (possibly wrongly) that the price is likely to move the way I would expect if I am looking at indicators that the majority are using. Edit: Regardless of timeframe :wink:

GG

I’m not a great fan of moving averages and the like myself GG. I appreciate that many use the more common period moving averages though (50, 100, 200 ) but I don’t use them. ( Mind you, that may explain why my account is stil down LOL !! )

In the end though, you hear people talk about S&R levels, pivots, Fibs. But when it comes down to it, call them what you will, they’re just different names for different Support and Resistance levels, and I guess Moving Avreages fall into that category as well.

You will always have one trader I reckon who will excel in using one particular indicator, or method. But by and large, I think if you just stick to basic S&R levels and price action, it’ll do the job you’re asking it to just as well as any other.