If todays candle on the daily chart stays the same for the next few hours, I believe it would definitely signal an end to the recent bullish move.
Time to go short now???
GG
If todays candle on the daily chart stays the same for the next few hours, I believe it would definitely signal an end to the recent bullish move.
Time to go short now???
GG
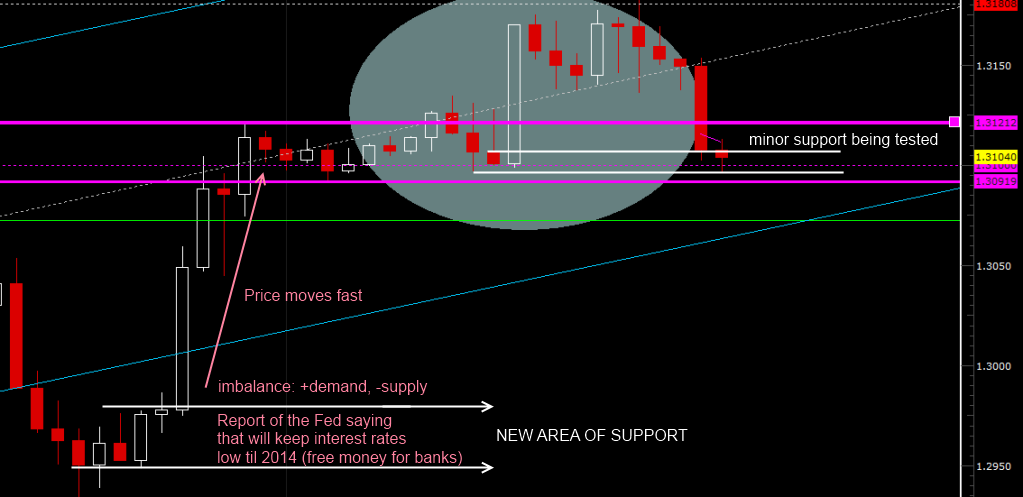
Just a question for the supply and demand traders. In the oval shaded area inthe chart below, you will notice the large white candle that shoots out of a congestion area.

So, after watching a few of the Sam Seiden videos, he mentions that price shoots out of an area like this because all the sellers have sold, and it is only buyers left, so price shoots up.
But this white candle was from yesterday, and this was the result of Fed Chairman Bernanke’s speech. So that is wahat caused the large white candle yesterday.
So the question then is, when checking back on charts to find S&R levels, how do you know if it was too much supply/too much demand that caused the price shift, or a fundamental thing like a news report that caused the shift instead???
As I mentioned in an earlier post GG, I thought yesterday that price was beginning to get tired. If the daily ends up closing with a shooting star candle, I think it would open the door to a move down, but it may be a bit early to declare that the overall downtrend had resumed.
However, as I posted a couple of weeks ago, an analyst from HSBC forecast the EU at 1-20 by the middle of February. Don’t know how much faith anyone puts in analysts though, but if he is going to be right, it better get a bloody move on LOL !!
Well if the price goes up then demand>supply, and viceversa, if price goes down demand<supply, the good thing about seiden’s approach is that you can see the areas where the imbalance is huge, so you can anticipate a reaction of the price if the area is revisited.
I have marked the support zones in your chart, 1.2980 is the price when the fed report was known, because of the news the imbalance appeared… more buyers than sellers
you can see diffference between buyers and sellers in the length of the candle body, the longer the candle to the upside, the bigger the imbalance.
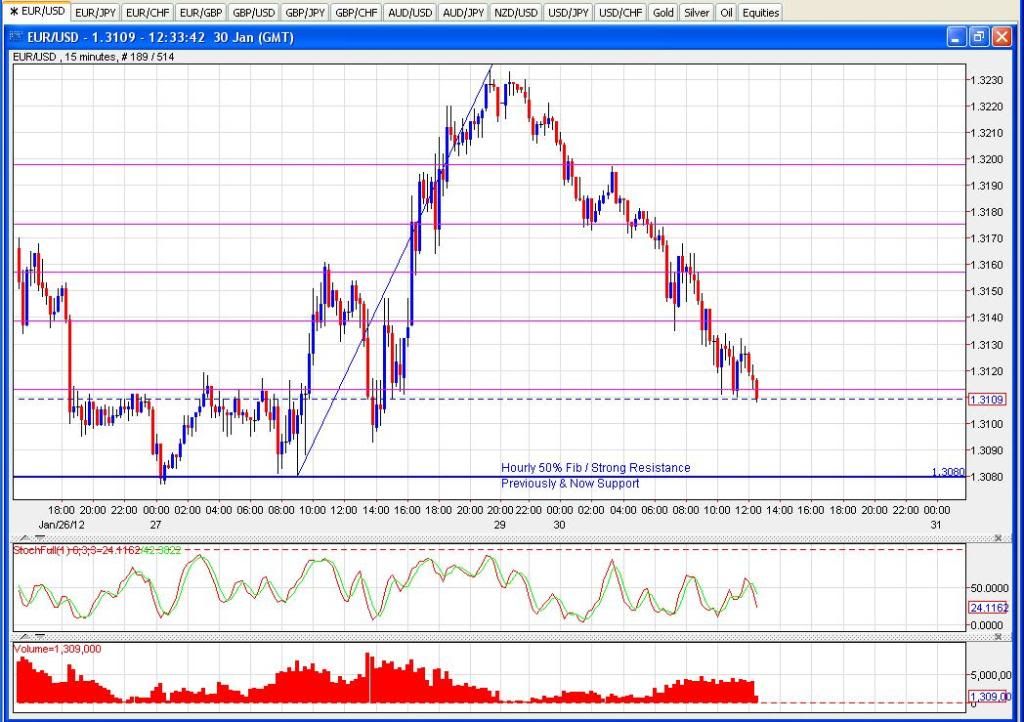
TA for tomorrow:
A pin bar has formed off previous resistance and weekly R2, I will be looking for PA in the 1H chart to place a short at 1.3133/1.3210 area. Possible TPs: 1.2980, 1.2900,1.2850

Just a personal preference question yunny, do you like Sam seiden’s trading method?
I feel as though it does all make sense but struggle to sort out what order to go through the videos. Is it just a matter of sitting throug all of the videos on his FXStreet page?
Yes, I like his trading method but I mixed everything like steve nison candlesticks, volatility and a little bit of VSA.
Here is a good video about S/D from Seiden
There is also a good thread at FF that is easy to understand, his author is also a member of BP. You don’t have to go thru the whole thread just download the PDF in the first post.
With you on that one. Been scalping small dip-buying long trades for the past couple of days but I’ve waiting for around 1.32 - hoping that a decent short sets itself up around there. Think that’ll be an area where a good amount of money could be waiting to re-engage shorts but I guess we’ll see how PA looks. Positive Greece news tonight / over the weekend might lead to a pop up past 1.32 but I’d be looking for an opportunity to fade that.
Well good news here, TP2 has been hit, and it looks like 1.3330 is just around the corner
Today I sold at 1.3147 and got 35 pips, then tried another short at 1.3180 and lost 20 pips 
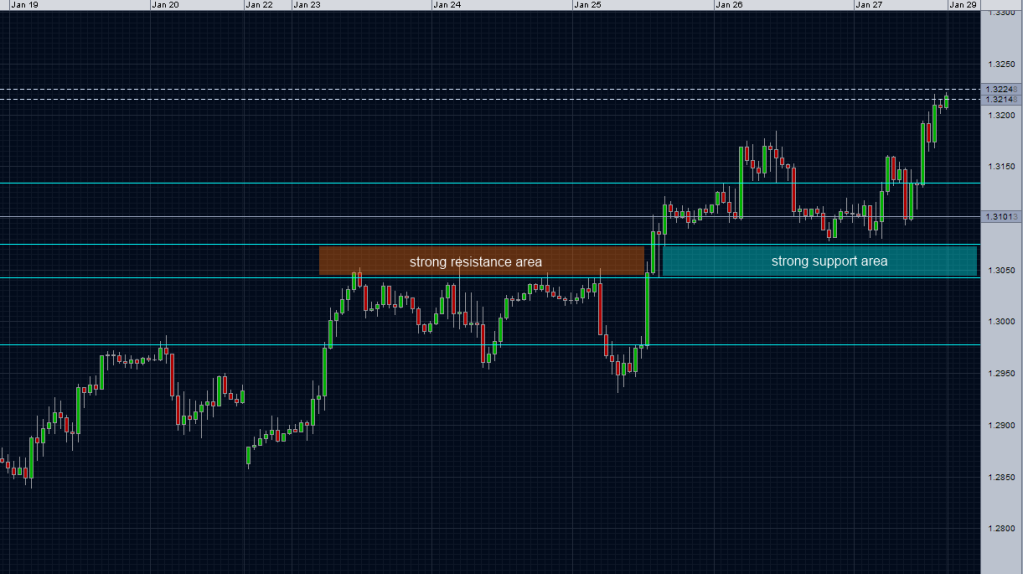
Today the move was clearly a short squeeze, I might look to short again at 1.3280 or long at 1.3100
There is a strong support area to watch now:
1H CHART
Happy weekend…
Well played yunny.
I can’t help wondering though what keeps the Euro so strong. Is it just resilience, or is it that the dollar is in worse shape??
Either way, it’s a hard book to read just now
Dollar in bad shape due to interest rates remaining low until at least 2014.
Euro Greek deal prob happening…maybe…they hope…possibly.
EURUSD has record all time shorts, this will likely lead to more short squeezing as it’s a crowded trade.
Anybody care to toss a coin??
I’ll wait until LO before taking any sort of a position. The negative reaction to the Fitch downgrades wasn’t too inspiring for thinking about a short.
I wonder if a whole pile of Non-Comms bailed out of their shorts after Tues. Was a bit surprised to see that by Tues they had actually added to their net short position. I guess a lot of them are short from good levels and can hedge the upside risk but it must be a very crowded trade still.
Similar sentiment, and not one I’m prepared to get involved in tonight or tomorrow. I’ll probably look at the charts tomorrow evening for any opportunities. With a couple of very small losses and a couple of good winners last week, my biggest challenge is going to be not overly protecting last weeks 4% on my very small account.
Having said that, 4% on one trade did teach me that the art of picking one stellar trade per day week could be the way forward. I have been exceptionally guilty of over trading in the past.
Cheers/klink glasses to a good week.
Andy
I’m looking at a few charts which involve the dollar and you can’t help get the feeling that the $ wants to strengthen. But everytime you play that move you just get your backside kicked
Well, I missed my opportunity, having had a boozy Sunday late lunch, I was restrained enough not to put an order in the market to short the EU. It had hit my 38.2 fib ready to bounce back down.
So it did what I expected, but I missed out as I’d had wine!
New rule for the trading plan, only treat myself to a drink on Friday or Saturday!
GG
Caught a little of the ride down this morning after LO for +0.75%. Waiting now to see if we get to the hourly 50% Fib and previous resistance turned support - would have a look there for some price action to get me into a long.
Long since ~ 50 fibb. We are still in the middle of a bullish sentiment. 130ish is a major psycho level. Above is bullish, below is bearish. imo.
Same here - long filled at 1.3084.
At risk of being boring, Fib levels etc have me long, too. I see that the 240 chart 12pm-4pm (UK) bar just closed as a beautiful low test rejecting the 50 Fib, Monthly and Weekly Pivots to give a little added confirmation.