The Trader's Arms - Now Open for Business

HoG,

You are absolutely correct, too much ‘feeling’ and not enough analysis makes for a poor trade. I got stopped out also, luckily for me only on demo. Now that Alpari UK do a spread betting account on MT4 at 10p/pip , I’m going to deposit enough allow me to trade 1% risk on a live account.

I feel as though I don’t care enough about my demo account. Too willing to let a trade run when I should be taking profits etc.

GG

Yep not going too mad over it. Can’t catch 'em all. Got about +2% for the week so far so happy days.

Yeah I like that Kirk avatar too. It’s the kind of face we all get when a trade goes totally wrong. WHUT???

Definitely worth throwing in 100 / 200 quid into a live account and getting used to working with real money even if it’s small to start off with. It’s funny how the introduction of even pretty nominal amounts of money will make a difference but it will. Once you settle on your strategy or strategies, are confident enough to work them with small amounts of money and are consistently turning a profit then it’s time to scale it up a bit. The initial part of compounding an account is terribly slow if you’re sticking to sane money management so adding some extra cash you have knocking about once you’re comfortable will speed up the process quite a bit.

You were saying previously you were having trouble settling on a method of trading. If you want a really good framework that will give you a solid basis that you can tinker with to come up with your personal approach you could do a lot worse than have a read through the Technical Templates thread:

http://forums.babypips.com/free-forex-trading-systems/29902-technical-templates-continued.html

There’s a wealth of useful information in there that will help you use S&R, trigger entries, etc. In particular I’d pay attention to posts by Tess, Jocelyn, Jimmy, Carll, Jjay, SeanP and On The Bid.

Thanks for the link PipBandit, much appreciated… (I think… another 85 pages to get through!)

As for the 100/200 quid in a live account… watching BBC2 right now… I need to stop browsing telescope websites!!!

GG

This actually reminded me of something today that I had totally forgot about. Might as well do it now.

As I mentioned at the start of the week, I had done some research over the weekend regarding Average Pip ranges of EUR/USD going back to the 13th September 2010., and initially took it up to the 12th of January 2012.

Just as a quick recap, the reason I chose these two particular dates was that the 12th January 2012 (last Thursday) was the day I started the research, and I chose the 13th September 2010 (roughly 16 months previous) was because the Daily opening price was almost identical for both days. (1-2708 and 1-2710 respectively)

Now initially when I first wrote about this at the start of the week I wrote that I had used the BID price for my figures. That was a mistake, it was the ASK prices I used. Anyway, this is what I found, and it will be interesting to see if it relates at all to price going forward from here.

What I did was take a note of how many pips price climbed above the opening price for the DAILY session as a whole, NOT an individual trading centre like London, or New York etc, it was the whole Daily session, 10pm GMT to the following 10pm GMT.

I also took a note of how many pips price fell below the opening of each daily session. I took an average of the up moves, an average of the down moves, and finally an average of the Daily range as a whole. Since then I have updated the figures to include the Daily session that has just closed at 10pm on the 17th January 2012.

So, here are my figures, based on DAILY price action:

Average DAILY up move from open (13th Sept 2010 ----> Now) 76.5 pips
Average DAILY down move from open (13th Sept 2010 ----> Now) 80.9 pips
Average DAILY total range (13th Sept 2010 ----> Now) 157.3 pips

I’m also so boring I’ve got the whole thing on an excel spreadsheet which I intend to keep running.

Anyway, what good is all that??

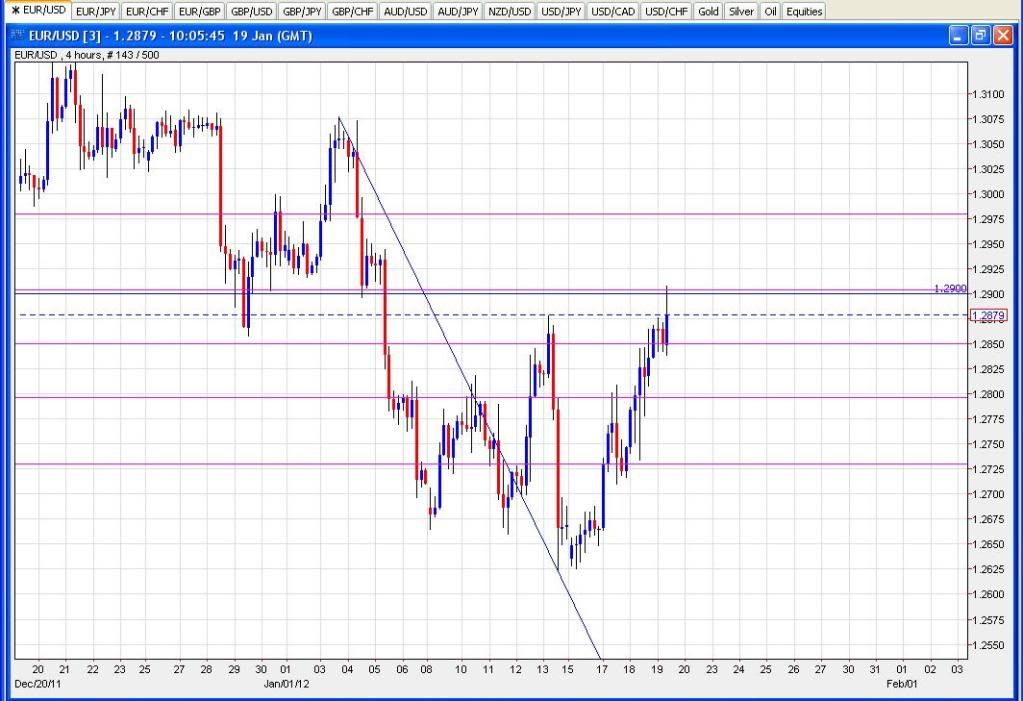
Well, the opening price for DAILY session 10pm GMT 17th Jan 2012 —> 10pm GMT 18th Jan 2012, was 1-2739 (ASK) exactly, as far as I can tell.

So using above figures, on average price could go up to a whole range high of 1-2896, (or an average up move at around 1-2815.)

OR price could fall as low as a whole range low of around 1-2581 (or an average down move at around 1-2658)

These figures may well turn out to be totally meaningless, but you never know.

I did originally write that I would start a tandem thread to demo trade using the ranges alone. This isnt going to happen now. WHY??

Well, as I’m sure the experienced guys already know, a system based on 1 set of figures alone, just won’t work, you need several different agreeing factors to make a positive trade entry decision. And in backtesting a couple of variations of using these figures alone, it has proved very difficult to come up with a winning strategy. (Which is just political speak for "It doesn’t fu****g work !!)

However, as I mentioned at the weekend, even if this excercise proves to be nothing more than just a handy set of figures to have on tap, I enjoyed doing the research. It gave me a look into the method involved in trying to develope a system, how to set criteria for that system, how to back test it etc etc.

One of the main uses of the daily range is to help pick how much room you a trade might have to run in a day and therefore computing your odds before you enter the trade. Your first trade today was a classic example of a trade that has exhausted it’s daily range and was less likely to be a candidate for a long near the top of the range. No sure things of course but it’s a factor I’d consider before entering anyway.

Also, price will often stall around the 60-70% of the average daily range. That can be a useful spot to start paring out of the trade and you can leave the remainder on to see if you can net the whole range if that’s a way you like to exit.

Like I say PB, I’m going to continue noting the figures. Wasn’t really a thing I’d evr given much consideration to until we both happened to mention it in passing last week.

If all it gives me is another little piece of the puzzle, it’s worth it.

In fairness though, I think my first trade today was a bad one on more than just one level LOl !! :slight_smile:

Anyway, onwards and upwards.

It’s funny how it’s happened again but in the middle of all this talk about EU, I actually fancy cable for a short better than Fiber.

Off to bed now anyway mate. Talk later.

HoG

HoG,

As PipBandit said, use the average daily range as tool to enter less risky trades

Here you can see historical dailies volatilities: Forex Volatility

I use adjusted starc or keltner channels to assess the current volatility of a pair.

There are some indicators in MT4 that can tell you the average daily range and the room up or down.

If you mix that information with good S/R and PA, then the probabilities of a profitable trade are high

But keep in mind that the price can move well beyond this bounderies, so don’t forget your SLs :slight_smile:

Nice to see someone put in the work. Kind of the same thing I did on dissecting the COT report. A different way than you typically see here on Babypips. It does work very well and telling me the bias for the week and is very very accurate. However trying to trade this info on demo proved to be impossible unless you had a very large account to withstand huge swings and sometimes for very little profit. It does predict if the weekly candle will close above or below the opening price. But not how far. So I might steal this concept you have here but do it on a weekly basis. This might make my work far more precise.

Shorted EU from 1-2801 this morning, ( 2 lots) . Did have a target at 1-2730 but just closed it out at 1-2757 because banking profits is more important than anything else now.

I know the whole thing about letting winners run but right now I don’t care. Acc balance is at $238 exactly as I write, (up from $216.16 at the start of the week. Looking back over this weeks trades so far I’m reasonably happy witht the majority of them.

Albeit yesterday’s loser was a bad one. Had 2 losers this week, first one was actually a “good” one. Main thing is that from my winners, I’ve traded 2 or 3 lots right up at resistance levels with reasonably tight stops to try and keep a handle on risk levels.

Both losers have hit my stops, again a pleasing thing that I’m actually using stops.

Don’t reckon I’ll be trading again today as I have hospital appointments with the kids. So best of luck to all of you today

HoG

Pretty whippy out there today! Caught some of the long up this morning. Took a short then at 1.28 and promptly got stopped out in no time flat with that spike high. Took a short again at 1.2835 which more than made up for that. Sitting at +5.51% for the week now and +23% since a/c was bumped up to €1,000 at the start of the year. Probably should leave it at that for the week but, eh, probably won’t.

So where people see E/U going over the next bit? Looking at PA now seems to me that a test of 1.2878 has to be on the cards? I’d like to get into a short that has good legs again and a run higher first would be nice. Though if that breaks and holds I’d probably switch to buying dips until the next piece(s) of news that puncture the band-aids over the EZ debt issue.

PipBandit, As I said before, I expect some kind of short squeeze, so traders might get better levels to sell again. Last few days it seems that news can not get any worse, so anything can be an excuse to cover positions.

But every time I say short squeeze …price falls like a rock :stuck_out_tongue:

I went short @ 1-2840. Still holding it as target is 1-2805. If it does get to 1-22820 ish I might just take it as stop is up at 1-2870 and I think you may be right about the test of 1-2880 ish this afternoon.

Just tok a quick squint as I write and I am + 13 so might just move stop to BE. Free up some emotion !!LOL

EDIT: ok so this may well be the quickest EDIT in history. Jumped back over to my chart and I ws + 22 at 1-2818 so just closed it out. No point horsing around when there is good money on the table !!

This kind of price action is tipical of a short squeeze, slowly moving upwards, trying to lure as many sell orders as they can…

tomorrow or friday we will know…

I see nothing to indicate a short just yet, at least on the 4h… long since 2655. Look see London for a possible change?

Yep think you’re right. Just sitting and waiting for the moment here. 1.2780-1.2920 looks like a stiff resistance zone. Think there’ll be a good few sell orders sitting on the books around there. Will wait to see how price reacts around there and take it from there.

I’ll third that - hello Robert, by the way, hope you are well? - but could we see 1.3000 or even around 1.3130ish looks interesting. Feels to me as though this is a pretty strong retracement day at the moment, not sure where it will end. I had a short order overnight on EUR/GBP but the market laughed in the face of that lol.

I’m flat at the moment, enjoying the cold rain, the howling wind and the fact that our Aga is not up to the job of compensating for all the radiators the ground floor of our house is currently missing and waiting for the market to say something clearer.

ST

Short from 1.29. Resistance zone and 62% fib retracement from Jan 3rd drop. Went in pretty light though.

Not sure if it’ll work out but it’s a free trade now with stop moved to B/E.

Fair point, yes, I stand corrected and glad that my reinforcement was taken in the spirit intended!

I know, I had another two hours of Grey’s last night. I do like it, now… but it’s no Top Gear.

Yes, just to be clear, you are quite right about my coach’s take on ‘trade what you see, not what you feel’ - I wholeheartedly agree with him, these days. Once I took that on board I pruned out a lot of the not-so-clever trades and my win ratio went up. I am basically a technical trader, so I just trade the technical setups as I see them. Quite apart from anything else, it is not always clear-cut whether fundamentals will push Price up or down. For instance, some could see Greece, Portugal, whoever leaving the Euro as a good thing, as it could be seen as cutting out some weaker economies, some dead wood, which in turn would be good for the Euro long term, so they could shift their bias to Long. Others could see it as a sign of crisis in the Eurozone, and have their bias Short based on the same fundamental factors. So for me, I trade the technical setups as I see them and over time it works well. I might stay out of a trade for fundamental factors, but I can’t think of an occasion when I have entered one because of them. Shades of opinion on this, including successful traders who disagree with me, but I wanted to say clearly that your interpretation of my view is correct and it gives me good results.

Bloomberg? Dirty word in our house, however good they are - Mrs Templar works for Thomson-Reuters, so I am under a semi-ban on Bloomberg, their major rivals lol!

ST

Don’t let them get their hooks into you ST. It starts with a couple of episodes of greys. Before you know it you find yourself in the middle of a conversation about Eastenders, and the sad thing is you KNOW who all the characters are !!!