No I get it. I just need not to look at it weekly like I sometimes have the habit of doing. Enjoy the weekend!
very nice analysis guys, one thing to watch out for is…
GBP/USD we have a bearish pinbar on the weekly chart at the 5880 resistance level which it has been unable to hold above for the last 5 weeks…we have a fractal high on the daily chart indicating sunday and monday we could see price lower…
EUR/USD we have bearish railroad tracks that broke above 3350 level and then slammed back down below this level…we have fractal high on the daily chart indicating sunday and monday we could see price lower…
AK, where do you get your weekly pivot information, all my indicators only show for the previous week and I don’t think it will recaculate them until the opening on sunday??
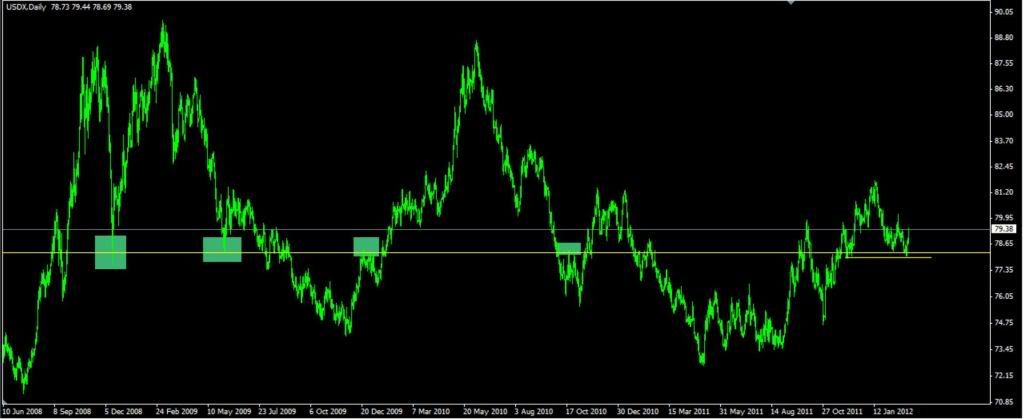
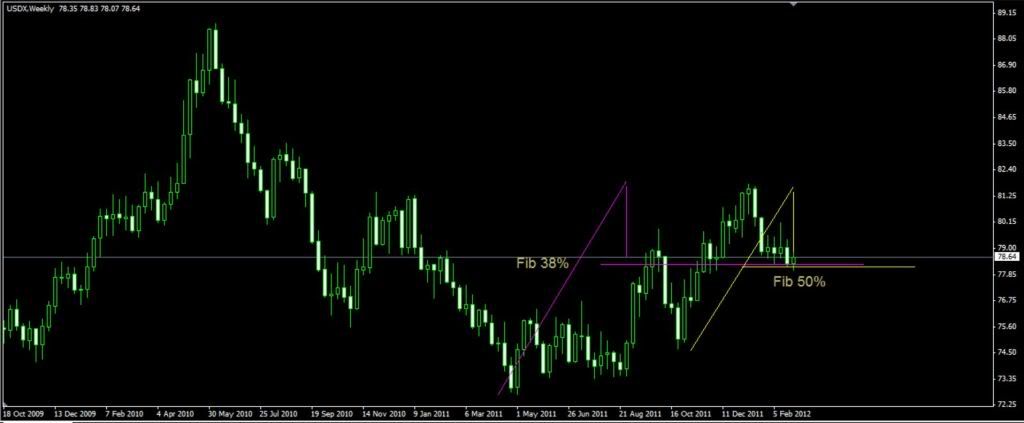
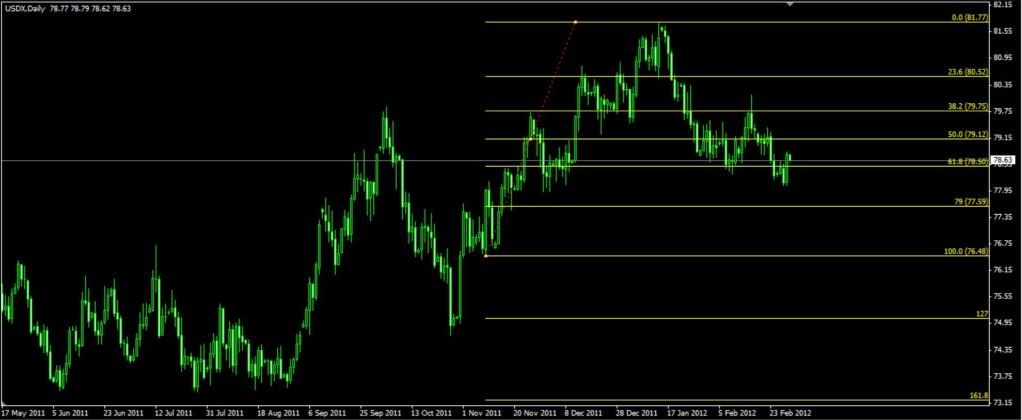
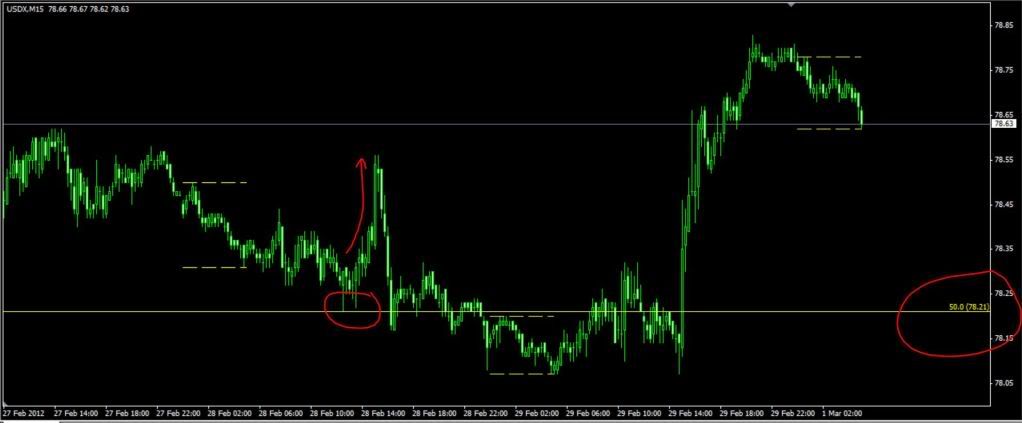
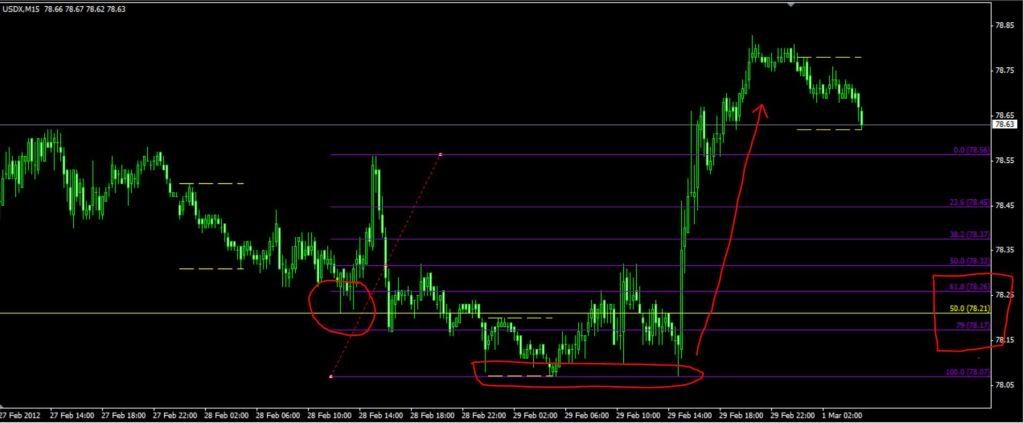
I like the new thread, AK, and a new avatar to match! All great analysis, but I think the USDX is neglected somewhat on all of ICT’s threads. He only really introduced it on one or two videos, but technically it holds up just as well as the majors, and is a great way into a trade on Fiber or Cable. I’ll post up some screenshots and I am sure you can see what is going on so I won’t go into detail. Wishing you all the best for another week of trading…
Ali
Hey guys, glad to see it true, the strength of the wolf lies in Micheal’s pack. Thank you guys for keeping the teaching and info alive.
No, not at all…i read the posts about that after the fact. I can only blame myself.
No worries :57:
AK, could you give me what you think the pivots are going to be for next week, I’m not sure if I am calculating them correctly or not, I don’t think I am because my central pivot for EUR is at 1.3433 which seems kind of high?
For the bearish railroad tracks on the fiber are you looking at the daily chart? Can you direct me to the time if not the daily. Thank you!
I messed up my MT4 platform and nothing with update since my broker is doing maintenance, but I believe the railroad tracks were on the weekly chart
Thanks AK for letting me know what your values are for your pivots, by using those numbers I was able to fix my calculationg. Thanks again.
You can also try this calculator for your pivots (monthly, weekly, daily or whatever) and plot your values to your charts manually:

And for daily pivots you can check yours with these:

Forex Data & Tools by Dukascopy
giving a margin of some pips of difference cause of the difference in price feeds between brokers
P.S.- Something I don’t understand is the huge difference in the S3 and R3 levels, I just have no idea how Dukas calculate their Pivots. So usually with them I check only PP, S1, S2, R1 and R2
Best regards

“Me quedaré, me quedaré, siempre cubano me quedaré…”

Guys,
Please dont mind this question.
I have been trying to find the USDx - Euro overlay chart that ICT uses in his videos. I used the search option in his original thread but could not really find what I am looking for. My MT4 platform does not offer USDx chart.
Can somebody please help?
Thanks.
NetDania Charts | Forex Charts from DailyFX | DailyFX
Click on the link and get a line chart up of the pair your trading. Right click, hit overlay, and then choose the US dollar. Instant PIPS 
Thanks a lot 
Long today on fiber - entered at 1.3208 - first half closed out at + 30 pips and the second half was closed out at + 40 pips . Need to work on trade management for sure.
Hmmm… I didn’t see fiber touch 1.3248…
I’m looking at my phone so I may be mistaken - but I hauled in all of $11 today trading two .02 lots.
Started w/ $1000.00 - My last two trades were losing trades - so I reduced my risk using your model, which I am a big fan of - will be moving my risk to 1.5% tomorrow.