A picture is worth a thousand words so I will let my chart tell the whole story.
I’m tired of loosing money
A picture is worth a thousand words so I will let my chart tell the whole story.
I’m tired of loosing money
It was as if the world was trading against me
What at first jumped into my eyes was that you opened the buy position during an upmove, that knocked on a previous high,
( on your chart on the left side) - kind of resistance zone - wouldn’t have done that - too early. If you had waited that price moves higher than the previous high, odds are better.
It is always easier in hindsight to say why something goes wrong, but there could clearly have been some benefit here from looking at multiple TFs.
Firstly, here is your 1H chart:
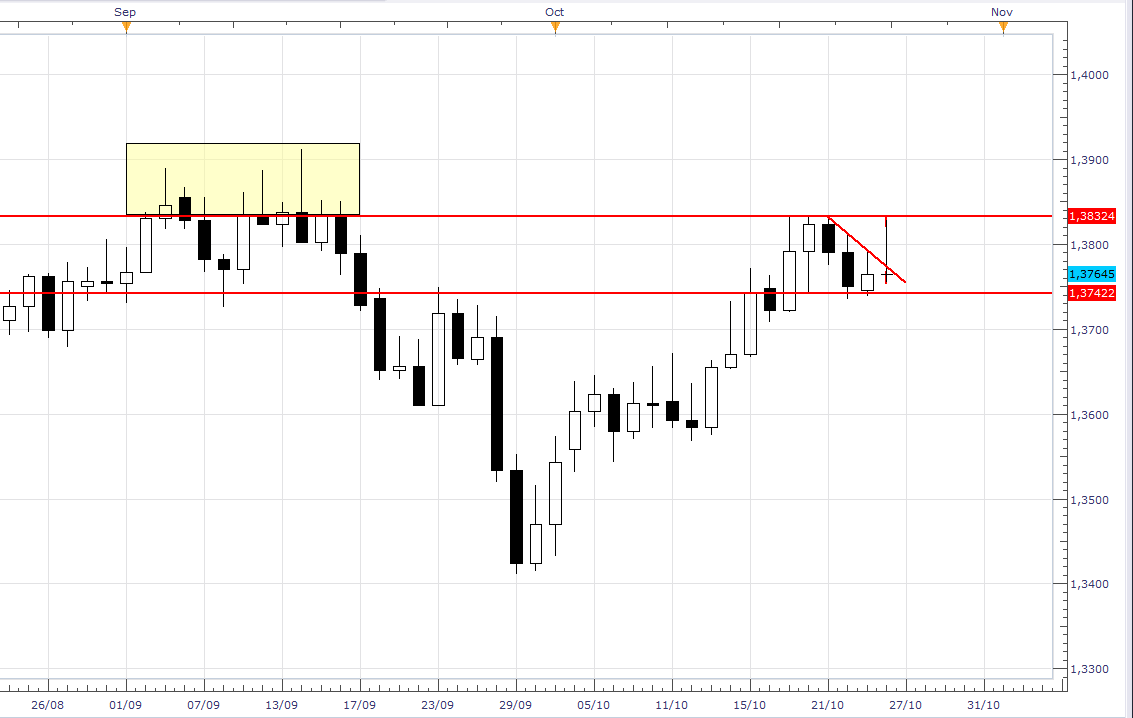
Just look at all those upper wicks on the daily candles during the first half of last month (in the yellow rectangle)!!! It is no surprise that the market dropped when it hit this line! Even if it had eventually returned and broken through, it was almost 100% certain it would drop at least once from such a clear two-week period of resistance, and in fact it had already dropped from it three times this month - but you bought just under it.
Today’s candle is now beginning to suggest that your original idea of selling may well have been correct but waiting for a break through that hourly support line would have honed your timing such that your losses would never have happened! And you may well have spotted that bounce of the September resistance line and sold at a much better price and witnessed an almost instantaneous gain.
Don’t take your day’s losses too heavily, this is how we learn. But I think the big lesson here is that timing is everything and looking at multiple TFs can create a much clearer overall picture than just looking at the intraday.
Hope this helps! Chin up, smile, and live for another day in the markets! 
I am sorry to hear that. Now would be a good time to take a 24 or 48 hour break away from all things trading. After a calming down, I hope the next bit may be of some use to you.
This is my fourth time around in Forex since 1988. I have spent almost a year writing a trading plan. It is not complete and is already 90 pages long. When reading this post what came to my mind was “money management”, so I went to my trading plan and did a text search for “money management” for which I found 42 entries. That is how important it is. I won’t go into War and Peace here, but two summaries that may help you in future, and from which I have copied from others are:
Plan actions, in order of importance are:
Money management
Trading Psychology
Technical analysis
Below is a dump of the first four of my list of over 50 trading rules associated with Money Management.
Rule, statement, action (or plan validation). These are what I refer to as a Requirements Traceability Matrix, from classical project management methodology, and for each trading plan I complete, I will compare it with all 50 odd of these rules, a list of habits, elimination definitions and algorithm definitions.
• Rules definitions = R1, R2, etc
• Habits definitions = H1, H2, etc
• Elimination definitions = E1, E2, etc
• Algorithm definitions = A1, A2, etc
.
If it does not conform to all requirements, it will not become a trading plan that I put into practice.
Selected rules as an example:
R4
Apply money management techniques to your trading.
See Money Management section of Plan but basically apply 2% of Forex bank unless special rules dictate otherwise
R9
Don’t just trade the volatile contracts
Understand and account for the volatility of each pair with use of ATR first part of Algorithm. Addresses Money Management.
R14
Have a disciplined, detailed trading plan for each trade. i.e., entry, objective, exit, with no changes unless hard data changes.
Disciplined money management means intelligent trading allocation and risk management. The overall objective is end-of-year bottom line, not each individual trade. Validate in the trading strategy and plan content. Use the trade journal from entry onwards. Validate with Money Management section of Plan
R17
Trade with a plan-not with hope, greed, or fear. Plan where you will get in the market, how much you will risk on the trade, and where you will take your profits
Refer to the Algorithm. Validate in the entry criteria and journal. Money Management, trailing stops and exit criteria on daily basis.
R36
When you open an account with a broker, don’t just decide on the amount of money, decide on the length of time you should trade.
This approach helps you conserve your equity, and helps avoid the Las Vegas approach of ‘Well, I’ll trade till my stake runs out.’ Experience shows that many who have been at it over a long period of time end up making money. Validate with money management plan
Aww this is nice of you! Not only do you have encouraging words but you also broke down what happened to the trade!
And also @nu_bee, I’m glad you explained what happened with this screenshot including labels! We def don’t see many members who take the time to do this. I think this alone already sets you apart from all the other newbies we typically see here!
I wish you luck and continued persistence to succeed!
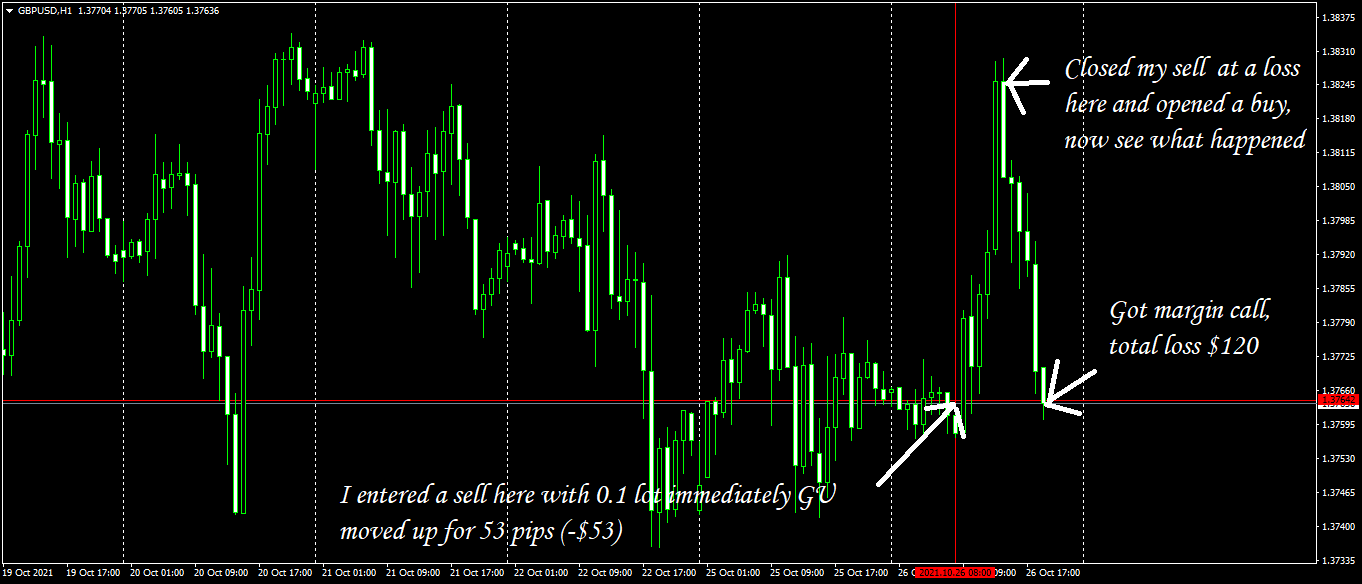
Thank you SovoS. I would have left my initial sell idea but seeing market move 53 pips against me in less than one hour made me think the up move is going to break any resistance level
IMO, this GBP/USD pair is the toughest to trade out of all the 28 pairs. I have never succeeded in making a profit long term. IMO, the market sentiment rules the ocean, with fundamental media reports influencing price movement beyond other pairs.
While speculative, I wouldn’t rule out competition between UK & NY institutional traders affecting short term price movement.
And I agree with SovoS, while the wave pattern is in a downward trend, selling at your entry point is premature, as a retracement could well be on the cards. Same with the buying entry, where it meets a clear resistance zone.
However, your chart was crystal clear, thanks for posting it, and I sympathise with your grief. In future, ride wave patterns, as whether it’s a good probabilty where to enter a buy or sell trade.
Don’t worry too much. it happens to all of us. I blew my DAX entries yesterday when I failed to trigger two pending orders because my volume lot size was too small. That cost me several bucks and a few beers watching both trades hitting profits within minutes…Ugh.
WHAT?!?! Haha
This part hits home for me. As for me, 2% is way too much risk per trade. Losing as a beginner is awful. 2% per trade could turn into a 20% loss by the end of the week.
I could be ok with losing 5% in a day, but not everyday.
I’m surviving the losses because my risk is so low. I’m talking about 0.15% per trade, or up to 0.5% (maybe).
I’ve had lots of losses lately. I’m glad I was risking so little. I should have gone back to trading 0.01 lots, but I had the “well what if I’m right” attitude. Which isn’t helpful, by the way.
I’m curious what % risk OP was using…
Blowing an account is significant. That’s probably a good time to reflect.
@nu_bee , did this one trade blow your account? Or was it the last of your money?
I fully understand what you are saying here.
But I would offer two thoughts here:
When trading off short term charts (less than daily) then our own sentiment is really quite irrelevant since spikes/jerks/jumps/wiggles etc occur randomly all day within any overall direction. Therefore, our chart reading is far more relevant and should cover at least three factors: where/when to enter, how far price might reach and where price tells us we are wrong and to get out.
Although there are many different instruments, we are not actually trading pounds or dollars or yen or oil or gold, etc. We are trading only one product, and that is probability. It is the same in every instrument. We never know what will happen next but we can assess what is most likely to happen.
And this leads directly to the same conclusion as point 1. Unless you are a wizard at collecting and analysing all relevant data and sentiment affecting an instrument at any one time you cannot predict what will happen next on short term charts.
So what are we left with? Well, your Technical Analysis. And that is all you need from your charts. By looking at where price is and where it has been one can evaluate what is the most likely next move and on what conditions. But, again, it is crucial to success that one evaluates those same three things: which direction is most likely, how far in the right direction is likely, how far in the wrong direction before our scenario is invalidated and time to exit.
Without these three related factors you cannot perform the most crucial and decisive step that divides the winners from the losers in this business: Your risk management. Once you have these three factors in concrete terms you can evaluate the trade in terms of your risk P/L parameters and decide on the validity of the trade. E.g. if the likely profit is small relative to the sensible stoploss level then reject the trade. If the profit level is good v. the stoploss cost but both too distant in absolute terms then take a smaller position size, etc, etc.
This way, you only take high quality trades both in terms of high probability of success and high profit v. loss ratios.
If you had taken this kind of approach to these two trades you mentioned above you probably would not have made this thread in the first place!! Why? Because, whether they won or lost, they would have done so at levels you had already pre-defined and were within your trading parameters. In other words, you are looking at the long term profit growth evolution rather than just focusing on each individual trade as a success or failure.
Just some thoughts, not necessarily correct, but hope it at least stimulates some constructive thinking!
Thanks for taking your time to respond to me thread. I have to start building up again.
Forex trading is difficult
Well that is a very positive attitude! Why? Because you said “difficult” and not “forex trading is impossible”!
It is also positive because it is realistic. Personally, I would say trading is “demanding” rather than “difficult” but either way, you are recognising that trading is a profession like any other and, like any other profession, one cannot expect to just show up and make a million.
We don’t hear surgeons or pilots or tax consultants or bank lenders moaning that their work is difficult, but they do accept that it is demanding and challenging and requires a lot of knowledge, experience and preparation…why would trading be any different?
But there is one big difference - there are no recognised and authoritative trading schools or qualifications or apprenticeships, etc. To a very large extent we are alone in our training and our work. We tend to grope around in the dark for teaching and tend to prefer Youtubes to reference books for learning. And the end result is we often learn the hard way - through our own mistakes. And many don’t survive that process.
But recognising that trading requires a professional approach is a good start!
There are many different approaches to learning and trading, but I would suggest just starting (again) with one instrument and live with it constantly. Watch its every move, see what charting tools help identify key moments, levels and moves, define a trading strategy, start with small positions and only according the strategy rules, document and analyse every trade taken, even analyse every trade not taken, adapt and expand your strategy systematically…
And at all times, remember that every professional in every field, no matter how long they have been working, accepts that they have to constantly keep up to date with their field of work and constantly practice and develop their skills. And, maybe most important, remain positive, confident and maintain pride in your expertise.
Go for it! 
From what I can see the sell was placed without any break of structure to support the idea and certainly no confirmation. The buy was in reaction to the loss on the sell and likely an emotional and impulsive order assuming that it’s gone “against me this long so it will likely carry on”. As someone above has said the point of buying, price had cleared some previous highs and cleared the liquidity there so a return back down to a level of retracement and internal liquidity would be the next port of call and where a buy might have been higher probability.
I feel sorry for you but as the chap above me said your trades weren’t based on TA with confirmation only based on a hunch and impulse.
This isn’t sustainable I’d advise demo for a few months until you can master 1 pair 1 strategy don’t risk anymore capital
You say a few posts down
Yes for those of us who have a history of doing “those bets” exactly as if that is the case. When I started on the DOW 25 years ago there were two of us who could be relied upon to hit exactly those moves to within a pip or two of teh exact tops and bottoms. PROVING BEYOND REASONABLE DOUBT THAT OUR EMOTIONS WERE EXACTLY IN TUNE WITH THE “MUG MONEY” in the market.
so bear in mind that when you are desperate to get “IN” with an up - bet - that is exactl the time to take a down bet ! - MARK MY WORDS !
you are a perfect contra- indicator - NOW it’s up to YOU to learn how to USE THAT ! 
[Hint “Wyckoff” may have something to offer you here - but don’t be alarmed - you are a novice - there will be more losing bets ! just be aware that you actually have a valuable gift ! ANd whether the market is manipulated or not - doesn’t really matter - because the effect to you (and me) is such that we can believe ot IS ! and succeed by following that assumption ! 
Perhaps it may hep if I also point out that the pair had been in “Congestion” for aBOUT 12 HOURS PRIOR (Wyckoff “accumulation”?) and also the move failed just a few pips short of the previous “Double / triple top” which would have alooowed trapped “Longs” from those moves to get out with minimal losses l (So note also support and resitance zones.
Often these moves happen on “News” - but not always and not always in the logical direction !
Watch, learn, observe, persevere !
This is very true. The OP played the game by all the TA rules - he was on hr1 for a short term move - there had been a triple top formed H&S with broken neckline and a series of lr hi’s after the triple top.
Below is a the chart that the OP was looking at just before sell entry.
So what happened Oct26th?
First thing is to understand that the up move was GBP only and not USD selling (see eur/usd) - and right now the market is debating how soon the BOE will raise rates. The BOE are recently signalling sooner rather than later although there is a huge debate therein.
Bottom line is that any news that has a bearing on BOE decision making will cause price to move beyond what it would be expected to do.
Buyers came in on Oct26 but not enough to make the triple top, 2 days later they had another attempt and again not enough of them to reach the previous high - so price then duly fell due to lack of buyers (not to say they won’t be back)

Edit: forgot to say - the CBI UK Retail report was released Oct26 - 30 vs 13 expected.
Going forward - actual retail sales UK will be published Nov19 so watch GBP that day.
They were last published Oct22 for month Sept. and were disappointing (DT formed Oct21) - there is a heads up on what may actually happen a couple of weeks beforehand here:
{This was published Oct12)
Retail Sales Slump to Worst Performance Since January (brc.org.uk)
If you look at the left part you chart you can spot similar behaviour, down and then up. GBP is prone to abrupt movements and I wonder why you decide to open the second trade at the top
This looks very interesting.