Hi everyone, if anyone is reading this!
I am going to be journaling some of my day trades, I want to assess my own performance by writing out my thought processes and see if that will also help me identify some similarities and when I go wrong.
The goal is not perfection the goal is to be consistent.
The word consistency gets spouted out in the forex world but it is very important to repeat an action that holds a positive probability to achieve a positive outcome.
My strategy uses the VWAP bands, RSI and Volume Profile.
Happy for others to post or share ideas, not sure how these forums work as I am a newbie to them!
1 Like
Welcome!
I’ve never used VWAP bands, but I see it is based on volume and price. I look forward to seeing how you make out.
Do you have previous experience day trading? There are a few day traders here as well.
Good luck!
1 Like
Thank you!
I do have some experience I usually trade much higher time frames than I am going to in this topic.
I typically trade higher time frame levels and enter on the 4hr time frame so this is a change up for me.
Good to hear a few day traders are here as well I hope they would share some knowledge!
Do you day trade?
Hi
Nice first post .
Consistent ,what’s consistent to you ???
Consistent profit percentage
1 Like
Daytrading is the best - I swear on it. Especially nowadays in such a news driven market I wouldn’t speculate on price movemens that will happen next days based on chart patterns or technical indicators - news knock out technics or patterns, that’s actual more valid than ever before
3 Likes
There so much negativity regarding retail daytrader,after a few years of experience I tend to agree especially regarding Forex the indices are going to range probably for the foreseeable future too .
Just a view on RSI that was reviewed and tested on No Nonsence Forex YouTube. Some of his outcomes are useful, others not.
For RSI he found the only useful indication was showing trend volume, not whether it was overbought or oversold. Hence I use RSI to back up MACD (3:10:16) histogram with the following settings:
RSI (10) Only use a 50% line, above is bullish trend and below is bearish trend. I also know that some traders build in a zone around the 50%. I changed (14) to (10) to cater for a tighter strength analysis.
Best of luck.
I daytrade indices - ranges are relative, what looks like range on a higher timeframe can reveal nice little trends on lower timeframes. Often I see range bound days on the 5mins giving 40 or 50 point micro-trends on the 1min chart.
Hi,
Thank you!
consistent to me is taking entries that align with my ruleset as this will give me my edge. I also want to be consistent with my stop and target management, in testing the trades can go through the VWAP and to the other standard deviation so I want to be able to maximise by letting the trades run.
1 Like
Thanks for your insights!
Hi Steve,
Thanks for sharing, I am using the RSI to identify divergence maybe I could use a tool that would show divergence better than an RSI?
That is interesting I used to know a trader that waited for the market to go overbought to show that the market was continuing to move higher and would buy when the line moved back above the 50 after a pullback. Seemed to do well out of it.
Of course I’m talking about traders who trended the majors indices days ,months years
Day 1: S&P500 longs
Bias: My bias for today is actually short, the price was trading below last Fridays value area low which can often see price continue to the downside. Not only this but the daily time frame has recently seen the price retest the highs this can also often lead to a reversal forming.
Now typing this up the price has come into the previous days value area low and is rejecting with bearish divergence on the RSI also at the VWAP of the day. We could watch for a setup short here.
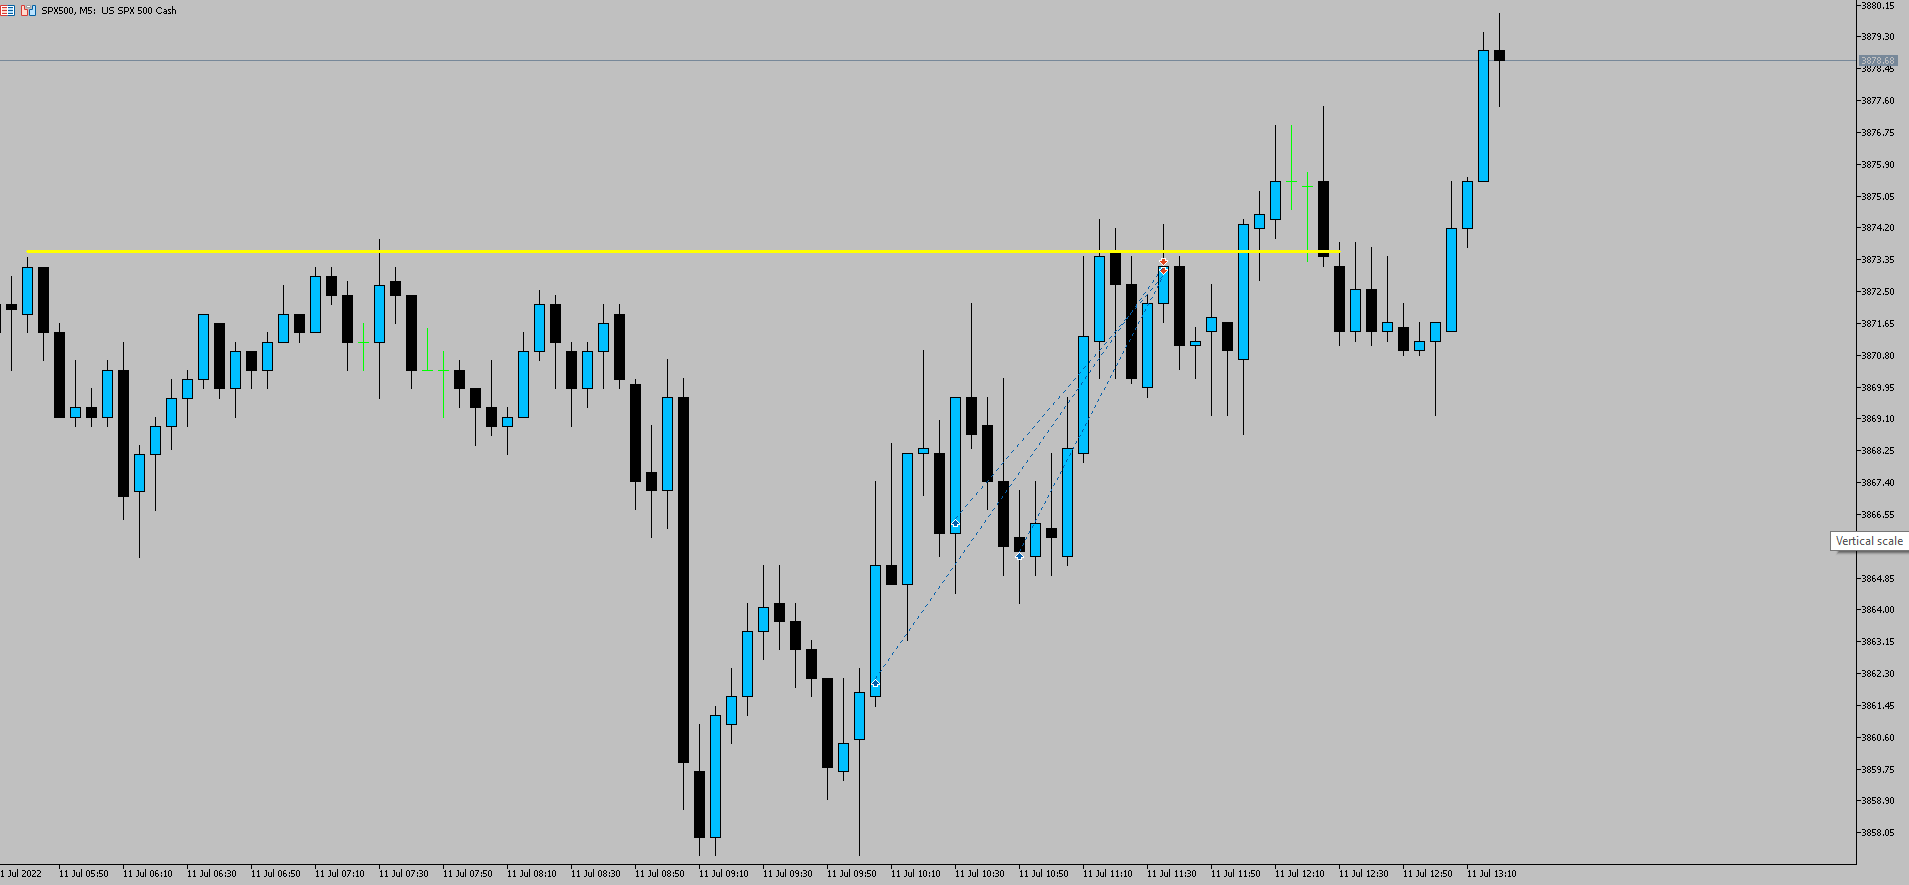
For context this is what my chart looks like (I know it looks very messy but I often delete half of it once I know the levels to work with).
Despite my bias being short the price has been falling and had retested Fridays low, so I waited to see how the price reacted around this area as we were also at the -2SD on the VWAP band.
Trade: The setup is a double bottom pattern with bullish divergence on the RSI. The entry candle was the strong bullish rejection of the lows. Stops tight underneath (this helps with the R:R ratio)
Trade Add Ins: I use add in positions once the price breaks structure to build positions when I enter at the lows this is 0.5% of my risk, I never go over this at the bottom or top, I only add in when price confirms break in structure.
Result: Positive outcome, I closed the positions at the highs where we had seen rejections on the day. This area was also the VWAP of the day so far.
Day 1: S&P500 shorts
See previous post for more details…
This late morning/early afternoon trading was a bit messy.
Bias: The bias was short for me today due to the price being below Fridays value area low and the daily chart was at highs.
When writing out the longs this morning I saw the price retest this area and form bearish divergence on the 15 minute time frame. We were also at the VWAP.
Trade: I went down to the 5 minute time frame and saw the price has rallied and looked to be forming a lower high, entered a position on the pin candle.
Add Ins: Price then broke lower forming a break of structure, I was waiting for a pullback and entered a bit too soon, waited for another retest and added again. Once the early entry trade was in profit I closed as I felt this wasn’t a position I wanted to be in.
Closed: I took partial profits on the first position and then let it run to the double bottom neckline we went long from this morning.
Was expecting further downside and the price looks to have retested the VAL before dropping further.
Day 2: S&P500 shorts
Bias: The bias was short again today, daily candle closed bearish was looking for the momentum to continue going into today, the price was also trading below yesterdays value area low.
Trade: The trade came after the price rallied back to the VWAP of the day and the previous highs where sellers were active. Saw multiple rejects so activated a short position targeting the lows.
Add Ins: no add ins the price didn’t retest the lows once broken.
Closed: Closed the majority of the position as it approached the area where buyers stepped in, left the remaining position open but got stopped at breakeven.
Day 2: GBPUSD Long
Bias: My bias for is to buy the USD in general so I wasn’t looking for a big move long here on GBPUSD today. Yesterday was bearish, so I am looking for a continuation of the move, if the price was to retest the VAL. I missed a trade this morning short from the VWAP and VAL, so I was a bit disappointed by that.
Trade: The price tested the -2SD of the VWAP and formed an impulsive move higher on the 15m chart. This made me think one or two things, we could be seeing sellers profit take, or buyers are interested at these lows. When the price retested the zone on the 5m I entered long looking for a move to the recent resistance high.
Add Ins: none as I felt the market was heavily bearish.
Closed: took profit at the recent highs, in hindsight the price has remained bullish and is back at those highs and could possibly reach the VAL of interest, I could have taken 2 positions or banked half at the highs left the rest open with stops at breakeven.
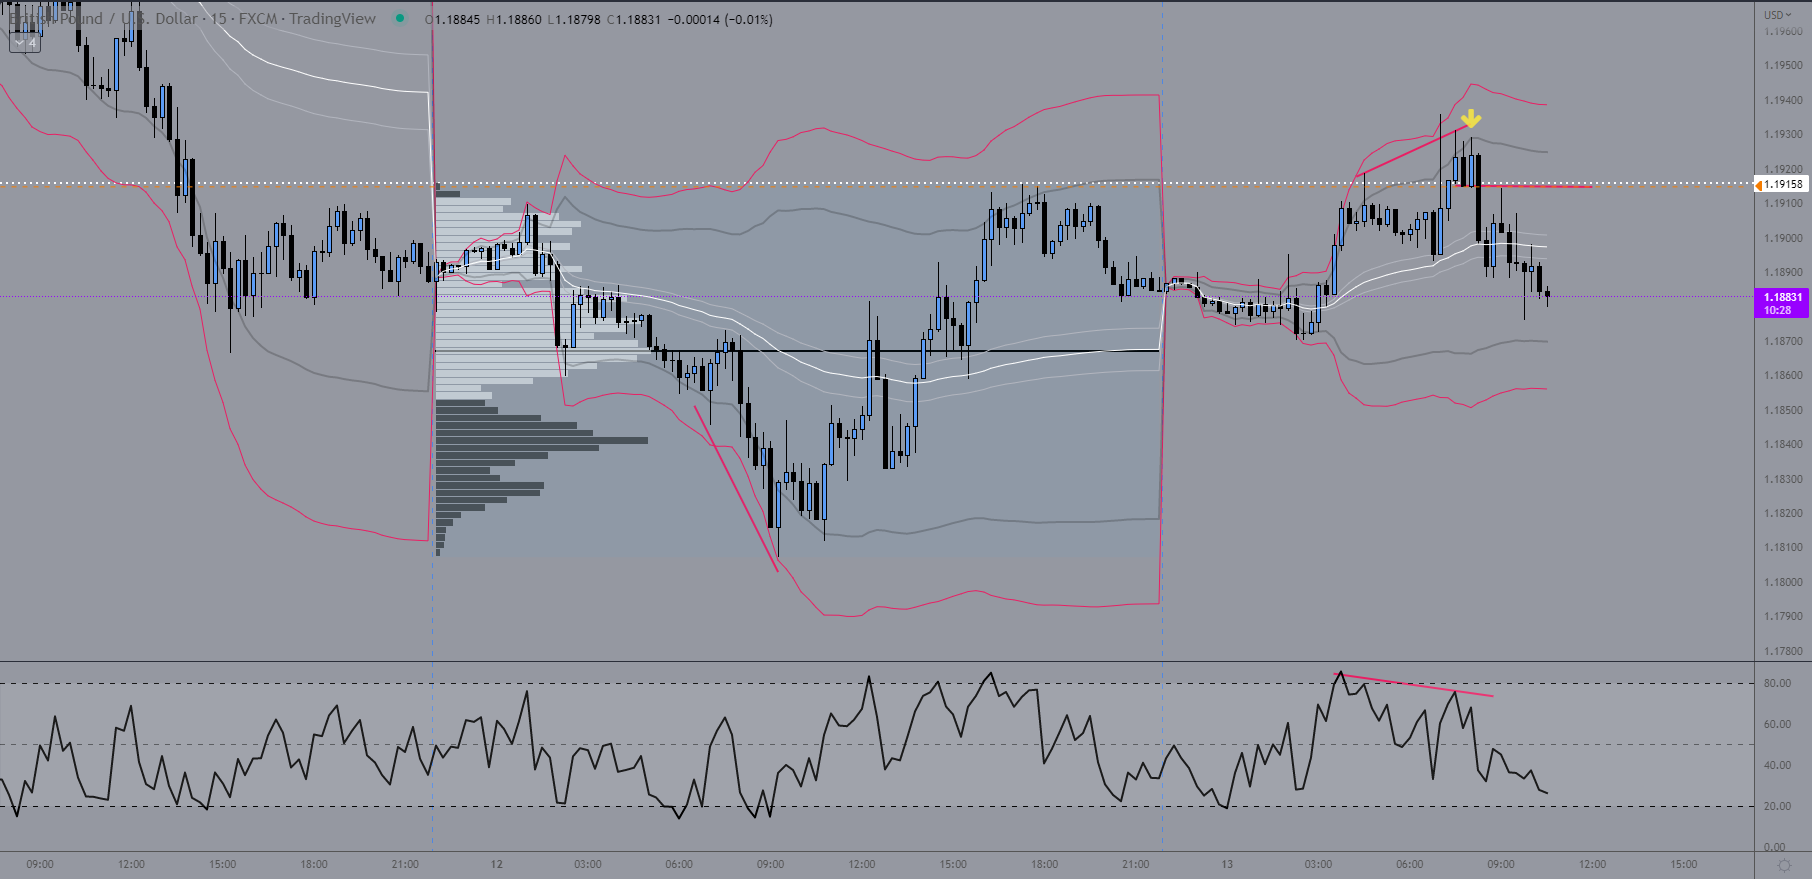
Day 3: GBPUSD Shorts +28 pips
Bias: My Bias for today was short GBPUSD despite the recent daily close. The price opened up in yesterdays value area and auctioned up to the value area high and yesterdays highs. I wanted to see how the price reacted to this area.
CPI data out of the US could show another rise in inflation so I wanted to be on the buy side of the USD.
Trade: Got in a bit late on this one, the price formed the strategy rules with bearish divergence at the highs, the price dropped lower and retested on a 5 min timeframe. This was my entry into the market, I was looking for the price to test the current lows of the day or yesterdays PoC.
Closed: Took profit on the trade for +28 pips as the price was testing the previous demand zone.
Observations: I could have made a few more pips if I sold under the 15minute bullish candle at the high, also the TP looks to be a good area for profits as the price has bounced at this demand zone.
GBPUSD Longs +21 Pips
Before I get into this one I was a bit disappointed with my entry, I got spiked in when applying the buy stop order which made the risk a little more than it should have been.
Bias: Bias for the day is short due to the strength of the USD. The daily chart also showed no buyers stepping into the market. My area of interest was the value area low of the previous day highlighted on the Trading View chart. We can see that the price did react from the VAL but there was no divergence.
Trade: Went long after the price reacted from yesterdays low and the -2SD. The price rallying higher showed buyers stepping in so I waited for a retest of these lows, the 5 minute formed a bullish reversal pattern and I took the position long.
Closed: took profit near the highs, was looking for the VAL as targets but closed early thinking we would reject the highs.
Observations: not a bad trade but the execution could have been better.
S&P500 longs, shorts and whatever else -return (don’t know how many pips it was in the end)
Bias: again bias was short today because of the daily time frame however the price looked to be forming a rejection at the -2SD and yesterdays low.
I did not wait for a significant push away in price, instead I just dove into the 5 min timeframe and bought a slight pullback.
Disappointed with myself here, instead of taking the losing trade on the chin I ended up spamming order, selling when the price went lower and getting in my own head, closing because I was doing stupid entries and then re-opening because I liked the direction.
Was just a complete mess but I am documenting it so I can learn from my mistakes.
Believe it or not still ended up the day positive because of the GBP trade earlier.
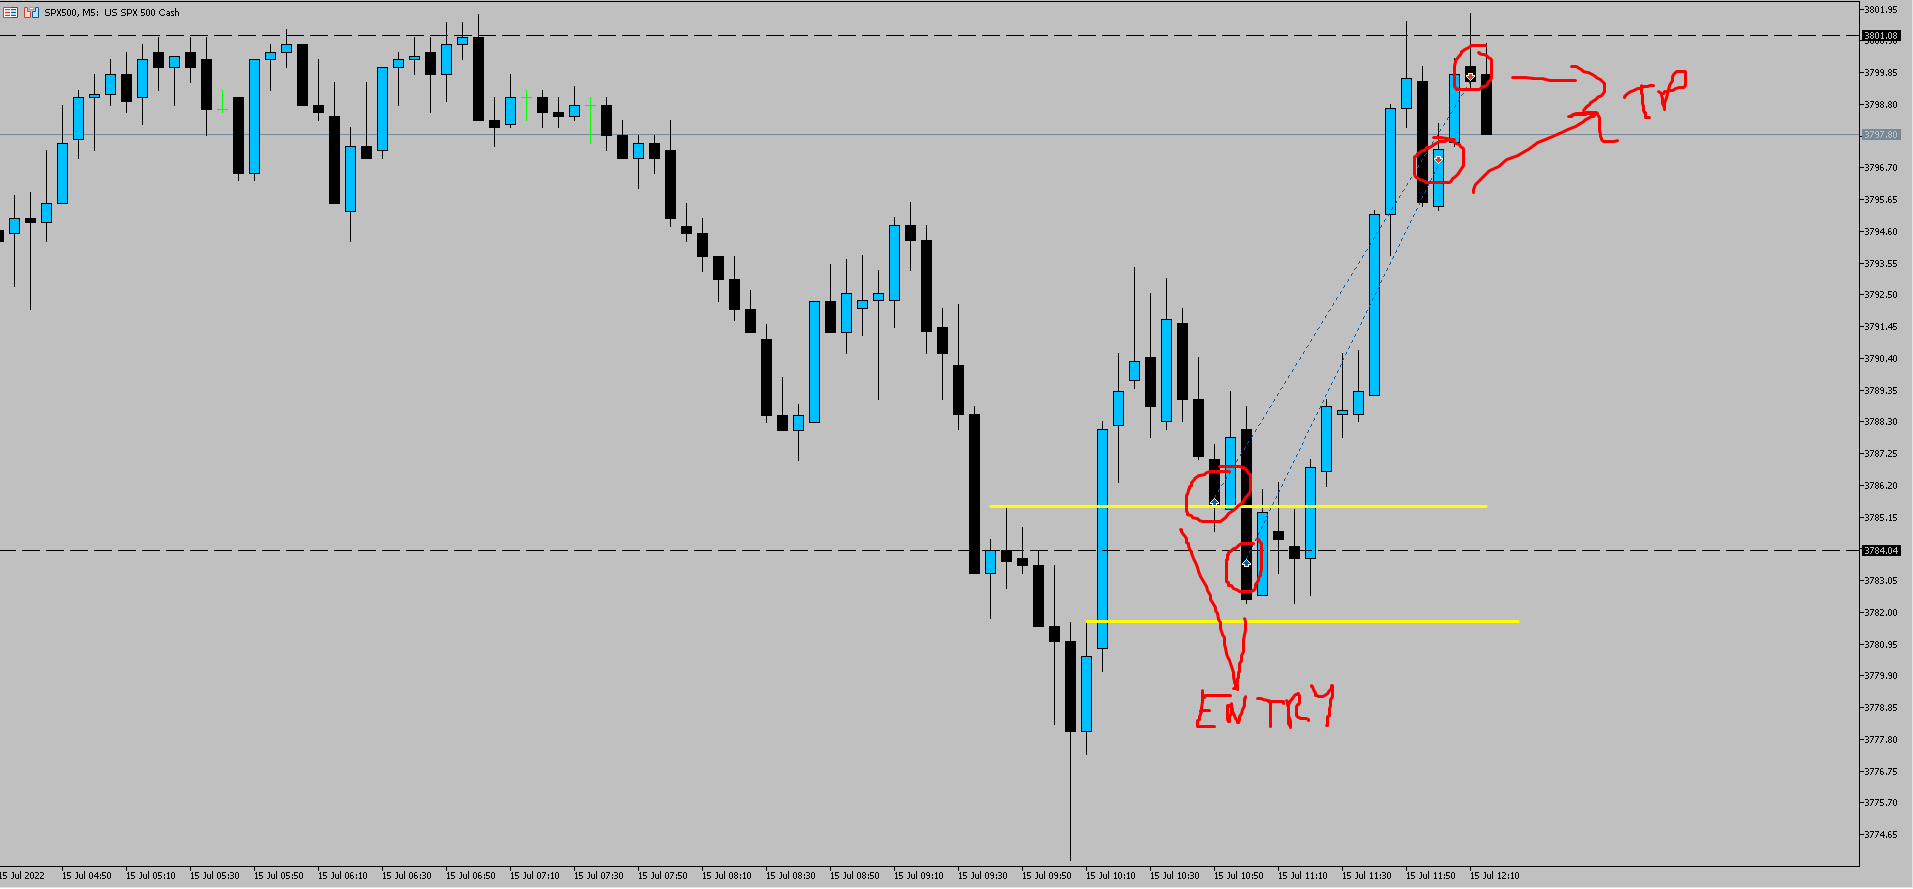
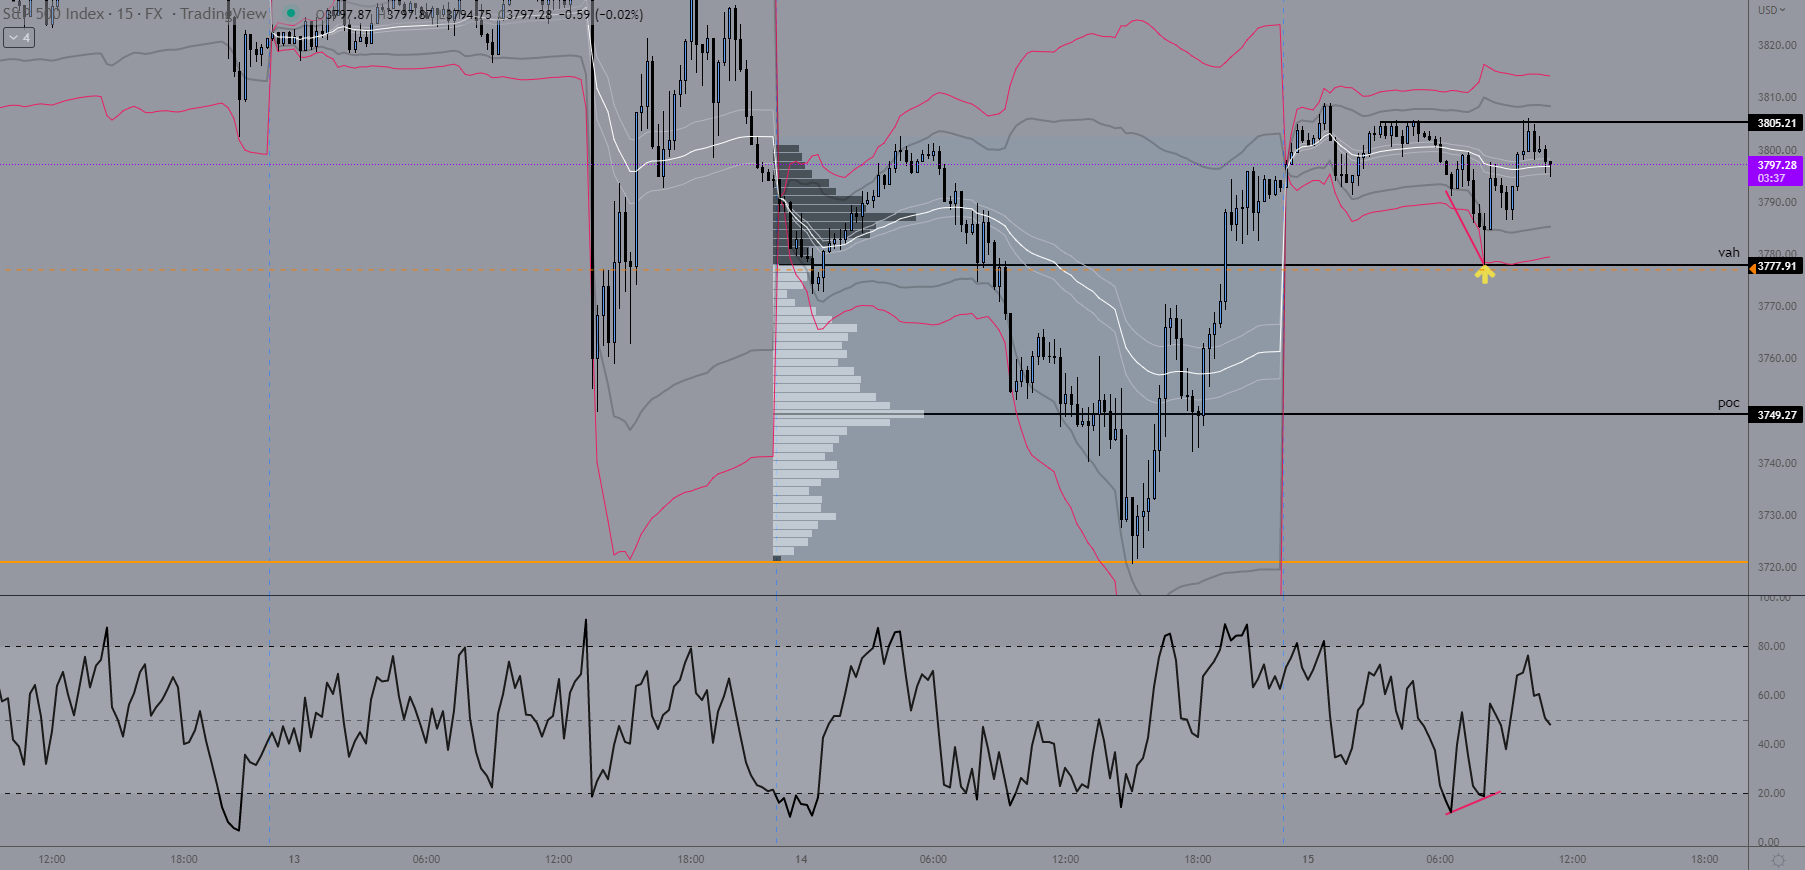
S&P500 Longs +3R
Bias: The bias for the S&P500 was long today, the daily chart showed a pin candle formed after retesting previous lows. The price also opened above the Value Area High on the volume profile suggesting a move higher was more likely.
Trade: I waited for the 15 minute timeframe to reject the VAH level and -2/-3 SD on VWAP, price then pushed away showing me buyers stepping in. I then waited for the price to pullback and entered on retests of previous areas.
Closed: Price rallied and I took profits after the price began to reject the previous highs of the Asia session.
Observation: followed the plan this morning which helped instead of trying to chase the market.